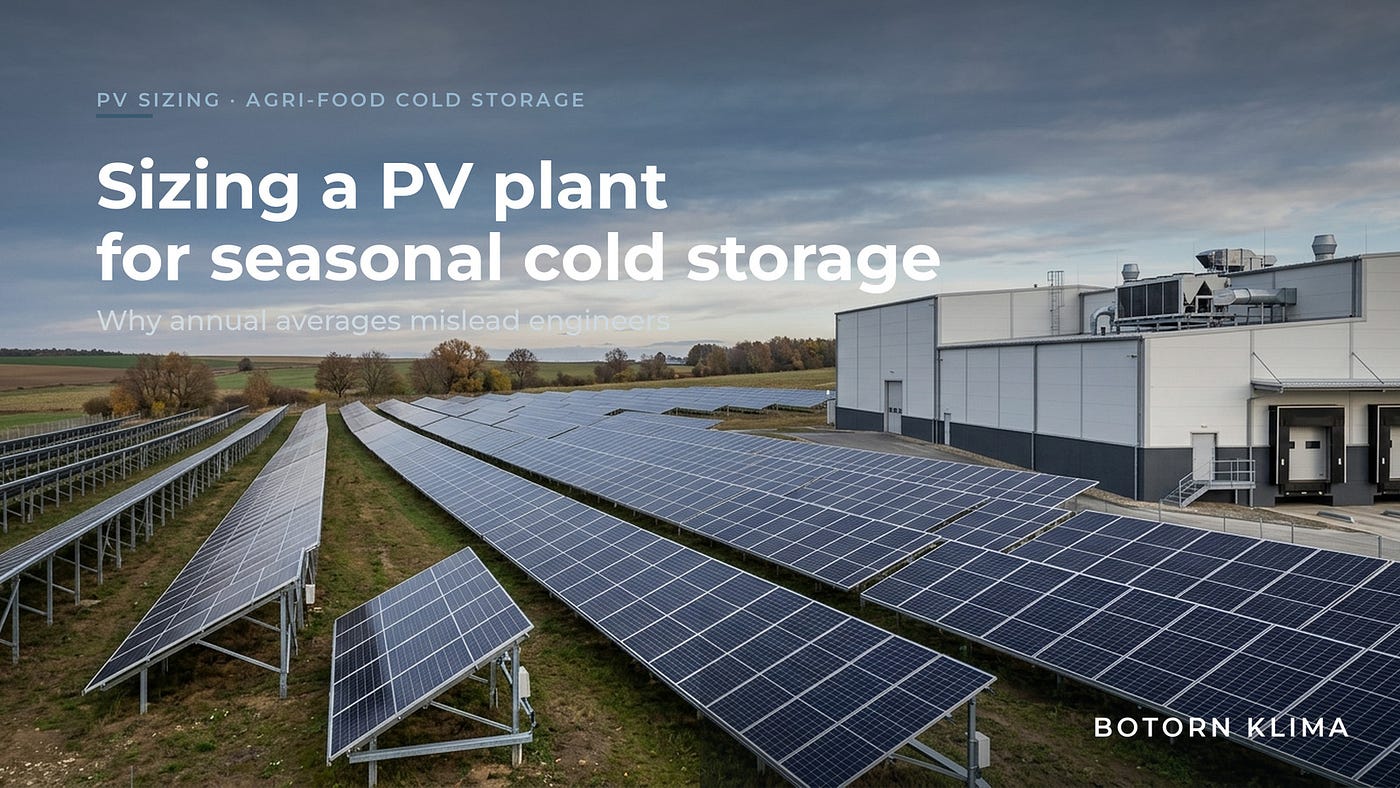
Sizing a PV Plant for Seasonal Cold Storage: Why Annual Averages Mislead Engineers
A five-step method for sizing a self-consumption solar plant against a cold store’s real monthly load — the worst month, not the annual…
Sizing a PV Plant for Seasonal Cold Storage: Why Annual Averages Mislead Engineers
A five-step method for sizing a self-consumption solar plant against a cold store’s real monthly load — the worst month, not the annual spreadsheet.
Picture a fruit cold store that sizes its PV system to match 100% of annual consumption. 500 MWh generated, 500 MWh consumed. The spreadsheet balances perfectly. Then October arrives.
Demand charges from a single 15-minute peak — every compressor firing simultaneously during harvest intake — exceed the entire summer energy cost. Where the tariff includes a ratchet clause, that peak can define the demand charge for the next 11 months.
On paper, the plant is correct. In practice, it misses the only months that matter.
This article walks through a five-step method for sizing a self-consumption PV plant against the real load profile of a seasonal cold storage facility, not the annual average that most sizing tools default to.
Step 1: Understand Why Annual Averages Mislead
A facility consuming 500 MWh per year averages 41.7 MWh per month. An array producing 500 MWh annually appears to be a perfect match. For a flat-profile consumer — a data centre, perhaps — it might be. For a fruit cold store, it fails.
Refrigeration dominates the load: peer-reviewed measurements of cold storage facilities put refrigeration at 60–70% of electrical energy use (Nunes et al., Applied Energy, 2014). That consumption is sharply uneven. During autumn harvest intake, compressors run simultaneously to pull product temperatures down, creating peak loads well above the monthly mean. PV generation moves in the opposite direction: in Central Europe, winter output falls to roughly 20–30% of summer values as days shorten and sun angles drop (PVGIS irradiance data).
The annual balance hides this mismatch entirely. Without storage or matching, a system producing 500 MWh across the year typically achieves a self-consumption ratio of only 20–40%. The rest is exported — often at unfavourable feed-in tariffs — while the facility buys grid power at peak rates during the exact months it needs energy most.
The annual average gives you a plant that works brilliantly in June and fails in October.
Step 2: Map Monthly Consumption and Generation Side by Side
Two columns: monthly facility consumption and expected monthly PV generation, using regional irradiance data (PVGIS for European sites). Add a third column for the difference.
For a fruit storage facility in Central Europe, a typical profile reveals the structural problem:
- June–August: generation 60–70 MWh, consumption 30–35 MWh — surplus of 25–35 MWh
- September–November: generation 25–30 MWh, consumption 55–65 MWh — deficit of 30–35 MWh
- December–February: generation 15–20 MWh, consumption 40–45 MWh — deficit of 20–25 MWh
A 400 kW array in July produces roughly 70 MWh. The facility consumes 32 MWh. 38 MWh flow to the grid at low export rates. In October, the same array produces 28 MWh. The facility consumes 62 MWh. 34 MWh must be purchased from the grid at peak tariff — plus demand charges.
To make the intake spike concrete: a case study of large-scale commercial fruit cold stores found that storing and handling one pallet consumes about 7.62 kWh of electricity per day (Goedhals-Gerber & Khumalo, Sustainability, 2022). Multiply that by several hundred pallets loaded simultaneously in September, and the daily consumption spike becomes tangible — though the exact figure varies with facility type, product and climate. Month-by-month modelling matters far more for seasonal-load facilities than annual totals, because systems designed on annual averages fail precisely at the peaks.
The monthly model reveals what the annual figure cannot: the plant covers consumption arithmetically but not physically. Energy is produced when you do not need it and absent when you do.
Step 3: Factor in Demand Charges and Ratchet Clauses
Most sizing calculations focus on energy (kWh). Demand charges are billed on power (kW) — typically the highest 15-minute average power draw recorded in a billing period.
The utility records the maximum 15-minute peak demand each month, and the facility pays a per-kW charge on that peak regardless of total energy consumed. Where the tariff carries a ratchet clause — common in some markets, absent in others, so check your contract — a peak set in September can carry forward for the following months even after actual demand drops.
Cold storage facilities have a high load factor: compressors run around the clock, so average demand stays close to peak demand. But the brief spikes when multiple compressors start simultaneously during autumn intake can set the demand charge for a long stretch. A single 15-minute interval in September or October may drive many months of billing.
Consider, illustratively, a mid-sized cold store with 800 kW peak demand at a demand-charge rate of €12/kW per month. Annual demand charges reach €115,200. Under a ratchet mechanism, a single autumn peak can add a further €20,000–50,000.
A PV plant sized on annual averages does not touch this number. At 17:00 in October, when compressors hit peak load, solar generation is already near zero. The demand charge stays exactly where it was before the PV plant existed.
Sizing must therefore address peak power reduction, not just annual energy balance. That requires either storage or an array large enough to power compressors during daylight hours in October, shifting the facility’s grid peak away from the evening.
Step 4: Calculate Required Capacity Based on the Worst-Case Month
The sizing target is the month with the worst ratio of generation to consumption — typically October or November for fruit storage facilities.
From your monthly table, identify the month with the largest deficit. Calculate the array capacity needed so that daytime generation covers 70–80% of daily consumption. Use peak sun hours for your specific region in that month — not the annual average.
Example calculation:
- October consumption: 62 MWh (approximately 2 MWh/day)
- October irradiance: ~2.5 peak sun hours/day (site-specific — verify against PVGIS)
- Target: 1.6 MWh/day (80% of daily consumption)
- Required capacity: 1,600 kWh ÷ 2.5 h = 640 kW
- That same 640 kW array in July produces a large surplus, exported to the grid
Compare with the annual-average approach:
- Annual consumption 500 MWh → array sized at roughly 400 kW
- October output of a 400 kW array: approximately 28 MWh → deficit of 34 MWh
The difference: 640 kW versus 400 kW. A 50–60% larger array.
Engineers typically add a 10–20% safety margin to calculated refrigeration loads for operational variation and calculation uncertainty. For seasonal facilities, this margin is not conservative — it is essential. Incorrect system sizing is a costly design error, leading either to insufficient savings or to wasted investment.
The worst-case-month approach produces an array roughly 50–60% larger than the annual-average method. That additional capacity is exactly what covers the load during the critical period and cuts into demand charges.
Step 5: Evaluate Battery Storage as an Alternative to Oversizing
If installing a 640 kW array is not feasible — roof space, grid connection limits, budget — battery storage offers an alternative path. But only under specific conditions.
Two approaches compared (illustrative costs):
- Oversized array: 640 kW instead of 400 kW (additional 240 kW at roughly €800/kW ≈ €192,000)
- Base array + battery: 400 kW array + 500 kWh battery (order of €200,000–250,000)
A battery makes sense when the primary problem is time-shifted consumption: the facility’s peak falls in the evening (17:00–21:00), but the array generates during the day. The battery charges during daylight and discharges into the evening peak, shaving demand charges.
A battery does not help when the problem is an absolute generation shortfall. In October, with ~2.5 peak sun hours, a 400 kW array generates roughly 1,000 kWh per day. If the facility needs 2,000 kWh, no amount of time-shifting closes the gap — there simply is not enough energy to store.
A common mistake: sizing the battery for average daily consumption instead of the peak load profile. A 200 kWh battery sufficient for summer evening peaks cannot sustain an 800 kW compressor load for 3–4 hours in October — that would require 2,400–3,200 kWh of storage.
One further lever exists on the demand side. In peer-reviewed trials, storing apples under ultra-low-oxygen conditions at about 4°C higher temperature (5°C instead of 1°C) combined with 1-MCP treatment cut storage energy use by around 70% versus standard 1°C storage, without loss of fruit quality (Kittemann, McCormick & Neuwald, European Journal of Horticultural Science, 2015). Reducing the load is sometimes more practical than increasing the supply — though the approach is crop- and cultivar-specific.
For fruit storage facilities with pronounced autumn loading, oversizing the array is generally the more reliable solution. The problem is not when energy is consumed but how much is needed during a period of low irradiance.
What You Now Know That Most Sizing Tools Miss
The method reduces to five decisions:
- Build a monthly generation-and-consumption model — never rely on annual averages
- Identify the month with the maximum deficit (typically October–November for storage facilities)
- Size the array to the irradiance of that specific month, not the annual figure
- Account for demand charges: the plant must reduce peak power, not just cover energy
- Consider battery storage only if the problem is time-shifting, not an absolute generation shortfall
A PV plant that exports much of its summer output to the grid may look oversized in July. The alternative — an undersized plant — means demand charges that can erase the entire annual saving. The correct plant is sized for the worst month, not the best spreadsheet.
If you are sizing a self-consumption PV plant for an agri-food facility with seasonal load, BOTORN KLIMA can run a month-by-month generation and consumption model for your specific site and show where a standard calculation would leave gaps. Get in touch to discuss your project.
메타데이터
- post_id
- 6b1b44347f2f
- slug
- sizing-a-pv-plant-for-seasonal-cold-storage-why-annual-averages-mislead-engineers-6b1b44347f2f
- url
- https://medium.com/@botorn_klima_ood/sizing-a-pv-plant-for-seasonal-cold-storage-why-annual-averages-mislead-engineers-6b1b44347f2f
- canonical_url
- https://medium.com/@botorn_klima_ood/sizing-a-pv-plant-for-seasonal-cold-storage-why-annual-averages-mislead-engineers-6b1b44347f2f
- author_url
- https://medium.com/@botorn_klima_ood
- status
- ok
- fetched_at
- 2026-08-24 03:28:40