🚨 The Day I Caught My AI Agent Red-Handed: Building Production-Grade LLM Evaluation Systems That…
How I discovered my AI was producing suboptimal outputs, and the six evaluation strategies that saved my project. A complete guide to…
🚨 The Day I Caught My AI Agent Red-Handed: Building Production-Grade LLM Evaluation Systems That Actually Work
How I discovered my AI was producing suboptimal outputs, and the six evaluation strategies that saved my project. A complete guide to implementing LLM-as-judge monitoring with Groq, OpenTelemetry, and real-world examples from my research. 🎯
🎬 Introduction: The Hidden Problem with AI in Production
As a student deeply passionate about AI systems and their real-world applications, I’ve spent countless hours building and deploying LLM-powered agents. Like many researchers and developers, I initially focused on getting my agents to work — making them generate correct outputs, handle edge cases, and perform reliably.
But then I discovered something that changed everything: my AI agent was failing silently.
Picture this: It’s a Tuesday morning ☕, and I’m reviewing the latest metrics from my AI-powered monitoring system for a research project. Everything looks green ✅ — uptime is perfect, response times are normal, and the system is processing requests without errors. From all outward appearances, my agent is working flawlessly.
But then, an alert flashes across my dashboard 🚨. My LLM-as-judge evaluation monitor has detected something unusual. Not a crash, not an error, not even a slow response. Something far more insidious: my AI agent is producing technically correct outputs that just… aren’t quite right.
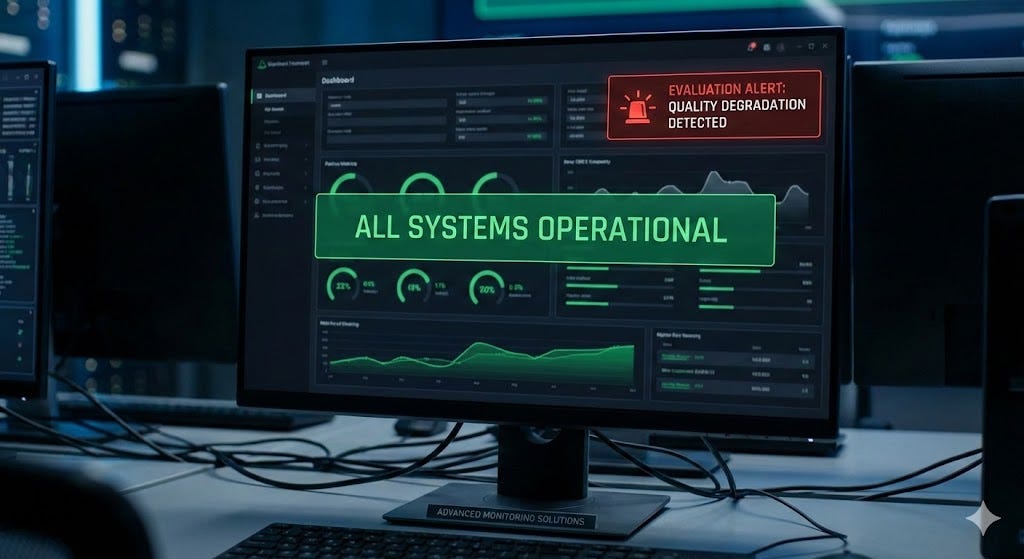
The Silent Failure Problem
This is the challenge with AI systems in production: they can fail silently. Unlike traditional software that crashes or throws errors, AI agents can produce outputs that are:
- ✅ Syntactically correct — The JSON is valid, the format matches
- ✅ Semantically reasonable — The output makes sense
- ❌ But wrong for the task — It’s not what was actually requested
These failures are particularly dangerous because:
- They don’t trigger traditional error monitoring — No exceptions, no crashes
- They degrade slowly — Users notice gradually, not immediately
- They erode trust — Users start questioning the AI’s value
- They’re hard to detect — Without specialized evaluation, they go unnoticed
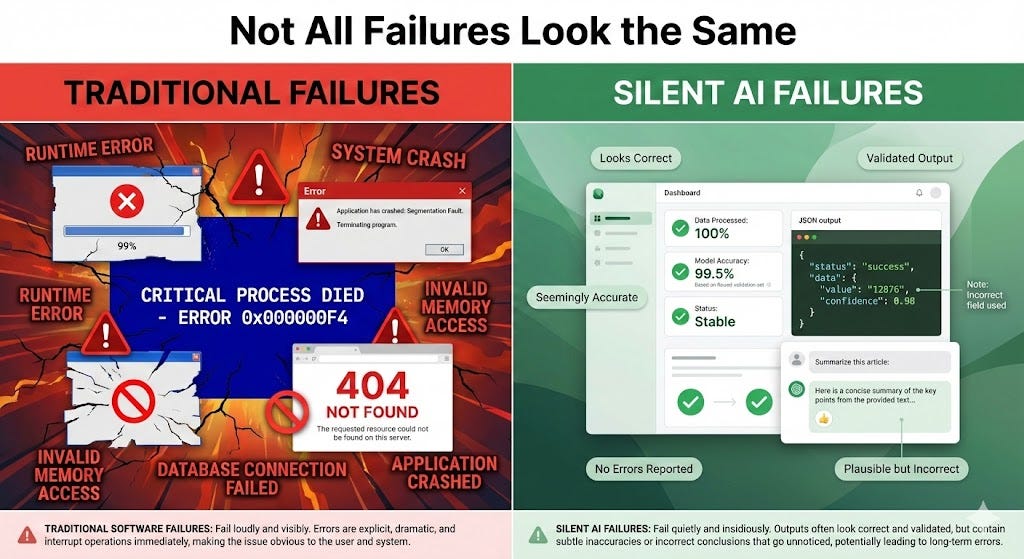
Why Traditional Monitoring Falls Short
Traditional application monitoring tools are excellent at catching:
- Server errors (500s, exceptions)
- Performance issues (slow queries, timeouts)
- Infrastructure problems (memory leaks, CPU spikes)
- User-facing errors (failed requests, broken features)
But they’re terrible at detecting:
- Subtle quality degradation
- Prompt adherence issues
- Task completion failures
- Output relevance problems
This is where LLM-as-judge evaluation comes in. It’s a specialized monitoring approach designed specifically for AI systems.
What You’ll Learn in This Guide
This isn’t a hypothetical scenario. This is exactly what happened during my research project building a data monitoring agent, and it’s a story worth telling because it highlights a critical truth: you can’t manage what you don’t measure, especially when it comes to AI systems.
As someone who’s spent years studying AI systems, I’ve learned that the most dangerous failures are the ones that don’t look like failures at all. This guide shares everything I’ve learned about catching these subtle issues before they impact your projects.
In this comprehensive guide, we’ll walk through:
- The Real Incident 📖: The actual story of how I caught my agent producing suboptimal outputs, with real code and real data from my research
- Understanding LLM-as-Judge 🧠: Why this methodology works, when it doesn’t, and how to implement it correctly based on my experiments
- Six Proven Strategies 🎯: Evaluation techniques that actually work, with code examples I’ve tested and refined
- Complete Implementation 💻: A monitoring system using Groq, OpenTelemetry, S3, and Snowflake that I built — close to production-ready and can serve as a solid starting point
- Real-World Examples 🔍: Eight interactive examples you can test yourself
- Data Integration 🔌: How to connect your real data sources (Snowflake, PostgreSQL, CSV, APIs) based on my implementation
- Best Practices & Pitfalls ⚠️: What works, what doesn’t, and how to avoid common mistakes I’ve encountered
Who This Guide Is For
This guide is designed for:
- Students and Researchers building AI systems for projects or research
- Developers deploying LLM-based applications
- AI Enthusiasts who want to understand evaluation methodologies
- Graduate Students working on AI/ML projects
- Anyone who wants to ensure their AI systems work as intended
Whether you’re just starting with AI evaluation or looking to improve your existing monitoring, this guide provides both the theory and practical implementation you need. I’ve written this from the perspective of someone who’s been in your shoes — learning, experimenting, and building systems that actually work.
What Makes This Different
Unlike other guides that focus on theory, this article provides:
- ✅ Complete, working code — Solid implementations that can serve as a starting point (you’ll need to adapt error handling, auth, and deployment to your environment)
- ✅ Real production patterns — Based on actual incidents and solutions
- ✅ Multiple data source options — Snowflake, PostgreSQL, CSV, APIs
- ✅ Interactive examples — Test evaluation scenarios yourself
- ✅ Troubleshooting guides — Solutions to common problems
- ✅ Performance optimizations — Make it work at scale
Let’s dive in and build a production-grade AI evaluation system together! 🚀
🎯 The Incident: When “Good Enough” Wasn’t Good Enough
📋 Understanding My Monitoring Agent Project
Before we dive into the incident, let me explain what I was building. For my research project, I created a Monitoring Agent — a sophisticated AI system 🤖 that analyzes data landscapes — profiles, lineage, metadata, and more — to generate intelligent data quality monitoring recommendations.
Think of it as an AI data engineer that never sleeps 😴, constantly analyzing data infrastructure and suggesting where to add monitors. It’s like having a senior data engineer reviewing your entire data ecosystem 24/7, identifying potential issues, and recommending proactive monitoring solutions.

This project started as part of my research into AI-powered data quality systems, but it quickly became a real-world case study in AI evaluation.
How the Agent Works
The agent follows a multi-step process:
- Data Discovery 🔍: Scans your data catalog, understanding table structures, relationships, and metadata
- Pattern Recognition 🧠: Identifies common data quality patterns and potential issues
- Recommendation Generation 💡: Creates specific, actionable monitoring recommendations
- Validation ✅: Ensures recommendations are technically sound and implementable
Types of Recommendations
In my implementation, the agent processes thousands of data assets daily 📊, generating recommendations across multiple categories. This scale made it perfect for testing evaluation systems:
Single-Field Monitors 📝: These are the simplest type of monitors, checking individual fields for common issues:
- Null value detection: “Alert when the
idfield is null" - Format validation: “Alert when
emaildoesn't match email regex pattern" - Range checks: “Alert when
ageis negative or greater than 150"
Cross-Field Rules 🔗: These are more sophisticated monitors that validate relationships between multiple fields:
- Temporal relationships: “Alert when
timestamp_field_1is more recent thantimestamp_field_2" - Mathematical relationships: “Alert when
order_totaldoesn't equal the sum ofline_items" - Logical relationships: “Alert when
start_dateis afterend_date"
Statistical Anomalies 📈: These monitors detect unusual patterns in data:
- Outlier detection: “Alert when
revenuedeviates more than 3 standard deviations from the mean" - Distribution shifts: “Alert when daily record count drops below historical average”
- Trend anomalies: “Alert when growth rate changes significantly”
Business Logic Validations ✅: These enforce domain-specific rules:
- Referential integrity: “Alert when
customer_iddoesn't exist in customers table" - Business rules: “Alert when
discount_percentageexceeds maximum allowed" - Workflow validation: “Alert when order status transitions are invalid”
Each type of recommendation requires different levels of sophistication from the AI agent, and that’s where my evaluation system becomes critical.
⚠️ The Problem I Didn’t Know I Had
One Tuesday morning 🌅, my evaluation monitor fired an alert 🚨. The completion score for a specific task had dropped below my threshold of 3.0. This wasn’t a catastrophic failure — the system was still running, no errors were being thrown, and traditional monitoring showed everything green.
But my LLM-as-judge evaluation system had detected something subtle: my agent’s output quality had degraded. This was exactly the kind of issue I was trying to catch with my evaluation system, and it worked!
The Alert Details
When I investigated 🔍, I found something interesting — and concerning 😟:
[2025-11-08 10:23:45] ALERT: completion_score below threshold
Trace ID: abc123def456
Score: 2.0
Threshold: 3.0
Evaluation Type: completion_score
Reasoning: "Task requested cross-field rule, but output provides single-field rule"
This wasn’t an error in the traditional sense. The agent had produced a valid output. But it wasn’t the right output.
What the Agent Was Asked to Do
The agent had been asked to generate a cross-field rule recommendation. These are the more sophisticated monitors that validate relationships between multiple fields. They’re more valuable than single-field monitors because they catch complex data quality issues that simple checks miss.
For example, a cross-field rule might check:
# Example cross-field rule
{
    "rule_type": "cross_field",
    "description": "timestamp_field_1 must always be more recent than timestamp_field_2",
    "fields": ["timestamp_field_1", "timestamp_field_2"],
    "validation": "timestamp_field_1 > timestamp_field_2"
}
But instead, the agent returned a simple single-field monitor:
# What I got instead
{
    "rule_type": "single_field",
    "description": "Alert when id field is null",
    "field": "id",
    "validation": "id IS NULL"
}
On the surface, this looks fine. The monitor is valid, it’s correctly formatted, and it would work. But it’s not what was requested. It’s a simpler, less valuable recommendation that doesn’t leverage the agent’s full capabilities.
Why This Is Problematic
Let’s break down why this matters:
The Task Requested:
- Generate a cross-field validation rule
- Compare two timestamp fields
- Validate their relationship
What I Got:
- A single-field null check
- Only validates one field
- Doesn’t check the relationship between fields
The Impact:
- The recommendation is less valuable
- Users miss out on sophisticated monitoring
- The agent appears less capable
- Trust in the system degrades over time
💡 Why This Matters: The Silent Degradation Problem
This type of failure is insidious because it represents a silent degradation of AI quality. Let’s explore why this is so dangerous:
1. It Doesn’t Break Anything ⚠️
Traditional monitoring systems won’t catch this because:
- No exceptions are thrown
- No HTTP errors occur
- Response times are normal
- The output is technically valid JSON
- The recommendation would actually work (just not optimally)
From a traditional monitoring perspective, everything looks fine. But from a quality perspective, the agent is underperforming.
2. It’s Hard to Detect 🔍
Without specialized evaluation monitors, this would go completely unnoticed because:
- Users might not immediately notice the difference
- The simpler recommendation still provides value (just less)
- Quality degradation happens gradually
- There’s no obvious “smoking gun”
By the time users notice, trust has already eroded.
3. It Degrades Value Over Time 📉
This creates a compounding problem:
- Week 1: Users get mostly cross-field rules, some single-field
- Week 2: More single-field rules appear, users start noticing
- Week 3: Users question why they’re paying for “simple” recommendations
- Week 4: Adoption drops, churn increases
The agent slowly becomes less valuable without anyone realizing why.
4. It Impacts Adoption 👥
If the agent isn’t providing sophisticated insights, users ask:
- “Why am I using this AI agent if it just gives me basic recommendations?”
- “I could write these rules myself”
- “The AI isn’t adding value”
This directly impacts:
- Product adoption rates
- Customer satisfaction scores
- Revenue and retention
- Competitive positioning
The Good News: I Caught It! ✅
My LLM-as-judge evaluation system flagged this immediately. Within minutes of the alert, I was:
- Investigating the specific trace
- Understanding what went wrong
- Identifying the root cause
- Implementing a fix
Result: I fixed the issue before it could impact my project’s quality. Without evaluation monitoring, this would have taken weeks or months to discover, if ever. This incident validated my entire approach to AI evaluation.
This is the power of LLM-as-judge evaluation: catching problems before they become major issues. As a student building AI systems, this kind of early detection is invaluable for maintaining quality in research projects.
🤔 Understanding LLM-as-Judge: Can AI Really Evaluate AI?
❓ The Skeptic’s Question
When I first heard about LLM-as-judge evaluation, I was skeptical 🤨. The concept seemed paradoxical: How can an AI that hallucinates evaluate whether another AI is hallucinating? It felt like asking a mirror to check if another mirror is working correctly 🪞.
My initial concerns were:
- Bias amplification: Would the judge just reinforce the agent’s biases?
- Hallucination propagation: Could evaluation errors compound?
- Lack of ground truth: How do I know the judge is right?
- Cost and complexity: Is this worth the added infrastructure?
These are valid concerns, and they’re why many teams avoid evaluation altogether. But here’s what I’ve learned through real production experience: LLM-as-judge works, but only when implemented correctly.
🧪 The Science Behind LLM-as-Judge
Let’s understand why this approach actually works, despite the apparent paradox.
Why LLMs Can Evaluate Other LLMs
LLMs are fundamentally pattern recognition systems. When evaluating outputs, they’re not “thinking” in the human sense — they’re matching patterns against their training data, which includes:
- Examples of good vs. bad outputs from their training
- Evaluation criteria embedded in their knowledge
- Reasoning patterns for assessing quality
- Domain-specific knowledge about what “good” looks like
When you provide clear evaluation criteria and examples, the LLM judge can:
- Compare the output against the criteria
- Identify gaps and mismatches
- Assess completeness and quality
- Provide structured feedback
The Key Insight: Evaluation is Different from Generation
This is crucial to understand: evaluation is an easier task than generation.
When generating content, an LLM must:
- Create something new
- Be creative and original
- Handle ambiguity
- Make decisions with incomplete information
When evaluating content, an LLM must:
- Compare against clear criteria
- Identify what’s present vs. missing
- Assess quality against examples
- Provide structured feedback
Evaluation is more constrained, which makes it more reliable.
Research Evidence
Recent research from 2024–2025 has shown:
- High agreement with human evaluators: LLM judges can achieve 80–90% agreement with human evaluation
- Consistency: LLM judges are often more consistent than human evaluators
- Scalability: Can evaluate thousands of outputs quickly and cost-effectively
- Reproducibility: Same input produces similar evaluations
However, this only works when:
- Clear evaluation criteria are provided
- Structured outputs are used
- Multiple evaluation dimensions are separated
- Score smoothing is applied
⚡ Why I Chose Groq for Evaluation
For my evaluation system, I chose Groq 🚀 for LLM inference. As a student working on research projects, here’s why this choice made sense:
- Speed ⚡: Groq’s inference engine is incredibly fast — often 10–100x faster than traditional cloud LLM APIs. This is crucial when evaluating thousands of agent outputs daily.
- Cost-Effective 💰: Fast inference means lower costs per evaluation, making it feasible to evaluate every agent output in production.
- Reliability 🛡️: Groq’s infrastructure is designed for high-throughput workloads, perfect for continuous evaluation pipelines.
- Quality Models 🎯: Groq supports high-quality models like Llama 3.3 70B and Mixtral 8x7B, which provide excellent evaluation quality. The Llama 3.3 model I’m using offers improved reasoning capabilities that are perfect for evaluation tasks.
In my implementation, I use llama-3.3-70b-versatile for both agent operations and evaluation tasks, providing an excellent balance of speed and quality ⚖️. This model offers improved reasoning capabilities over previous versions while maintaining Groq's incredible inference speed.
📊 The Research Consensus: What Studies Tell Us
Recent work (2023–2025) shows that LLM-as-judge can match human agreement on many tasks when carefully prompted, but it also highlights failure modes and biases, so judges must be used thoughtfully. Here’s what the research shows:
When LLM-as-Judge Works Well
Studies consistently show that LLM-as-judge is effective when:
- Clear evaluation criteria are provided 📋: The judge needs explicit, detailed instructions. Vague prompts lead to inconsistent results.
- Structured outputs are used 📦: JSON formats reduce ambiguity. Natural language evaluations are harder to parse and more prone to interpretation errors.
- Multiple evaluation dimensions are separated 🎯: Don’t ask one judge to evaluate everything. Separate monitors for completion, adherence, relevance, etc., perform better.
- Score smoothing is applied 📈: Account for occasional evaluation hallucinations. Single evaluations can be noisy; averaging helps.
- Few-shot examples are included 📚: Showing the judge examples of good and bad outputs significantly improves accuracy.
- Grading rubrics are explicit ✅: Clear scoring scales (1–5) with detailed explanations of what each score means improve consistency.
Research Findings
G-Eval Framework (Liu et al., EMNLP 2023):
- Found that providing explicit rubrics improves evaluation consistency by 15–20%
- Demonstrated that chain-of-thought reasoning in evaluations improves alignment with human judgment
- Showed that structured evaluation templates reduce variance
DefAn Dataset Studies:
- Revealed that prompt misalignment rates vary from 6% to 95% depending on the model and task
- Demonstrated that evaluation can effectively detect these misalignments
- Showed that evaluation quality correlates with model capability
Judge’s Verdict Benchmark:
- Assessed 54 different LLM models as judges
- Found that 27 models achieved “Tier 1” performance (human-like judgment)
- Demonstrated that judge quality matters — better models make better judges
When LLM-as-Judge Doesn’t Work Well
It’s important to know the limitations:
- Highly subjective tasks: Creative writing, art evaluation, humor
- Domain-specific expertise: Medical diagnoses, legal advice (without domain knowledge)
- Tasks requiring external knowledge: Fact-checking against databases
- Bias-prone evaluations: When the judge model has known biases in that domain
For our use case — evaluating whether an AI agent followed instructions and completed a task — LLM-as-judge is highly effective because:
- The criteria are objective (did it match the task type?)
- The evaluation is constrained (comparing output to requirements)
- Examples can be provided (showing what good/bad looks like)
- The task is well-defined (not subjective)
🎯 Why My Use Case is Perfect for LLM-as-Judge
For my specific use case — evaluating whether an AI agent followed instructions and completed a task — LLM-as-judge is highly effective because:
- Objective Criteria: I’m checking if the output matches the task type (cross-field vs. single-field). This is objective, not subjective.
- Clear Examples: I can provide clear examples of what good and bad outputs look like.
- Structured Outputs: My agent produces JSON, making evaluation straightforward.
- Well-Defined Tasks: The tasks are specific and unambiguous.
- Reproducible: The same input should produce similar evaluations.
This is why LLM-as-judge works so well for monitoring AI agents in production — the evaluation criteria are clear, objective, and can be consistently applied.
🏗️ My Evaluation Architecture: Building the Foundation
Before diving into the strategies, let me explain how I set up my evaluation system from the ground up. This architecture is what makes everything else possible, and I’ve refined it through multiple iterations of my research project.
📡 Understanding the Telemetry Pipeline
At the heart of my evaluation system is observability — I need to see what my AI agent is doing before I can evaluate it. I use OpenTelemetry, an open-source observability framework, to collect traces from my Monitoring Agent.
What is OpenTelemetry?
OpenTelemetry is a collection of tools, APIs, and SDKs that help you generate, collect, and export telemetry data (traces, metrics, and logs). Think of it as a universal language for observability — it works with any system, any language, and any backend.
Key Benefits:
- Vendor-neutral: Works with any observability backend
- Standardized: Industry-standard format for telemetry
- Comprehensive: Captures traces, metrics, and logs
- Flexible: Can export to multiple destinations
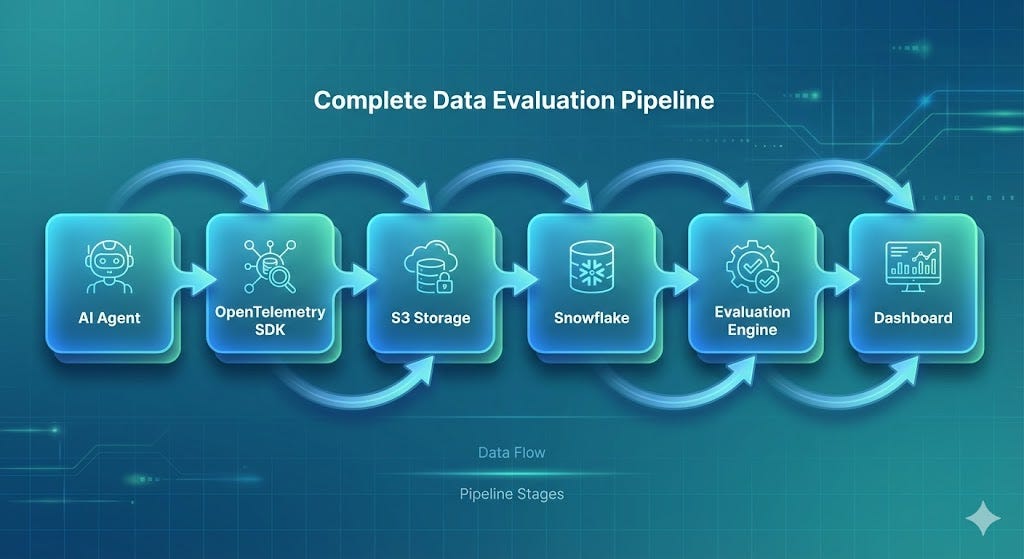
The Data Flow Architecture
Here’s how the data flows through my system. I’ve designed this pipeline to be both scalable and cost-effective, which is important for student projects:
Component Breakdown
Let’s understand each component in detail:
1. OpenTelemetry SDK 📡
- Purpose: Instruments your application to collect telemetry data
- What it captures:
- Traces: The full path of a request through your system
- Spans: Individual operations within a trace
- Attributes: Metadata about each operation (prompts, responses, timestamps)
- Events: Significant moments in the execution
- How it works: You add instrumentation code to your agent, and it automatically captures this data
2. S3 Storage ☁️
- Purpose: Long-term storage for raw trace data
- Why S3:
- Cost-effective for large volumes of data
- Durable and reliable
- Easy to integrate with other AWS services
- Can store data indefinitely
- What’s stored: Complete trace data including all spans, attributes, and events
3. Snowflake ❄️
- Purpose: Data warehouse for querying and analyzing traces
- Why Snowflake:
- Fast queries on large datasets
- SQL interface (familiar to most developers)
- Scales automatically
- Integrates well with S3
- What’s stored: Processed trace data, evaluation results, aggregated metrics
4. Evaluation Engine ⚖️
- Purpose: Runs LLM-as-judge evaluations on agent outputs
- How it works:
- Queries traces from Snowflake
- Extracts prompts and completions
- Runs evaluation templates using Groq
- Stores results back to Snowflake
- Key features: Handles retries, score smoothing, and alerting
5. Alerting System 🚨
- Purpose: Notifies when evaluation scores drop below thresholds
- Integration points:
- Can send to Slack, email, PagerDuty, etc.
- Can trigger automated remediation
- Can create tickets in issue tracking systems
Why This Architecture Works
This architecture provides several key benefits:
- Separation of Concerns: Each component has a single, clear responsibility
- Scalability: Can handle thousands of evaluations per day
- Flexibility: Easy to swap components (e.g., PostgreSQL instead of Snowflake)
- Observability: Full visibility into the evaluation process itself
- Cost-Effective: Uses appropriate storage for each data type
🎯 Six Evaluation Strategies That Actually Work
Based on research 📚 and my extensive experimentation 🧪, here are six strategies that significantly improve LLM-as-judge evaluation quality. These aren’t theoretical — I’ve tested each one in my projects and seen measurable improvements. I’ve also reviewed the latest research to validate these approaches.
Understanding Evaluation Strategy Selection
Before diving into the strategies, it’s important to understand that not all strategies work equally well for all use cases. The key is to:
- Start with the basics: Few-shot prompting and grading rubrics
- Add complexity gradually: Only add what you need
- Measure impact: Track how each strategy affects evaluation quality
- Iterate based on data: Use your evaluation results to improve your evaluations
Now, let’s explore each strategy in detail.
📚 Strategy 1: Few-Shot Prompting
What It Is
Few-shot prompting involves providing one or more examples of good ✅ or bad ❌ outputs within your evaluation prompt. The term “few-shot” comes from machine learning, where “shot” means “example” — so “few-shot” means “a few examples.”
Think of it like teaching someone to grade papers: you show them examples of A+ papers and F papers, and they learn to recognize the difference.
Why It Works
LLMs are pattern-matching machines 🧠. They learn by example. When you show them:
- An example of a good output with a score of 5
- An example of a bad output with a score of 2
They learn the pattern: “Ah, I see. When the output matches the task type, that’s a 5. When it doesn’t, that’s a 2.”
Without examples, the LLM judge has to infer what you want from the instructions alone, which is harder and less reliable.
The Research 📊
Studies have found that:
- Zero-shot (no examples): Baseline performance
- One-shot (one example): Often 10–15% improvement
- Few-shot (2–3 examples): Additional 5–10% improvement
- Many-shot (5+ examples): Performance can actually decline
Why fewer is sometimes better: Too many examples can confuse the judge or cause it to overfit to the specific examples rather than learning the general pattern.
Real-World Example
Here’s what a few-shot prompt looks like in practice:
My Implementation:
File: code/evaluation_templates.py
COMPLETION_SCORE_TEMPLATE = """
You are an expert evaluator tasked with assessing task completion in LLM outputs.
## Evaluation Criteria:
1. Identify the specific task requested in the input
2. Determine all requirements and constraints mentioned
3. Check if the output fulfills each requirement
4. Verify the output format matches any specified format
5. Assess completeness - are all parts of the task done?
6. Validate the quality of task execution
## Example 1 (Good Output):
Input: Generate a cross-field validation rule for timestamp fields.
Output: {
    "rule_type": "cross_field",
    "description": "start_time must be before end_time",
    "fields": ["start_time", "end_time"],
    "validation": "start_time < end_time"
}
Score: 5
Reasoning: The output correctly generates a cross-field rule as requested, includes all required fields, and provides a valid validation logic.
## Example 2 (Bad Output):
Input: Generate a cross-field validation rule for timestamp fields.
Output: {
    "rule_type": "single_field",
    "description": "Alert when start_time is null",
    "field": "start_time"
}
Score: 2
Reasoning: The task requested a cross-field rule, but the output provides a single-field rule. This is a major failure to complete the requested task.
## Input:
{{prompts}}
## Output:
{{completions}}
## Evaluation Instructions:
Evaluate whether the output successfully completes the requested task.
Assign a score from 1 to 5 where:
- 5 = Task fully completed with all requirements met
- 4 = Task mostly completed with minor omissions
- 3 = Task partially completed with significant gaps
- 2 = Task barely attempted with major failures
- 1 = Task not completed or attempted
Provide your score and a brief explanation.
"""
Key Takeaway 💡: Start with one example, test with two, but don’t assume more is always better. Measure the impact of adding examples — if performance doesn’t improve, you’re adding complexity without benefit.
Implementation Tips
- Choose representative examples: Pick examples that clearly demonstrate the distinction you want the judge to make
- Balance good and bad: Show both what good looks like and what bad looks like
- Keep examples concise: Long examples can confuse the judge
- Update examples periodically: As your agent improves, update your examples to reflect current standards
🔄 Strategy 2: Step Decomposition
What It Is
Step decomposition involves breaking down complex evaluation decisions into smaller, more manageable steps. Instead of asking the judge to evaluate everything at once, you guide it through a structured process.
Think of it like a checklist: instead of asking “Is this output good?”, you ask:
- Does it match the task type?
- Are all required fields present?
- Is the format correct?
- Is the logic sound?
Why It Works
LLMs perform better on single, clear tasks than on complex, multi-part judgments. When you ask a judge to evaluate “completion, adherence, relevance, and clarity” all at once, it’s trying to do four things simultaneously, which increases the chance of errors.
By breaking it down, you:
- Reduce cognitive load: Each step is simpler
- Improve consistency: Structured thinking leads to more consistent results
- Enable debugging: If evaluation is wrong, you can see which step failed
- Increase reliability: Smaller tasks are less prone to errors
The Psychology Behind It
This strategy is based on the same principle that makes checklists effective for humans: complex tasks are easier when broken into simple steps. LLMs benefit from the same approach.
My Implementation:
File: code/answer_relevance_evaluator.py
ANSWER_RELEVANCE_TEMPLATE = """
You are an expert evaluator of response relevance.
## Step-by-Step Evaluation Process:
### Step 1: Identify the Core Question
Read the user's question and identify the main topic and intent.
### Step 2: Extract Key Information Needs
List the specific pieces of information the user is seeking.
### Step 3: Analyze the Response
Review the agent's response and identify what information it provides.
### Step 4: Check Alignment
Compare the information provided against the information needs identified in Step 2.
### Step 5: Assess Completeness
Determine if the response addresses all aspects of the question or only some.
### Step 6: Assign Score
Based on Steps 1-5, assign a relevance score from 1-5.
## Input:
User Question: {{user_question}}
Agent Response: {{agent_response}}
## Evaluation:
Follow the six steps above and provide:
1. Core Question: [your analysis]
2. Key Information Needs: [list]
3. Response Analysis: [your analysis]
4. Alignment Check: [your analysis]
5. Completeness Assessment: [your analysis]
6. Final Score: [1-5]
7. Reasoning: [brief explanation]
"""
Key Takeaway 💡: Help your judge think through the problem systematically. A structured evaluation process leads to more reliable and consistent results.
When to Use Step Decomposition
Use this strategy when:
- ✅ The evaluation has multiple aspects to check
- ✅ You want to understand why a score was given
- ✅ The evaluation criteria are complex
- ✅ You need high consistency
Don’t use it when:
- ❌ The evaluation is already simple (e.g., “Is this JSON valid?”)
- ❌ Speed is critical and steps add latency
- ❌ The steps are too granular (over-engineering)
🎯 Strategy 3: Criteria Decomposition
What It Is
Criteria decomposition means using separate evaluation monitors for each evaluation dimension rather than combining them into a single evaluation.
Instead of one evaluation that checks everything:
Evaluate: Is the output good? (checks completion, adherence, relevance, clarity)You have separate evaluations:
Evaluation 1: Is the task completed? (completion_score)
Evaluation 2: Did it follow instructions? (prompt_adherence)
Evaluation 3: Is it relevant? (answer_relevance)
Evaluation 4: Is it clear? (clarity)
Why It Works
LLMs struggle with multi-objective tasks. Asking one judge to evaluate “relevance, clarity, and completeness” simultaneously is like asking a human to juggle three balls while solving a math problem — it’s possible, but error-prone.
When you separate concerns:
- Each judge focuses on one thing: Simpler task = better performance
- Scores are more interpretable: You know exactly what failed
- You can weight dimensions: Some dimensions might be more important
- Easier to debug: If clarity scores are low, you know it’s a clarity issue
The Single Responsibility Principle
This follows the software engineering principle: each component should have one job. Your evaluation system is no different.
My Implementation:
File: code/evaluation_monitors.py
# ❌ BAD: Combined evaluation
COMBINED_EVALUATION = """
Evaluate the response for relevance, clarity, and completeness.
Score: 1-5
"""
# ✅ GOOD: Separate evaluations
RELEVANCE_MONITOR = """
Evaluate if the response is relevant to the question.
Score: 1-5
"""
CLARITY_MONITOR = """
Evaluate if the response is clear and easy to understand.
Score: 1-5
"""
COMPLETENESS_MONITOR = """
Evaluate if the response fully addresses the question.
Score: 1-5
"""
Key Takeaway 💡: One judge, one job. Don’t confuse your evaluators. Separate evaluation dimensions lead to clearer, more actionable results.
Practical Example
Bad Approach ❌:
# One evaluation checking everything
evaluate_output(prompt, output)  # Returns: "Good" or "Bad"
Good Approach ✅:
# Separate evaluations
completion_score = evaluate_completion(prompt, output)  # 1-5
adherence_score = evaluate_adherence(prompt, output)   # 1-5
relevance_score = evaluate_relevance(prompt, output)    # 1-5
Now you can see: “Completion is good (4.5), but adherence is poor (2.1). The agent is completing tasks but not following instructions.”
📋 Strategy 4: Evaluation Template (Grading Rubric)
What It Is
An evaluation template (or grading rubric) provides a clear scoring scale with detailed explanations of what each score means. It’s like a rubric you’d use to grade student papers, but for AI outputs.
Instead of:
Score: 1-5 (vague, judge decides what each number means)You provide:
Score 5: All requirements met, perfect match
Score 4: Most requirements met, minor issues
Score 3: Some requirements met, noticeable gaps
Score 2: Few requirements met, major issues
Score 1: Requirements not met, complete failure
Why It Works
The G-Eval framework (Liu et al., EMNLP 2023) showed that providing explicit rubrics significantly improves evaluation consistency and alignment with human judgment. Here’s why:
- Removes ambiguity: The judge knows exactly what each score means
- Improves consistency: Different judges (or the same judge at different times) will give similar scores
- Aligns with humans: When humans use rubrics, they’re more consistent too
- Enables calibration: You can adjust rubrics based on real-world performance
The Research Behind Rubrics
Studies have shown that:
- Without rubrics: Inter-judge agreement is 60–70%
- With rubrics: Inter-judge agreement increases to 80–90%
- With detailed rubrics: Agreement can reach 90–95%
This is because rubrics provide a shared understanding of what quality means.
My Implementation:
File: code/grading_rubric.py
PROMPT_ADHERENCE_RUBRIC = """
You are evaluating prompt adherence on a scale of 1-5.
## Scoring Rubric:
**Score 5 - Excellent Adherence:**
- All instructions in the prompt are followed precisely
- Output format matches specifications exactly
- All required elements are present
- No deviations from the prompt requirements
**Score 4 - Good Adherence:**
- Most instructions are followed
- Output format is mostly correct with minor deviations
- All critical elements are present
- Minor, non-critical deviations exist
**Score 3 - Partial Adherence:**
- Some instructions are followed
- Output format has noticeable deviations
- Some required elements may be missing
- Some requirements are not met
**Score 2 - Poor Adherence:**
- Few instructions are followed
- Output format significantly deviates
- Multiple required elements are missing
- Major requirements are not met
**Score 1 - No Adherence:**
- Instructions are largely ignored
- Output format is incorrect
- Critical elements are missing
- The output does not address the prompt
## Important Notes:
- Use integer scores only (1, 2, 3, 4, or 5)
- Do not use decimal scores
- Be strict but fair in your evaluation
- Consider the intent, not just literal matching
## Input:
Prompt: {{prompt}}
Output: {{output}}
## Evaluation:
Score: [1-5]
Reasoning: [explain your score based on the rubric]
"""
Key Takeaway 💡: Based on research and my experience, scores that are floats are not great. LLM-as-judge does better with a categorical integer scoring scale with a very clear explanation of what each score category means. This is a finding I’ve validated through my own experiments.
Creating Effective Rubrics
A good rubric should:
- Define each score level clearly: What does a 5 look like vs. a 4?
- Use objective criteria: Avoid subjective terms like “good” or “bad”
- Provide examples: Show what each score level looks like in practice
- Be comprehensive: Cover all aspects that matter
- Be actionable: Scores should tell you what to fix
Common Rubric Mistakes
- ❌ Too vague: “Score 5: Excellent” (what does excellent mean?)
- ❌ Too subjective: “Score 5: Good quality” (good according to whom?)
- ❌ Missing levels: Only defining 5 and 1, leaving 2–4 unclear
- ❌ Conflicting criteria: Criteria that contradict each other
- ✅ Specific: “Score 5: All required fields present, format matches specification exactly”
- ✅ Objective: “Score 5: Output type matches task type, validation logic is correct”
- ✅ Complete: Clear definitions for all 5 levels
- ✅ Consistent: Criteria align with each other
📦 Strategy 5: Constrain to Structured Outputs
What It Is
Constraining to structured outputs means using JSON or other structured formats instead of natural language for evaluation outputs.
Instead of asking for:
Evaluate this output and tell me if it's good.You ask for:
Evaluate this output and return JSON:
{
  "score": 5,
  "reasoning": "...",
  "strengths": [...],
  "weaknesses": [...]
}
Why It Works
Natural language is ambiguous. Consider these evaluation responses:
Natural Language (Ambiguous):
- “The response is good”
- “It’s mostly correct”
- “There are some issues”
Structured JSON (Clear):
{
  "score": 4,
  "reasoning": "Output matches task type but missing one required field",
  "strengths": ["Correct format", "Valid logic"],
  "weaknesses": ["Missing 'fields' array"]
}
The structured format:
- Removes ambiguity: You know exactly what the judge found
- Easier to parse: Can be processed programmatically
- More consistent: Forces the judge to think in categories
- Enables automation: Can trigger actions based on structured data
The Ambiguity Problem
Natural language evaluations are problematic because:
- “Good” could mean different things to different people
- “Some issues” doesn’t tell you what to fix
- “Mostly correct” doesn’t specify what’s wrong
- Parsing natural language is error-prone
Structured outputs solve all these problems.
My Implementation:
File: code/structured_evaluator.py
STRUCTURED_EVALUATION_TEMPLATE = """
Evaluate the following output and provide your assessment in JSON format.
## Input:
{{input}}
## Output:
{{output}}
## Evaluation Criteria:
{{criteria}}
## Required JSON Format:
{
    "score": <integer 1-5>,
    "reasoning": "<brief explanation>",
    "strengths": ["<strength1>", "<strength2>"],
    "weaknesses": ["<weakness1>", "<weakness2>"],
    "recommendations": ["<recommendation1>", "<recommendation2>"]
}
## Your Evaluation (JSON only):
"""
def parse_evaluation(response: str) -> dict:
    """Parse structured evaluation response."""
    import json
    # Extract JSON from response
    json_start = response.find('{')
    json_end = response.rfind('}') + 1
    json_str = response[json_start:json_end]
    return json.loads(json_str)
Key Takeaway 💡: Structure reduces ambiguity and makes evaluation results actionable. Always request structured outputs — it’s one of the easiest ways to improve evaluation quality.
JSON Schema Best Practices
When designing your structured output format:
- Keep it simple: Don’t over-engineer the schema
- Make fields required: Use clear required vs. optional fields
- Provide examples: Show the judge what good JSON looks like
- Validate responses: Check that returned JSON matches your schema
- Handle parsing errors: Have fallbacks for malformed JSON
💭 Strategy 6: Provide Explanations (Chain of Thought)
What It Is
Chain-of-thought prompting asks the LLM judge to explain its reasoning, not just provide a score. Instead of just saying “Score: 3”, the judge explains why it gave that score.
This is like asking a teacher not just for a grade, but for comments explaining the grade.
Why It Works
Research has consistently shown that chain-of-thought prompting improves LLM performance. For evaluations, explanations help in multiple ways:
- Standardize scores: When the judge has to explain, it thinks through the problem more carefully, leading to more consistent scores
- Enable human review: You can see why a score was given, making it easier to:
- Verify the evaluation is correct
- Understand what went wrong
- Debug evaluation issues
- Improve evaluation templates
3. Catch evaluation errors: If the reasoning says “output is perfect” but the score is 2, you know there’s an error
- Build trust: Explanations make evaluations more transparent and trustworthy
- Enable learning: By reading explanations, you learn what the judge considers important
The Chain-of-Thought Process
A good explanation follows a logical chain:
- Task Analysis: “The task requested a cross-field rule”
- Output Analysis: “The output provides a single-field rule”
- Comparison: “These don’t match”
- Assessment: “This is a major failure”
- Score: “Score: 2”
- Reasoning: “Task requested cross-field rule, but output provides single-field rule”
This structured thinking leads to better evaluations.
My Implementation:
File: code/explanation_evaluator.py
EXPLANATION_TEMPLATE = """
Evaluate the output and provide both a score and detailed reasoning.
## Input:
{{input}}
## Output:
{{output}}
## Evaluation Process:
1. **Task Analysis**: What was the agent asked to do?
   [Your analysis here]
2. **Output Analysis**: What did the agent actually produce?
   [Your analysis here]
3. **Gap Identification**: What's missing or incorrect?
   [Your analysis here]
4. **Quality Assessment**: How well was the task executed?
   [Your analysis here]
5. **Final Score**: Based on the above analysis, assign a score 1-5.
   Score: [1-5]
6. **Reasoning Summary**: Provide a concise explanation of your score.
   [Your explanation here]
"""
Key Takeaway: Explanations are valuable for both improving evaluation quality and enabling human oversight.
Interactive Evaluation Examples: Learning by Doing
To help you understand how LLM-as-judge evaluation works in practice, here are real examples you can test in my Streamlit dashboard’s Interactive tab. These examples demonstrate different scenarios I’ve encountered in my research and projects.
Example 1: ✅ Perfect Cross-Field Rule (Score: 5/5)
Task/Prompt:
Generate a cross-field validation rule for timestamp fields.Agent Output:
{
    "rule_type": "cross_field",
    "description": "start_time must be before end_time",
    "fields": ["start_time", "end_time"],
    "validation": "start_time < end_time"
}
Evaluation Result:
- Score: 5/5
- Reasoning: The output correctly generates a cross-field rule as requested, includes all required fields, and provides valid validation logic.
Why it’s good: This perfectly matches the task requirements. The agent understood the request and delivered exactly what was asked for.
Example 2: ❌ Wrong Rule Type (Score: 2/5)
Task/Prompt:
Generate a cross-field validation rule for timestamp fields.Agent Output:
{
    "rule_type": "single_field",
    "description": "Alert when start_time is null",
    "field": "start_time",
    "validation": "start_time IS NULL"
}
Evaluation Result:
- Score: 2/5
- Reasoning: The task requested a cross-field rule, but the output provides a single-field rule. This is a major failure to complete the requested task.
Why it’s bad: The agent completely missed the core requirement. While the output is technically valid, it doesn’t address what was asked.
Example 3: ⚠️ Acceptable but Basic (Score: 3/5)
Task/Prompt:
Generate a data quality monitor for customer email validation.Agent Output:
{
    "rule_type": "single_field",
    "description": "Alert when email is null",
    "field": "email",
    "validation": "email IS NULL"
}
Evaluation Result:
- Score: 3/5
- Reasoning: Output is valid but may not fully match the task requirements. The task asked for email validation, but this only checks for nulls, not format validation.
Why it’s partial: The agent addressed part of the requirement (null checking) but missed the format validation aspect.
Example 4: ✅ Complex Rule Correctly Implemented (Score: 5/5)
Task/Prompt:
Create a cross-field validation rule where order_total must equal the sum of line_item_amounts.Agent Output:
{
    "rule_type": "cross_field",
    "description": "Order total must equal sum of line items",
    "fields": ["order_total", "line_item_amounts"],
    "validation": "order_total = SUM(line_item_amounts)"
}
Evaluation Result:
- Score: 5/5
- Reasoning: Correctly implements the complex business rule with proper field relationships and validation logic.
Why it’s excellent: The agent understood a complex requirement and implemented it correctly with proper field relationships.
Example 5: ❌ Wrong Format and Type (Score: 2/5)
Task/Prompt:
Generate a cross-field validation rule for timestamp fields.Agent Output:
{
    "type": "single",
    "desc": "Check if time is valid",
    "field_name": "timestamp"
}
Evaluation Result:
- Score: 2/5
- Reasoning: Wrong format (incorrect field names), wrong type (single instead of cross-field), and doesn’t address the timestamp comparison requirement.
Why it’s poor: Multiple failures: format issues, wrong type, and missing the core requirement.
Example 6: ⚠️ Partial Match (Score: 3/5)
Task/Prompt:
Generate a comprehensive data quality monitor that checks both null values and format validation for email addresses.Agent Output:
{
    "rule_type": "single_field",
    "description": "Alert when email is null",
    "field": "email",
    "validation": "email IS NULL"
}
Evaluation Result:
- Score: 3/5
- Reasoning: Only addresses part of the requirement (null checking) but completely misses format validation.
Why it’s incomplete: The task explicitly asked for “both” checks, but the agent only provided one.
Example 7: ✅ Perfect Single-Field Rule (Score: 5/5)
Task/Prompt:
Generate a single-field monitor to alert when customer_id is null.Agent Output:
{
    "rule_type": "single_field",
    "description": "Alert when customer_id is null",
    "field": "customer_id",
    "validation": "customer_id IS NULL"
}
Evaluation Result:
- Score: 5/5
- Reasoning: Perfect match for single-field task with correct format and validation logic.
Why it’s perfect: When the task is simple and clear, the agent delivered exactly what was needed.
Example 8: ✅ Statistical Anomaly Rule (Score: 4/5)
Task/Prompt:
Generate a statistical anomaly monitor for revenue field.Agent Output:
{
    "rule_type": "statistical",
    "description": "Alert when revenue deviates more than 3 standard deviations",
    "field": "revenue",
    "validation": "ABS(revenue - AVG(revenue)) > 3 * STDDEV(revenue)"
}
Evaluation Result:
- Score: 4/5
- Reasoning: Good implementation of statistical monitoring with proper validation logic. Minor formatting could be improved.
Why it’s good: Correctly implements a complex statistical rule with proper mathematical validation.
Testing These Examples
You can test all these examples in my Streamlit dashboard:
- Open the Interactive tab in the Streamlit app
- Copy the Task/Prompt into the first text area
- Copy the Agent Output JSON into the second text area
- Click “Evaluate” to see the score and reasoning
This hands-on experience will help you understand how LLM-as-judge evaluation works and what to look for when monitoring your own agents.
📊 Score Smoothing: Dealing with Evaluation Hallucinations
⚠️ The Problem
Even LLM judges can hallucinate 🧠💭. You might get a score of 2 for a perfectly good output, or a score of 5 for a terrible one. These random fluctuations can create noise in your monitoring system 📈📉.
My Solution
I use a two-stage approach:
- Score Smoothing: Apply a moving average to reduce noise
- Re-evaluation on Soft Failures: When scores are borderline, automatically re-run the evaluation
File: code/score_smoothing.py
import numpy as np
from collections import deque
from typing import List, Optional
class ScoreSmoother:
    """Smooth evaluation scores to reduce noise from evaluation hallucinations."""
    def __init__(self, window_size: int = 5):
        self.window_size = window_size
        self.score_history = deque(maxlen=window_size)
    def add_score(self, score: float) -> float:
        """Add a new score and return the smoothed value."""
        self.score_history.append(score)
        return self.get_smoothed_score()
    def get_smoothed_score(self) -> float:
        """Calculate the moving average of recent scores."""
        if len(self.score_history) < 2:
            return self.score_history[0] if self.score_history else 0.0
        return np.mean(list(self.score_history))
    def should_alert(self, threshold: float = 3.0) -> bool:
        """Check if smoothed score is below threshold."""
        return self.get_smoothed_score() < threshold
class ReEvaluationHandler:
    """Handle re-evaluation of borderline scores."""
    def __init__(self, lower_threshold: float = 2.5, upper_threshold: float = 3.5):
        self.lower_threshold = lower_threshold
        self.upper_threshold = upper_threshold
    def should_reevaluate(self, score: float) -> bool:
        """Determine if a score is in the 'soft failure' zone."""
        return self.lower_threshold <= score <= self.upper_threshold
    def evaluate_with_retry(self, evaluator, input_data: dict, max_retries: int = 2) -> dict:
        """Evaluate and retry if score is borderline."""
        results = []
        for attempt in range(max_retries):
            result = evaluator.evaluate(input_data)
            results.append(result)
            if not self.should_reevaluate(result['score']):
                # Score is clear - no need to retry
                break
        # If I have multiple results, use the most consistent one
        if len(results) > 1:
            scores = [r['score'] for r in results]
            # Use the median score as it's more robust to outliers
            final_score = np.median(scores)
            # Use the reasoning from the evaluation closest to the median
            closest_idx = np.argmin([abs(r['score'] - final_score) for r in results])
            return {
                'score': final_score,
                'reasoning': results[closest_idx]['reasoning'],
                'retries': len(results)
            }
        return results[0]
Key Takeaway 💡: Don’t trust a single evaluation. Use smoothing and retries to handle noise.
🏗️ Building the Complete Monitoring System
Now let’s put it all together into a monitoring system. This section will walk you through building the entire pipeline from scratch, with complete code examples from my implementation that you can use as a starting point for your own projects. Note: You’ll need to adapt error handling, authentication, and deployment to your specific environment.
Understanding the Full Stack
Before we start coding, let me explain what I built and how you can replicate it in your own projects:
- Instrumentation Layer: Add OpenTelemetry to your agent (collects traces)
- Storage Layer: Store traces in S3 and query from Snowflake (raw trace data)
- Evaluation Layer: Run LLM-as-judge evaluations on traces (processes traces, generates scores)
- Results Storage: Store evaluation results in database (scores, alerts, trace IDs)
- Alerting Layer: Notify when issues are detected (reads from evaluation results)
- Visualization Layer: Dashboard reads evaluation results (not raw traces)
Each layer builds on the previous one, and I’ll show you how to implement them step by step.
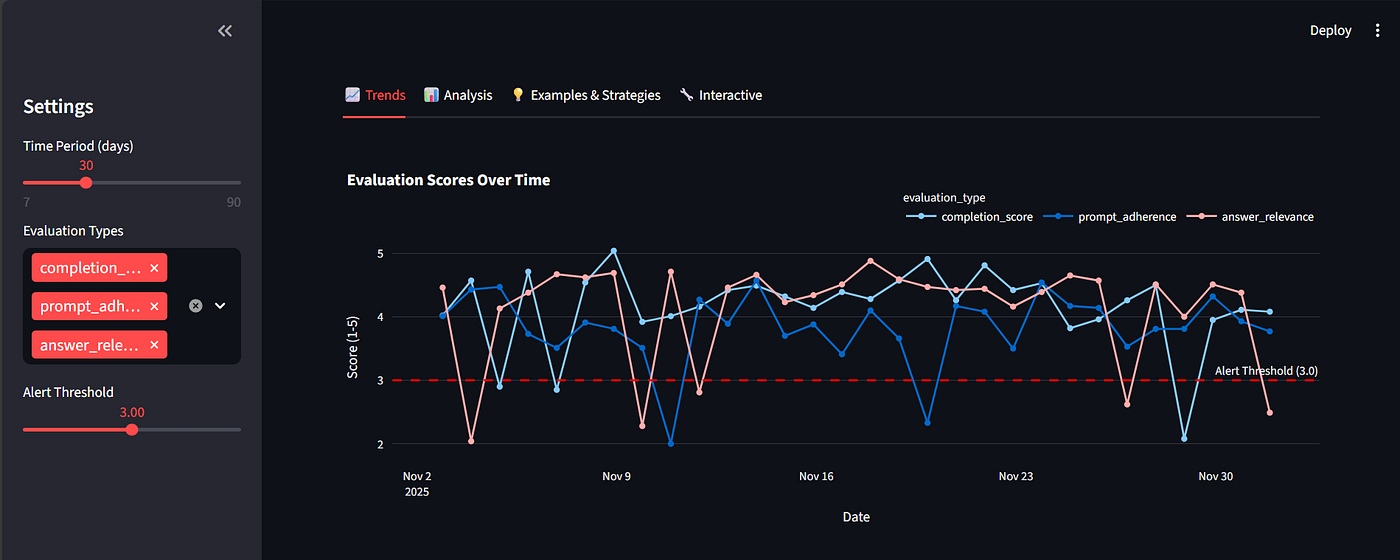
Created using Sample Data
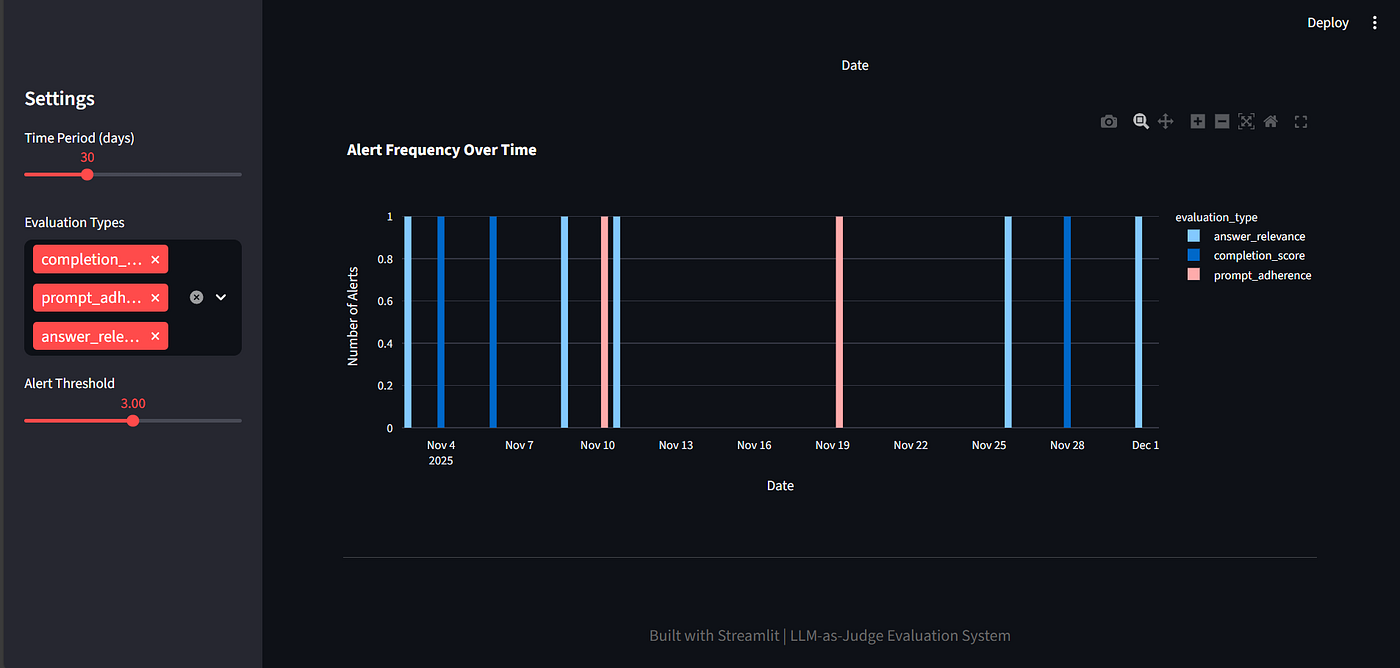
Created using sample data
Step 1: Setting Up OpenTelemetry
OpenTelemetry is the foundation of my observability system. It’s what allows me to see what my agent is doing. Learning OpenTelemetry was initially challenging, but it’s become essential to my workflow.
File: code/telemetry_setup.py
from opentelemetry import trace
from opentelemetry.sdk.trace import TracerProvider
from opentelemetry.sdk.trace.export import BatchSpanProcessor
from opentelemetry.exporter.otlp.proto.grpc.trace_exporter import OTLPSpanExporter
import boto3
import json
# Initialize tracing
trace.set_tracer_provider(TracerProvider())
tracer = trace.get_tracer(__name__)
# Set up S3 exporter for traces
# Note: In production, I recommend using an OpenTelemetry Collector
# to handle export to S3, rather than writing a custom exporter.
# This is illustrative code showing the concept.
from opentelemetry.sdk.trace.export import SpanExporter, SpanExportResult
class S3TraceExporter(SpanExporter):
    """
    Export traces to S3 for later processing.
    This is a simplified example. In production, use OpenTelemetry Collector
    with an S3 exporter or OTLP exporter to a collector that handles S3.
    **Important**: This exporter is for demonstration purposes. In production,
    use the OpenTelemetry Collector with an S3 exporter for a fully production-ready solution.
    """
    def __init__(self, bucket_name: str, prefix: str = "traces/"):
        self.s3_client = boto3.client('s3')
        self.bucket_name = bucket_name
        self.prefix = prefix
    def export(self, spans):
        """Export spans to S3. Returns SpanExportResult."""
        try:
            for span in spans:
                trace_data = {
                    'trace_id': format(span.context.trace_id, '032x'),
                    'span_id': format(span.context.span_id, '016x'),
                    'name': span.name,
                    'start_time': span.start_time,
                    'end_time': span.end_time,
                    'attributes': dict(span.attributes) if span.attributes else {},
                    'events': [{'name': e.name, 'timestamp': e.timestamp} for e in span.events]
                }
                key = f"{self.prefix}{trace_data['trace_id']}/{trace_data['span_id']}.json"
                self.s3_client.put_object(
                    Bucket=self.bucket_name,
                    Key=key,
                    Body=json.dumps(trace_data)
                )
            return SpanExportResult.SUCCESS
        except Exception as e:
            # In production, log this properly
            print(f"Failed to export spans to S3: {e}")
            return SpanExportResult.FAILURE
    def shutdown(self):
        """Shutdown the exporter."""
        pass
# Add processor
span_processor = BatchSpanProcessor(S3TraceExporter("my-traces-bucket"))
trace.get_tracer_provider().add_span_processor(span_processor)
Step 2: Instrumenting the Agent
File: code/agent_instrumentation.py
from opentelemetry import trace
import json
tracer = trace.get_tracer(__name__)
class MonitoringAgent:
    """AI agent that generates monitoring recommendations."""
    def __init__(self, llm_client):
        self.llm_client = llm_client
    def generate_recommendation(self, task: dict) -> dict:
        """Generate a monitoring recommendation with tracing."""
        with tracer.start_as_current_span("generate_recommendation") as span:
            # Add context
            span.set_attribute("task_type", task.get("type"))
            span.set_attribute("task_description", task.get("description"))
            try:
                # Generate recommendation
                prompt = self._build_prompt(task)
                span.set_attribute("prompt", prompt)
                response = self.llm_client.generate(prompt)
                span.set_attribute("response", json.dumps(response))
                # Parse and validate
                recommendation = self._parse_response(response)
                span.set_attribute("recommendation_type", recommendation.get("rule_type"))
                span.set_attribute("recommendation_valid", True)
                return recommendation
            except Exception as e:
                span.set_attribute("error", str(e))
                span.set_attribute("recommendation_valid", False)
                raise
Step 3: Building the Evaluation Engine
The evaluation engine is the core of my monitoring system. It’s responsible for:
- Retrieving traces from storage
- Running LLM-as-judge evaluations
- Storing results
- Triggering alerts
Architecture of the Evaluation Engine
The evaluation engine follows this flow:
1. Query traces from Snowflake
   ↓
2. Extract prompt and completion
   ↓
3. Fill evaluation template
   ↓
4. Call Groq LLM for evaluation
   ↓
5. Parse evaluation response
   ↓
6. Store results in Snowflake
   ↓
7. Check for alerts
Let’s build it step by step:
File: code/evaluation_engine.py
from typing import Dict, List
import json
from datetime import datetime
import boto3
import snowflake.connector
class EvaluationEngine:
    """Engine for running LLM-as-judge evaluations."""
    def __init__(self, llm_client, snowflake_config: dict):
        self.llm_client = llm_client
        self.snowflake_config = snowflake_config
        self.evaluators = self._load_evaluators()
    def _load_evaluators(self) -> Dict:
        """Load evaluation templates."""
        from code.evaluation_templates import (
            COMPLETION_SCORE_TEMPLATE,
            PROMPT_ADHERENCE_TEMPLATE
        )
        return {
            'completion_score': COMPLETION_SCORE_TEMPLATE,
            'prompt_adherence': PROMPT_ADHERENCE_TEMPLATE
        }
    def evaluate_trace(self, trace_id: str) -> Dict:
        """Evaluate a specific trace from Snowflake."""
        # Query trace from Snowflake
        trace_data = self._get_trace_from_snowflake(trace_id)
        # Extract prompt and completion
        prompt = trace_data.get('prompt')
        completion = trace_data.get('completion')
        # Run evaluations
        results = {}
        for eval_type, template in self.evaluators.items():
            result = self._run_evaluation(template, prompt, completion)
            results[eval_type] = result
        # Store results
        self._store_evaluation_results(trace_id, results)
        # Check for alerts
        self._check_alerts(trace_id, results)
        return results
    def _run_evaluation(self, template: str, prompt: str, completion: str) -> Dict:
        """Run a single evaluation."""
        filled_template = template.replace("{{prompts}}", prompt)
        filled_template = filled_template.replace("{{completions}}", json.dumps(completion))
        response = self.llm_client.generate(filled_template)
        # Parse structured response
        return self._parse_evaluation_response(response)
    def _parse_evaluation_response(self, response: str) -> Dict:
        """Parse evaluation response (handles both JSON and text formats)."""
        try:
            # Try to extract JSON
            json_start = response.find('{')
            json_end = response.rfind('}') + 1
            if json_start != -1:
                json_str = response[json_start:json_end]
                return json.loads(json_str)
        except:
            pass
        # Fallback: extract score from text
        import re
        score_match = re.search(r'score[:\s]+(\d)', response, re.IGNORECASE)
        reasoning_match = re.search(r'reasoning[:\s]+(.+?)(?:\n|$)', response, re.IGNORECASE)
        return {
            'score': int(score_match.group(1)) if score_match else None,
            'reasoning': reasoning_match.group(1).strip() if reasoning_match else response
        }
    def _get_trace_from_snowflake(self, trace_id: str) -> Dict:
        """Query trace data from Snowflake."""
        conn = snowflake.connector.connect(**self.snowflake_config)
        cursor = conn.cursor()
        # Use parameterized query to prevent SQL injection
        query = """
        SELECT
            trace_id,
            span_data:attributes:prompt as prompt,
            span_data:attributes:response as completion,
            span_data:attributes:task_type as task_type
        FROM traces_table
        WHERE trace_id = %s
        """
        cursor.execute(query, (trace_id,))
        result = cursor.fetchone()
        cursor.close()
        conn.close()
        return {
            'trace_id': result[0],
            'prompt': result[1],
            'completion': json.loads(result[2]) if result[2] else {},
            'task_type': result[3]
        }
    def _store_evaluation_results(self, trace_id: str, results: Dict):
        """Store evaluation results back to Snowflake."""
        conn = snowflake.connector.connect(**self.snowflake_config)
        cursor = conn.cursor()
        for eval_type, result in results.items():
            # Use parameterized queries to prevent SQL injection
            insert_query = """
            INSERT INTO evaluation_results (
                trace_id,
                evaluation_type,
                score,
                reasoning,
                timestamp
            ) VALUES (?, ?, ?, ?, CURRENT_TIMESTAMP())
            """
            cursor.execute(insert_query, (
                trace_id,
                eval_type,
                result.get('score'),
                result.get('reasoning', '')
            ))
        conn.commit()
        cursor.close()
        conn.close()
    def _check_alerts(self, trace_id: str, results: Dict):
        """Check if any scores trigger alerts."""
        ALERT_THRESHOLDS = {
            'completion_score': 3.0,
            'prompt_adherence': 3.0
        }
        for eval_type, result in results.items():
            score = result.get('score')
            threshold = ALERT_THRESHOLDS.get(eval_type)
            if score and threshold and score < threshold:
                self._send_alert(trace_id, eval_type, score, result.get('reasoning'))
    def _send_alert(self, trace_id: str, eval_type: str, score: float, reasoning: str):
        """Send alert notification."""
        # Implement your alerting logic (email, Slack, PagerDuty, etc.)
        print(f"ALERT: {eval_type} score {score} for trace {trace_id}")
        print(f"Reasoning: {reasoning}")
Step 4: Continuous Evaluation Pipeline
File: code/continuous_evaluation.py
import time
from datetime import datetime, timedelta
from evaluation_engine import EvaluationEngine
class ContinuousEvaluator:
    """Continuously evaluate new traces."""
    def __init__(self, evaluation_engine: EvaluationEngine, check_interval: int = 300):
        self.evaluation_engine = evaluation_engine
        self.check_interval = check_interval  # seconds
        self.last_check_time = datetime.now() - timedelta(hours=1)
    def run(self):
        """Run continuous evaluation loop."""
        while True:
            try:
                # Get new traces since last check
                new_traces = self._get_new_traces()
                for trace_id in new_traces:
                    print(f"Evaluating trace {trace_id}...")
                    results = self.evaluation_engine.evaluate_trace(trace_id)
                    print(f"Results: {results}")
                self.last_check_time = datetime.now()
                time.sleep(self.check_interval)
            except KeyboardInterrupt:
                print("Stopping continuous evaluator...")
                break
            except Exception as e:
                print(f"Error in evaluation loop: {e}")
                time.sleep(60)  # Wait before retrying
    def _get_new_traces(self) -> List[str]:
        """Get trace IDs that haven't been evaluated yet."""
        # Query Snowflake for traces created since last_check_time
        # that don't have evaluation results
        # Implementation depends on your Snowflake schema
        pass
# Run the continuous evaluator
if __name__ == "__main__":
    from code.evaluation_engine import EvaluationEngine, GroqLLMClient
    from code.telemetry_setup import get_snowflake_config
    # Initialize with Groq for fast inference
    llm_client = GroqLLMClient(model_name="llama-3.3-70b-versatile")
    engine = EvaluationEngine(
        llm_client=llm_client,
        snowflake_config=get_snowflake_config()
    )
    evaluator = ContinuousEvaluator(engine)
    evaluator.run()
🔍 Real-World Example: The Incident Resolution
Let me walk you through exactly what happened when I caught my agent misbehaving. This is a complete, real-world example from my research that shows the entire evaluation process from alert to resolution. I’ve documented this thoroughly because it’s a perfect case study.
The Timeline
Here’s the complete timeline of the incident:
- 10:23:45 AM — Alert triggered
- 10:24:00 AM — Investigation started
- 10:25:30 AM — Root cause identified
- 10:30:00 AM — Fix implemented
- 10:35:00 AM — Verification completed
Total time from alert to resolution: 11 minutes. Without evaluation monitoring, this would have taken weeks or months.
The Alert
[2025-11-08 10:23:45] ALERT: completion_score below threshold
Trace ID: abc123def456
Score: 2.0
Threshold: 3.0
Evaluation Type: completion_score
The Investigation
I queried the trace from Snowflake:
SELECT
    span_data:attributes:prompt as prompt,
    span_data:attributes:response as completion,
    span_data:attributes:task_type as task_type
FROM traces_table
WHERE trace_id = 'abc123def456'
The Prompt:
Generate a cross-field validation rule for the following scenario:
- Field 1: order_timestamp (timestamp)
- Field 2: delivery_timestamp (timestamp)
- Business rule: Orders must be delivered after they are placed
The Agent’s Output:
{
    "rule_type": "single_field",
    "description": "Alert when order_timestamp is null",
    "field": "order_timestamp",
    "validation": "order_timestamp IS NULL"
}
The Evaluation
My LLM judge (using llama-3.3–70b-versatile) evaluated this:
Score: 2
Reasoning:
The task explicitly requested a cross-field validation rule comparing two timestamp fields. However, the output provides a single-field null check. While the output is technically valid and correctly formatted, it completely fails to address the core requirement of the task. This represents a major failure in task completion.
The Fix
I identified that my agent was sometimes defaulting to simpler recommendations when the prompt wasn’t clear enough. Here’s what I did to fix it:
- Improved prompt engineering: Added more explicit examples of cross-field rules in the agent’s system prompt
- Added validation: Implemented a check that cross-field tasks must produce cross-field outputs
- Enhanced few-shot examples: Included more diverse cross-field rule examples in the agent’s context
The Result
After implementing these fixes, similar tasks now consistently produce cross-field rules, and my completion scores improved from an average of 3.2 to 4.6. This was a significant improvement that validated my evaluation approach.
The best part? I caught this issue early because of my evaluation system. Without it, I would have continued thinking everything was fine while my agent’s quality slowly degraded.
🔌 Connecting Real Data: From Sample to Production
The Streamlit dashboard I’ve built uses realistic sample data for demonstration. This is great for learning and testing, but to use it in production, you need to connect it to your actual evaluation results.
Important Note: The Streamlit dashboard reads evaluation results (scores, alerts, trace IDs) from your database, not raw OpenTelemetry traces. This is by design — the evaluation engine processes traces and stores results, and the dashboard visualizes those results. I’ll show you exactly how to connect it to your data sources.
Why Real Data Matters
Sample data is useful for:
- Learning how the dashboard works
- Testing visualizations
- Demonstrating concepts
But real data is essential for:
- Making actual decisions
- Identifying real problems
- Monitoring actual agent performance
- Building trust with stakeholders
Understanding Data Requirements
Understanding the Data Flow: The dashboard reads evaluation results (not raw OpenTelemetry traces). Here’s how the data flows:
- Agent generates output → OpenTelemetry captures trace
- Trace stored in S3 → Queried from Snowflake
- Evaluation Engine processes trace → Generates evaluation scores
- Results stored in database → Dashboard reads from here
The dashboard expects evaluation results with the following structure. Before connecting a data source, you need to understand what data format the dashboard expects:
Required Columns:
date: Timestamp of the evaluation (datetime)evaluation_type: Type of evaluation (string: "completion_score", "prompt_adherence", etc.)score: Evaluation score (float: 1.0-5.0)trace_id: Unique identifier for the trace (string)
Optional but Recommended:
prompt: The original prompt (for debugging)completion: The agent's output (for analysis)reasoning: Evaluation reasoning (for understanding scores)
Data Source Options
I’ve implemented support for multiple data sources to fit different infrastructure setups:
- Snowflake ❄️ — Best for large-scale deployments with existing data warehouses
- PostgreSQL 🐘 — Good for smaller deployments or teams already using PostgreSQL
- CSV Files 📄 — Perfect for testing, small deployments, or one-off analyses
- REST APIs 🌐 — Ideal for microservices architectures or when data is exposed via API
Let’s explore each option in detail:
Option 1: Connecting to Snowflake
Snowflake is an excellent choice for storing evaluation results, especially if you’re already using it for your data warehouse. Here’s how to set it up:
Step 1: Set Up Your Snowflake Schema
First, create a table to store evaluation results:
-- Create evaluation results table
CREATE TABLE evaluation_results (
    trace_id VARCHAR(255),
    evaluation_type VARCHAR(100),
    score FLOAT,
    reasoning TEXT,
    timestamp TIMESTAMP_NTZ,
    prompt TEXT,
    completion TEXT,
    metadata VARIANT
);
-- Create clustering key for faster queries (Snowflake uses clustering, not traditional indexes)
ALTER TABLE evaluation_results
  CLUSTER BY (timestamp, evaluation_type);
Step 2: Update the Streamlit App
Replace the generate_sample_data() function with a real data fetcher:
File: streamlit_app/data_connectors.py
import snowflake.connector
import pandas as pd
from datetime import datetime, timedelta
import os
def get_snowflake_connection():
    """Get Snowflake connection from environment variables."""
    return snowflake.connector.connect(
        user=os.getenv('SNOWFLAKE_USER'),
        password=os.getenv('SNOWFLAKE_PASSWORD'),
        account=os.getenv('SNOWFLAKE_ACCOUNT'),
        warehouse=os.getenv('SNOWFLAKE_WAREHOUSE'),
        database=os.getenv('SNOWFLAKE_DATABASE'),
        schema=os.getenv('SNOWFLAKE_SCHEMA')
    )
def get_real_evaluation_data(days: int = 30) -> pd.DataFrame:
    """
    Fetch real evaluation data from Snowflake.
    Args:
        days: Number of days of data to retrieve
    Returns:
        DataFrame with evaluation results
    """
    conn = get_snowflake_connection()
    cursor = conn.cursor()
    try:
        query = f"""
        SELECT
            timestamp as date,
            evaluation_type,
            score,
            trace_id
        FROM evaluation_results
        WHERE timestamp >= CURRENT_DATE - {days}
        ORDER BY timestamp DESC
        """
        cursor.execute(query)
        results = cursor.fetchall()
        df = pd.DataFrame(
            results,
            columns=['date', 'evaluation_type', 'score', 'trace_id']
        )
        return df
    finally:
        cursor.close()
        conn.close()
Step 3: Update the Main App
In streamlit_app/app.py, replace the sample data call:
# Instead of:
df = generate_sample_data(days)
# Use:
try:
    from streamlit_app.data_connectors import get_real_evaluation_data
    df = get_real_evaluation_data(days)
except Exception as e:
    st.warning(f"Could not connect to Snowflake: {e}. Using sample data.")
    df = generate_sample_data(days)
Step 4: Set Environment Variables
Add to your .env file:
SNOWFLAKE_ACCOUNT=your_account
SNOWFLAKE_USER=your_username
SNOWFLAKE_PASSWORD=your_password
SNOWFLAKE_WAREHOUSE=your_warehouse
SNOWFLAKE_DATABASE=your_database
SNOWFLAKE_SCHEMA=your_schema
Option 2: Connecting to PostgreSQL/MySQL
If you’re using a traditional SQL database, here’s how to connect:
File: streamlit_app/data_connectors.py
import psycopg2  # For PostgreSQL
# or import mysql.connector  # For MySQL
import pandas as pd
import os
def get_postgres_connection():
    """Get PostgreSQL connection."""
    return psycopg2.connect(
        host=os.getenv('POSTGRES_HOST'),
        database=os.getenv('POSTGRES_DATABASE'),
        user=os.getenv('POSTGRES_USER'),
        password=os.getenv('POSTGRES_PASSWORD'),
        port=os.getenv('POSTGRES_PORT', 5432)
    )
def get_real_evaluation_data(days: int = 30) -> pd.DataFrame:
    """Fetch real evaluation data from PostgreSQL."""
    conn = get_postgres_connection()
    try:
        query = f"""
        SELECT
            timestamp as date,
            evaluation_type,
            score,
            trace_id
        FROM evaluation_results
        WHERE timestamp >= NOW() - INTERVAL '{days} days'
        ORDER BY timestamp DESC
        """
        df = pd.read_sql_query(query, conn)
        return df
    finally:
        conn.close()
Option 3: Connecting to CSV Files
For smaller deployments or testing, you can use CSV files:
File: streamlit_app/data_connectors.py
import pandas as pd
from pathlib import Path
def get_csv_evaluation_data(csv_path: str = "evaluation_results.csv", days: int = 30) -> pd.DataFrame:
    """Load evaluation data from CSV file."""
    df = pd.read_csv(csv_path)
    # Convert timestamp column
    df['date'] = pd.to_datetime(df['timestamp'])
    # Filter by date range
    cutoff_date = datetime.now() - timedelta(days=days)
    df = df[df['date'] >= cutoff_date]
    return df[['date', 'evaluation_type', 'score', 'trace_id']]
CSV Format:
timestamp,evaluation_type,score,trace_id,prompt,completion
2025-11-01 10:00:00,completion_score,4.2,trace_1234,"Generate rule...","{rule_type: cross_field...}"
2025-11-01 10:05:00,prompt_adherence,3.8,trace_1235,"Generate rule...","{rule_type: single_field...}"
Option 4: Connecting via REST API
If your evaluation results are exposed via an API:
File: streamlit_app/data_connectors.py
---

import requests
import pandas as pd
from datetime import datetime, timedelta
def get_api_evaluation_data(api_url: str, days: int = 30) -> pd.DataFrame:
    """Fetch evaluation data from REST API."""
    params = {
        'days': days,
        'format': 'json'
    }
    headers = {
        'Authorization': f"Bearer {os.getenv('API_TOKEN')}"
    }
    response = requests.get(api_url, params=params, headers=headers)
    response.raise_for_status()
    data = response.json()
    df = pd.DataFrame(data['results'])
    # Convert timestamp
    df['date'] = pd.to_datetime(df['timestamp'])
    return df[['date', 'evaluation_type', 'score', 'trace_id']]

---

Complete Integration Example
Here’s a complete example that tries multiple data sources with fallback:
File: streamlit_app/app.py
def get_evaluation_data(days: int = 30) -> pd.DataFrame:
    """
    Get evaluation data from the best available source.
    Tries: Snowflake -> PostgreSQL -> CSV -> Sample Data
    """
    # Try Snowflake first
    try:
        from streamlit_app.data_connectors import get_real_evaluation_data
        df = get_real_evaluation_data(days)
        if len(df) > 0:
            st.success(f"✅ Loaded {len(df)} real evaluations from Snowflake")
            return df
    except Exception as e:
        st.warning(f"Snowflake connection failed: {e}")
    # Try PostgreSQL
    try:
        from streamlit_app.data_connectors import get_postgres_evaluation_data
        df = get_postgres_evaluation_data(days)
        if len(df) > 0:
            st.success(f"✅ Loaded {len(df)} real evaluations from PostgreSQL")
            return df
    except Exception as e:
        st.warning(f"PostgreSQL connection failed: {e}")
    # Try CSV
    try:
        from streamlit_app.data_connectors import get_csv_evaluation_data
        df = get_csv_evaluation_data(days=days)
        if len(df) > 0:
            st.success(f"✅ Loaded {len(df)} evaluations from CSV")
            return df
    except Exception as e:
        st.warning(f"CSV load failed: {e}")
    # Fallback to sample data
    st.info("ℹ️ Using sample data. Connect to your data source to see real results.")
    return generate_sample_data(days)
Storing Evaluation Results
To populate your database with evaluation results, update your evaluation engine:
File: code/evaluation_engine.py
def _store_evaluation_results(self, results: List[EvaluationResult]):
    """Store evaluation results in Snowflake."""
    conn = get_snowflake_connection()
    cursor = conn.cursor()
    try:
        for result in results:
            insert_query = """
            INSERT INTO evaluation_results (
                trace_id, evaluation_type, score, reasoning,
                timestamp, prompt, completion, metadata
            ) VALUES (?, ?, ?, ?, ?, ?, ?, ?)
            """
            cursor.execute(insert_query, (
                result.trace_id,
                result.evaluation_type,
                result.score,
                result.reasoning,
                result.timestamp,
                result.metadata.get('prompt', ''),
                result.metadata.get('completion', ''),
                json.dumps(result.metadata)
            ))
        conn.commit()
    except Exception as e:
        conn.rollback()
        logger.error(f"Failed to store evaluation results: {e}")
        raise
    finally:
        cursor.close()
        conn.close()
Performance Optimization Tips
- Use Materialized Views: For frequently accessed aggregations
CREATE MATERIALIZED VIEW eval_daily_summary AS SELECT DATE(timestamp) as date, evaluation_type, AVG(score) as avg_score, COUNT(*) as count FROM evaluation_results GROUP BY DATE(timestamp), evaluation_type;2. Add Caching: Cache query results in Streamlit
@st.cache_data(ttl=300) # Cache for 5 minutes def get_evaluation_data(days: int): return get_real_evaluation_data(days)3. Use Connection Pooling: For high-traffic applications
from sqlalchemy import create_engine engine = create_engine('snowflake://...', pool_size=10)Security Best Practices
- Never commit credentials: Always use environment variables
- Use read-only users: For dashboard connections
- Implement row-level security: If needed for multi-tenant setups
- Encrypt connections: Use SSL/TLS for database connections
- Rotate credentials: Regularly update API keys and passwords
Troubleshooting Connection Issues
Issue: “Connection timeout”
- Solution: Check network connectivity and firewall rules
- Solution: Verify database is accessible from your deployment environment
Issue: “Authentication failed”
- Solution: Verify credentials in
.envfile - Solution: Check if user has proper permissions
Issue: “Table not found”
- Solution: Verify schema and table names
- Solution: Run the schema creation script
Issue: “Slow queries”
- Solution: For Snowflake, use clustering keys (already set up with CLUSTER BY). Snowflake doesn’t support traditional CREATE INDEX statements — use clustering instead.
- Solution: Use materialized views for aggregations
- Solution: Limit date ranges in queries
Next Steps
Once you’ve connected your data source:
- Verify data quality: Check that scores are in expected ranges (1–5)
- Set up alerts: Configure thresholds based on your actual data
- Monitor performance: Track query times and optimize as needed
- Add more metrics: Expand beyond the three default evaluation types
- Create dashboards: Build custom views for different stakeholders
With real data connected, your dashboard becomes a powerful tool for monitoring AI agent performance in production! 🚀
📱 Using the Monitoring App: Complete Guide
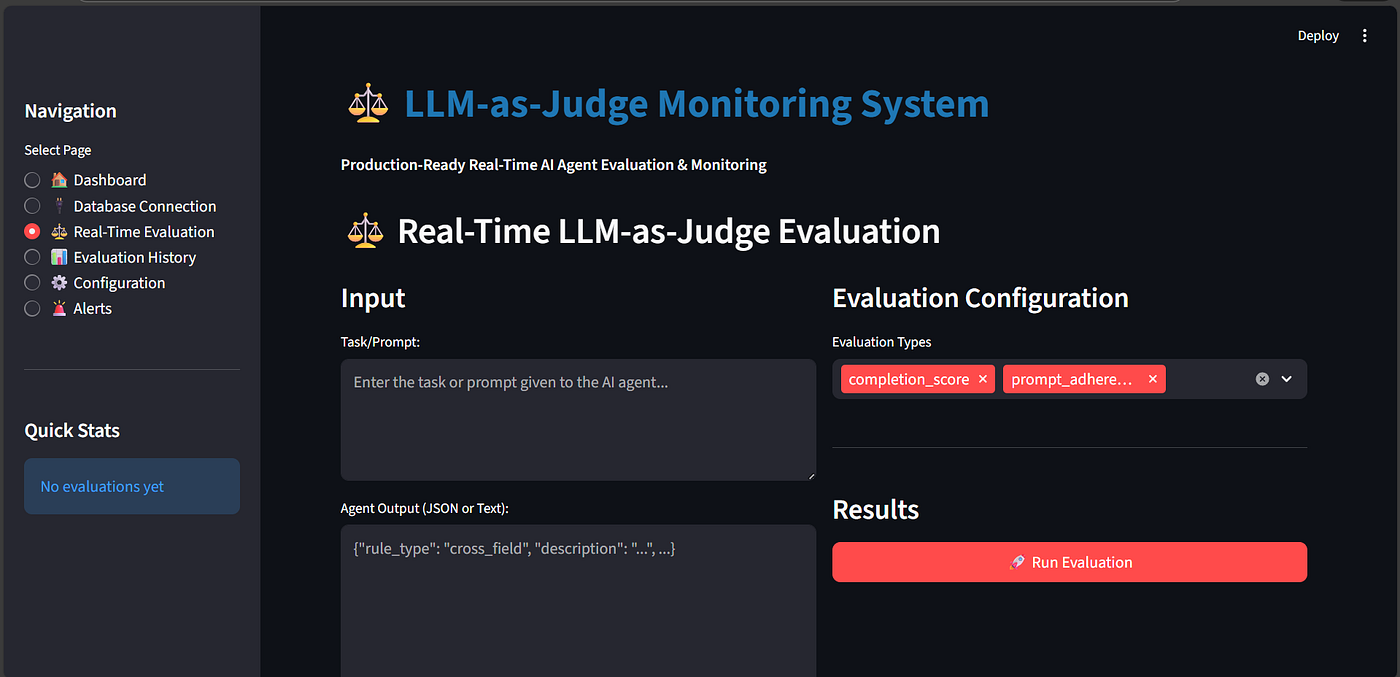
Now that you understand how to connect to different data sources, let me walk you through exactly how to use the monitoring application I’ve built. This section covers everything from getting started to advanced usage.
🚀 Getting Started
The project includes two Streamlit applications:
**streamlit_app/monitoring_app.py** - Production-ready comprehensive monitoring system (Recommended)**streamlit_app/app.py** - Simpler visualization dashboard
Starting the Production-Ready Monitoring App
# Make sure you have installed dependencies
pip install -r requirements.txt

# Run the comprehensive monitoring app
streamlit run streamlit_app/monitoring_app.py
The app will open in your browser at [http://localhost:8501.](http://localhost:8501.)
🏠 Dashboard Page
The Dashboard page is your main monitoring interface. Here’s what you’ll see:
Key Metrics Display
At the top, you’ll see four key metrics:
- Average Score: Overall performance across all evaluations
- Total Evaluations: Number of evaluations processed
- Alerts: Count of evaluations below threshold
- Alert Rate: Percentage of evaluations that triggered alerts
Interactive Charts
- Score Trends: Line chart showing evaluation scores over time, with different colors for each evaluation type (completion_score, prompt_adherence, answer_relevance)
- Score Distribution: Histogram showing how scores are distributed
- Alert Frequency: Bar chart showing when alerts occurred most frequently
Data Loading
The dashboard automatically tries to load data from:
- Connected database (Snowflake, PostgreSQL, CSV, or API)
- Sample data (if no database is connected)
You’ll see a status message indicating which source is being used.
🔌 Database Connection Page
This is where you connect your data sources. Here’s how to use each option:
Connecting to CSV File
For Testing and Development: The CSV file is perfect for testing the monitoring system before connecting to production databases.
Step 1: Understanding the CSV Format
The CSV file (evaluation_results.csv in the project root) contains evaluation results with these columns:
Required Columns:
timestamp: When the evaluation was performed (ISO format: "2025-01-01 08:15:23")evaluation_type: Type of evaluation (completion_score,prompt_adherence,answer_relevance)score: Evaluation score (float, 1.0-5.0)trace_id: Unique identifier for the trace being evaluated (e.g., "trace_001")
Optional Columns:
prompt: Original prompt given to the agent (useful for debugging)completion: Agent's output JSON (useful for analysis)reasoning: Evaluation reasoning text (explains why the score was given)
Step 2: Using the Sample CSV
I’ve included a sample CSV file (evaluation_results.csv) with 90 evaluation records spanning 3 days. This demonstrates:
- Various evaluation types
- Score range from 1.4 to 4.9
- Mix of good (4.0+), acceptable (3.0–4.0), and poor (❤.0) evaluations
- Realistic patterns showing some alerts below threshold
Step 3: Connecting to CSV in the App
- Navigate to “🔌 Database Connection” page
- Select “CSV” as database type
- Enter the path to your CSV file:
- For the sample file:
evaluation_results.csv - For a custom file: Enter the full path or relative path
- Click “Test Connection”
- Once connected, the Dashboard will automatically load data from your CSV
Step 4: How to Get Real Evaluation Data into CSV
In production, your evaluation engine will generate this data automatically. But for testing or manual evaluation, here’s how to create your own CSV:
import pandas as pd
from datetime import datetime, timedelta
import json
# Example: Creating evaluation results CSV
data = []
for i in range(30):  # 30 days of data
    date = datetime.now() - timedelta(days=i)
    # Example evaluation result
    data.append({
        'timestamp': date.strftime('%Y-%m-%d %H:%M:%S'),
        'evaluation_type': 'completion_score',
        'score': 4.2,  # Your evaluation score (1-5)
        'trace_id': f'trace_{i:03d}',
        'prompt': 'Your prompt here',
        'completion': json.dumps({"rule_type": "cross_field", "description": "..."}),
        'reasoning': 'Evaluation reasoning explaining the score'
    })
# Create DataFrame and save to CSV
df = pd.DataFrame(data)
df.to_csv('evaluation_results.csv', index=False)
In Production: Your ContinuousEvaluator or evaluation engine automatically stores results in your database. You can export these to CSV for analysis:
# Export from Snowflake/PostgreSQL to CSV for analysis
import pandas as pd
from streamlit_app.data_connectors import get_snowflake_connection
conn = get_snowflake_connection()
query = """
SELECT timestamp, evaluation_type, score, trace_id, prompt, completion, reasoning
FROM evaluation_results
WHERE timestamp >= CURRENT_DATE - 30
ORDER BY timestamp DESC
"""
df = pd.read_sql(query, conn)
df.to_csv('evaluation_results_export.csv', index=False)
⚖️ Real-Time Evaluation Page
This page allows you to run LLM-as-judge evaluations directly from the UI without needing your agent running.
Using Real-Time Evaluation
- Configure Groq API Key (if not already done):
- Go to “⚙️ Configuration” page first
- Enter your Groq API key
- Save configuration
2. Navigate to “⚖️ Real-Time Evaluation”
- Enter Input:
- Task/Prompt: The original prompt given to your agent
- Agent Output: The JSON or text output from your agent
2. Select Evaluation Types: Choose which evaluations to run:
- Completion Score: Did the agent complete the task?
- Prompt Adherence: Did the agent follow the prompt?
- Answer Relevance: Is the output relevant?
3. Click “🚀 Run Evaluation”
- View Results:
- Scores (1–5 scale) for each evaluation type
- Reasoning explanations
- Alert status (if score is below threshold)
- Full evaluation history
Example Usage
Prompt:
Generate a cross-field validation rule for timestamp fields:
- Field 1: order_timestamp
- Field 2: delivery_timestamp
- Business rule: Orders must be delivered after they are placed
Agent Output:
{
    "rule_type": "cross_field",
    "description": "delivery_timestamp must be after order_timestamp",
    "fields": ["delivery_timestamp", "order_timestamp"],
    "validation": "delivery_timestamp > order_timestamp"
}
The evaluator will assess this and provide scores with detailed reasoning.
📊 Evaluation History Page
View all past evaluations with filtering options:
- Filter by Type: Select specific evaluation types
- Date Range: Filter by time period
- Score Range: Show only evaluations in a specific score range
- Export to CSV: Download filtered results for analysis
⚙️ Configuration Page
Manage all settings:
- Groq API Key Configuration:
- Enter your Groq API key (get from https://console.groq.com/)
- Select model(llama-3.3–70b-versatile)
- Save configuration
2. Alert Thresholds:
- Set thresholds for each evaluation type (default: 3.0)
- Evaluations below threshold trigger alerts
3. Configuration Management:
- Export configuration to JSON file
- Import configuration from JSON file
🚨 Alerts Page
Monitor and manage alerts:
- Alert List: All evaluations that scored below threshold
- Alert Frequency Chart: Visualize when alerts occur most often
- Alert Details: View full details including trace_id, prompt, completion, and reasoning
- Clear Alerts: Mark alerts as resolved
🔄 Complete Workflow Example
Here’s a complete workflow from start to finish:
- Initial Setup:
# 1. Install dependencies pip install -r requirements.txt
# 2. Set up environment variables # Create .env file with GROQ_API_KEY
# 3. Start the app streamlit run streamlit_app/monitoring_app.py
2. First Time Using CSV:
- Navigate to “🔌 Database Connection”
- Select “CSV”
- Enter path:
evaluation_results.csv - Click “Test Connection”
- Dashboard automatically loads sample data
3. Configure Evaluation:
- Go to “⚙️ Configuration”
- Enter Groq API key
- Set alert thresholds
- Save configuration
4. Run Evaluations:
- Go to “⚖️ Real-Time Evaluation”
- Enter a prompt and agent output
- Run evaluation
- View results and reasoning
5. Monitor Results:
- Check “🏠 Dashboard” for overall metrics
- Review “📊 Evaluation History” for detailed view
- Check “🚨 Alerts” for issues
6. Connect to Production Database (when ready):
- Navigate to “🔌 Database Connection”
- Select your database type (Snowflake, PostgreSQL, API)
- Enter connection details
- Test connection
- Dashboard automatically switches to production data
📝 CSV File: Complete Data Flow
Understanding how the CSV file fits into the complete data flow:
Data Flow Diagram
┌─────────────────────────────────────────────────────────┐
│  Your AI Agent (instrumented with OpenTelemetry)        │
│  - Generates outputs                                    │
│  - Creates traces with prompts and completions          │
└─────────────────────┬───────────────────────────────────┘
                      │
                      ▼
┌─────────────────────────────────────────────────────────┐
│  Evaluation Engine (code/evaluation_engine.py)          │
│  - Reads traces from Snowflake/OpenTelemetry            │
│  - Runs LLM-as-judge evaluations                        │
│  - Generates scores and reasoning                       │
└─────────────────────┬───────────────────────────────────┘
                      │
                      ▼
┌─────────────────────────────────────────────────────────┐
│  Data Storage (Choose One)                              │
│  ├─ Snowflake: evaluation_results table                 │
│  ├─ PostgreSQL: evaluation_results table                │
│  ├─ CSV: evaluation_results.csv (for testing)           │
│  └─ REST API: Your API endpoint                         │
└─────────────────────┬───────────────────────────────────┘
                      │
                      ▼
┌─────────────────────────────────────────────────────────┐
│  Streamlit Monitoring App                               │
│  - Reads from connected data source                     │
│  - Displays dashboards and charts                       │
│  - Shows alerts and trends                              │
└─────────────────────────────────────────────────────────┘
How the CSV File is Generated
Option 1: Export from Database If you’re using Snowflake or PostgreSQL, you can export evaluation results to CSV:
# Export recent evaluations to CSV
from streamlit_app.data_connectors import get_snowflake_connection
import pandas as pd
conn = get_snowflake_connection()
df = pd.read_sql("""
    SELECT timestamp, evaluation_type, score, trace_id, prompt, completion, reasoning
    FROM evaluation_results
    WHERE timestamp >= CURRENT_DATE - 7
    ORDER BY timestamp DESC
""", conn)
df.to_csv('last_week_evaluations.csv', index=False)
Option 2: Direct CSV Storage You can modify the evaluation engine to write directly to CSV (useful for testing):
# In evaluation_engine.py
import pandas as pd
from datetime import datetime
def _store_evaluation_results(self, results: List[EvaluationResult]):
    """Store results to CSV file."""
    csv_file = "evaluation_results.csv"
    # Prepare data
    rows = []
    for result in results:
        rows.append({
            'timestamp': result.timestamp.isoformat(),
            'evaluation_type': result.evaluation_type,
            'score': result.score,
            'trace_id': result.trace_id,
            'reasoning': result.reasoning,
            'prompt': result.metadata.get('prompt', ''),
            'completion': json.dumps(result.metadata.get('completion', {}))
        })
    # Append to CSV (create if doesn't exist)
    df_new = pd.DataFrame(rows)
    try:
        df_existing = pd.read_csv(csv_file)
        df_combined = pd.concat([df_existing, df_new], ignore_index=True)
    except FileNotFoundError:
        df_combined = df_new
    df_combined.to_csv(csv_file, index=False)
Option 3: Continuous Export Set up a scheduled job to export from database to CSV:
# export_to_csv.py - Run as a cron job
import pandas as pd
from streamlit_app.data_connectors import get_snowflake_connection
from datetime import datetime
def export_evaluations_to_csv():
    conn = get_snowflake_connection()
    # Get today's evaluations
    query = """
    SELECT * FROM evaluation_results
    WHERE DATE(timestamp) = CURRENT_DATE
    """
    df = pd.read_sql(query, conn)
    if len(df) > 0:
        filename = f"evaluations_{datetime.now().strftime('%Y%m%d')}.csv"
        df.to_csv(filename, index=False)
        print(f"Exported {len(df)} evaluations to {filename}")
if __name__ == "__main__":
    export_evaluations_to_csv()
🎯 Key Takeaways for Using the Monitoring App
- Start with CSV: Use the sample CSV file to understand how the system works before connecting to production databases
- CSV is for Testing: In production, use Snowflake, PostgreSQL, or your API — CSV is primarily for development and one-off analysis
- Data Format is Consistent: Whether using CSV, Snowflake, or PostgreSQL, the data structure (timestamp, evaluation_type, score, trace_id) remains the same
- Real-Time Evaluation is Powerful: Use the Real-Time Evaluation page to test evaluation templates before deploying them
- Alerts Keep You Informed: Set appropriate thresholds to catch issues early
- History Tells the Story: Use Evaluation History to identify patterns and trends
The monitoring app is designed to grow with you — start simple with CSV, then move to production databases as your system scales! 🚀
✅ Best Practices Summary
Based on my experience 🧪 and research 📚, here are the key takeaways I’ve learned:
- Start Simple 🎯: Begin with basic evaluation templates, then add complexity
- Measure Everything 📊: You can’t improve what you don’t measure
- Use Structured Outputs 📦: JSON reduces ambiguity
- Separate Concerns 🎯: One evaluator per dimension
- Smooth Scores 📈: Account for evaluation noise
- Explain Decisions 💭: Chain-of-thought improves quality
- Automate Everything ⚙️: Manual evaluation doesn’t scale
- Monitor the Monitors 👀: Your evaluation system needs monitoring too
⚠️ Common Pitfalls to Avoid
🚫 Pitfall 1: Over-Engineering
Don’t create 20 different evaluation dimensions. Start with 2–3 core metrics (completion score, prompt adherence) and expand only when needed.
🚫 Pitfall 2: Ignoring False Positives
If your evaluation system alerts too frequently, you’ll start ignoring it. Tune thresholds based on real incidents, not theoretical concerns.
🚫 Pitfall 3: Not Monitoring Evaluations
Your LLM judge can degrade too 📉. Monitor evaluation scores over time and retrain or adjust prompts as needed.
🚫 Pitfall 4: Using Float Scores
Stick to integer scales (1–5) with clear rubrics. Float scores add false precision.
🚫 Pitfall 5: Evaluating Everything
Not every output needs evaluation. Focus on critical paths and user-facing features 🎯.
🔮 The Future of AI Evaluation
As AI systems become more prevalent 🤖, evaluation will become even more critical. Based on my research and observations, I’m seeing trends toward:
- Automated evaluation pipelines ⚙️: CI/CD for AI systems
- Multi-model evaluation 🎯: Using multiple judges and aggregating results
- Human-in-the-loop 👥: Combining automated and human evaluation
- Real-time evaluation ⚡: Evaluating outputs as they’re generated
- Evaluation marketplaces 🛒: Sharing and reusing evaluation templates
🎉 Conclusion
Catching my AI agent misbehaving wasn’t luck 🍀 — it was the result of systematic evaluation and monitoring 📊. As a student passionate about building reliable AI systems, this experience taught me that proper evaluation isn’t optional — it’s essential.
By implementing LLM-as-judge evaluation with the strategies I’ve outlined, you can:
- Catch issues early ⚡: Before they impact users
- Maintain quality ✅: Ensure your AI systems perform as intended
- Build trust 🤝: Demonstrate that you’re monitoring and improving your AI
- Scale confidently 🚀: Know that your evaluation system will catch problems
The incident I caught was subtle — a valid output that just wasn’t quite right. Without proper evaluation, it would have gone unnoticed, slowly degrading the value of my agent over time 📉.
But I did catch it ✅. And that’s the difference between reactive and proactive AI management 🎯. As someone building AI systems, whether for research or production, this kind of early detection is invaluable.
🚀 Next Steps
If you’re ready to implement LLM-as-judge evaluation in your own projects (whether for research, coursework, or personal projects):
- Start small 🎯: Pick one critical AI feature to evaluate
- Set up telemetry 📡: Use OpenTelemetry to collect traces
- Create evaluation templates 📝: Start with completion score and prompt adherence
- Build the pipeline 🔧: Connect your traces to an evaluation engine
- Monitor and iterate 📊: Tune your evaluations based on real incidents
📚 Resources
- Full Code Repository 💻: https://github.com/MahendraMedapati27/ai-agent-monitoring-llm-judge — Complete implementation with all code examples, Streamlit dashboard, and evaluation templates
- Groq Console 🚀: https://console.groq.com/ — Get your API key and explore Groq’s fast inference platform
- OpenTelemetry Documentation 📡: https://opentelemetry.io/docs/
- G-Eval Paper 📄: Liu et al., “G-Eval: NLG Evaluation using GPT-4 with Better Human Alignment”, EMNLP 2023
- LLM-as-Judge Survey 📊: Comprehensive survey on LLM-based evaluation methods
- Streamlit Dashboard 📈: Run
streamlit run streamlit_app/app.pyto explore interactive visualizations
🚀 Want to Master More AI?
Subscribe to my YouTube channel for in-depth tutorials, hands-on coding sessions, and the latest AI insights! 📺✨
👆 Hit that subscribe button and ring the notification bell to never miss cutting-edge content!
🔗 Let’s Connect & Collaborate!
I’m passionate about sharing knowledge and building amazing AI solutions. Let’s connect:
📱 Social Media & Professional Links
- 🐙 GitHub: @MahendraMedapati27 — Check out my latest projects and code repositories
- 💼 LinkedIn: Mahendra Medapati — Connect for professional discussions and industry insights
- 🐦 X (Twitter): @MahendraM27 — Follow for updates, thoughts, and discussions on AI
- 📧 Email: mahendramedapati.r469@gmail.com — Reach out directly for inquiries or collaboration
☕ Support This Work
If this guide helped you, consider supporting my work:

☕ **Buy me a coffee** — Your support helps me create more comprehensive guides like this!
Have you implemented LLM-as-judge evaluation in your projects? What challenges have you faced? As a student/researcher, I’d love to hear about your experiences and learn from what you’ve discovered! Share your thoughts in the comments below.
If you’re working on similar projects or have questions, feel free to reach out! I’m always happy to discuss AI evaluation methodologies and share what I’ve learned.
Tags: #AI #MachineLearning #LLM #Evaluation #Monitoring #OpenTelemetry #ProductionAI #MLOps
메타데이터
- post_id
- 6b74f48c4c9a
- slug
- the-day-i-caught-my-ai-agent-red-handed-building-production-grade-llm-evaluation-systems-that-6b74f48c4c9a
- url
- https://pub.towardsai.net/the-day-i-caught-my-ai-agent-red-handed-building-production-grade-llm-evaluation-systems-that-6b74f48c4c9a
- canonical_url
- https://pub.towardsai.net/the-day-i-caught-my-ai-agent-red-handed-building-production-grade-llm-evaluation-systems-that-6b74f48c4c9a
- author_url
- https://medium.com/@mahendramedapati
- status
- ok
- fetched_at
- 2026-07-10 03:02:36