SFMC Tips #199 : Introducing the SQL Query Activity Optimization Dashboard
With the Winter ’26 release of Marketing Cloud Engagement, a brand-new Optimization Dashboard has been introduced to help visualize and…
SFMC Tips #199 : Introducing the SQL Query Activity Optimization Dashboard
Photo by Nathan Dumlao on Unsplash
With the **Winter ’26 release of Marketing Cloud Engagement, a brand-new Optimization Dashboard has been introduced to help visualize and optimize the health of your SQL Query Activities**.
You can access this feature from the new “Optimizer” tab in Automation Studio.
The dashboard allows you to analyze data from the current day and select a time range within the past week using a calendar interface.
It displays the average execution time for the selected period and classifies each activity into one of the following three categories:
🟥 Action Needed 🟨 Pay Attention 🟩 Looking Good
Even if the average execution time is under one minute, some activities may still be flagged as “Pay Attention”, indicating that the evaluation criteria are relatively strict. However, since optimal performance benchmarks can vary depending on your environment and data volume, it’s recommended to review and adjust based on your own setup.
According to Salesforce’s guidance, any query taking more than 10 minutes to execute should be optimized. Alongside this release, the **SQL optimization help documentation** has also been updated — definitely worth a read!
Considerations
There are several important points to note.
First, this feature records not only full automation runs but also individual activity executions and one-time automation runs. Previously, there was no way to track the completion status of single activity executions — so this addition can truly be considered a game changer.
However, keep in mind that execution time is not measured for single runs. As a result, average execution time is not calculated, and while you can see the start time, the end time remains unavailable.
Also, even if a query appears in the list, it only indicates that the process has finished — it doesn’t necessarily mean it succeeded. Errors may still be present. When reviewing results, select the query name from the list and check that the execution count and success count exist, and that the success rate is 100%. As shown in the image below, if an activity was executed but the success rate is 0%, the single execution has failed.
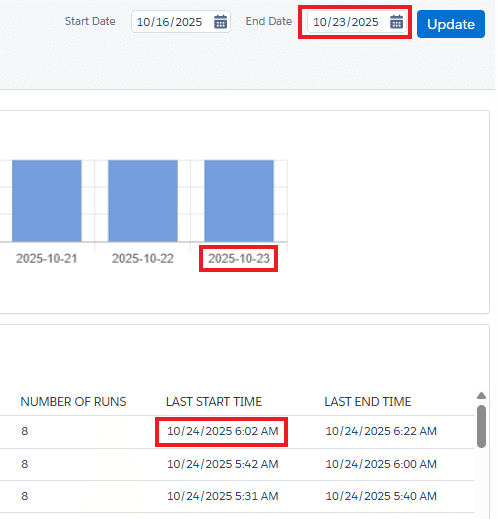
Next, pay attention to timezone differences. The execution times displayed in the list at the bottom of the screen follow your account’s timezone, while the charts and date filters at the top of the page use Central Standard Time (CST). As shown in the image below, this can cause discrepancies. For Japan, which is 15 hours ahead of CST, any runs executed before 3:00 PM JST are recorded as executions for the previous day. The final execution start and end times are displayed in JST.
Lastly, when you click each SQL name link, it doesn’t take you directly to the query content. Instead, you’ll see a performance risk score and a list of recommendations for improvement. You can use these as reference materials when refining your queries.

Conclusion
What did you think? As introduced here, a powerful new feature has been added that allows you to easily visualize the execution status of each SQL query. However, some queries currently don’t display execution times, and the underlying logic for this behavior remains unclear. I plan to continue investigating this in more detail.
Meanwhile, by using the query I previously shared — simply replace the Automation Name and run it in Query Studio — you can check the execution time for automations executed on the current day. Feel free to make use of it!
SELECT TOP 10000
    AutomationName COLLATE japanese_cs_as_ks_ws AS [AutomationName],
    ActivityName COLLATE japanese_cs_as_ks_ws AS [ActivityName],
    ActivityInstanceStep,
    CONVERT(VARCHAR(19), DATEADD(HH, 9, ActivityInstanceStartTime_UTC), 120) AS [ActivityInstanceStartTime],
    CONVERT(VARCHAR(19), DATEADD(HH, 9, ActivityInstanceEndTime_UTC), 120) AS [ActivityInstanceEndTime],
    FORMAT(DATEDIFF(S, ActivityInstanceStartTime_UTC, ActivityInstanceEndTime_UTC) / 60, '00') + ':' +
    FORMAT(DATEDIFF(S, ActivityInstanceStartTime_UTC, ActivityInstanceEndTime_UTC) % 60, '00') AS [Duration]
FROM
    _automationactivityinstance
WHERE
    AutomationName = 'XXXXXXXXXXXXXXX'
    AND DATEADD(HH, 9, ActivityInstanceStartTime_UTC) >= CONVERT(DATE, DATEADD(HH, 15, GETDATE()), 111)
ORDER BY
    CONVERT(DECIMAL, ActivityInstanceStep) ASC,
DATEDIFF(S, ActivityInstanceStartTime_UTC, ActivityInstanceEndTime_UTC) DESC- The sample query above retrieves data for today’s execution.
- The extracted dates (ActivityInstanceStartTime_UTC etc.) are in the UTC time zone, so you will need to adjust them for your country’s time zone. The current 9-hour adjustment is based on my country’s time zone, Japan.
- The Getdate() function extracts dates in the CST time zone, so you will need to adjust them for your country’s time zone. (In my country, Japan, there is a 15-hour time difference, so to extract the data as the previous day’s data, we need to subtract 9 hours.)
- The results will be sorted by step order. Within the same step, activities will be sorted in descending order of processing time (Duration).
That’s all for this time.
Stay tuned for more Salesforce Marketing Cloud tips! 😎
Nobuyuki Watanabe
https://www.linkedin.com/in/nobuyuki-watanabe/ (+Follow me)
메타데이터
- post_id
- 6bd616d2c1e7
- slug
- introducing-the-sql-query-activity-optimization-dashboard-6bd616d2c1e7
- url
- https://medium.com/@marketingcloudtips/introducing-the-sql-query-activity-optimization-dashboard-6bd616d2c1e7
- canonical_url
- https://medium.com/@marketingcloudtips/introducing-the-sql-query-activity-optimization-dashboard-6bd616d2c1e7
- author_url
- https://medium.com/@marketingcloudtips
- status
- ok
- fetched_at
- 2026-07-28 06:17:56