Equal Opportunity Under the Microscope: Why Fairness Evaluation Needs Risk Awareness
We dive into whether and how forcing equal outcomes in healthcare algorithms can overlook the reality of baseline risk and demographic…
Equal Opportunity Under the Microscope: Why Fairness Evaluation Needs Risk Awareness
We dive into whether and how forcing equal outcomes in healthcare algorithms can overlook the reality of baseline risk and demographic diversity.
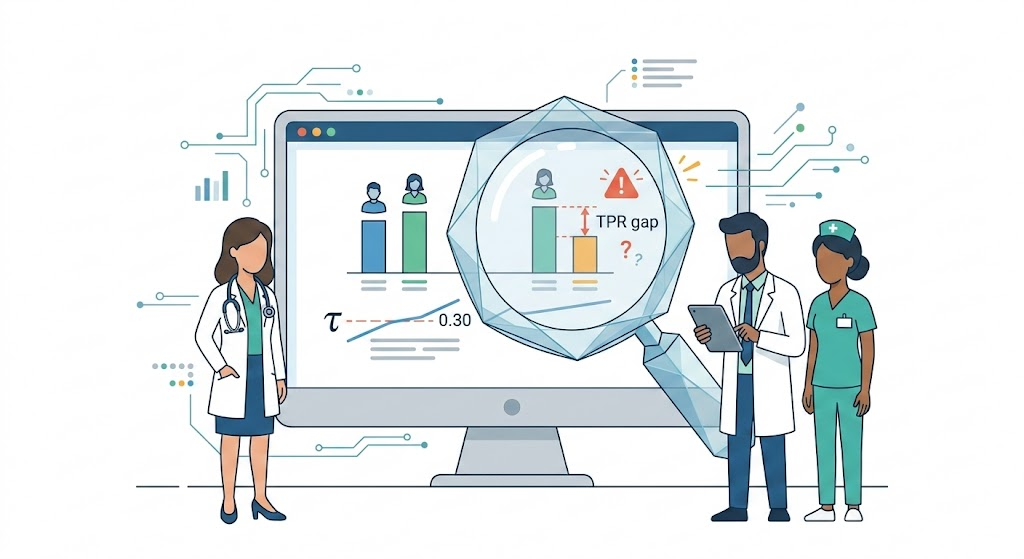
Clipart generated by Google NanoBanana 2
Disclaimer: This is a “math-light” rewrite of the original technical post. For those interested in the underlying math slightly more formally, check out the original article here.
A Familiar Result — and an Uncomfortable Question
Imagine a healthcare data team reviewing an AI model. This model predicts mortality risk to help doctors decide which patients should receive palliative care consultations. It’s been running for months, and now it’s time for a “fairness check.”
The team looks at the True Positive Rate (TPR) — essentially, the model’s “hit rate.” They want to know: of all the patients who actually passed away, what percentage did the model correctly identify as “high risk” beforehand?
The results come in: the model has a lower hit rate for women than for men.
Under the standard Equal Opportunity rule, this looks like a red flag. The logic is simple: if two people are going to face the same outcome (in this case, death), the model should be equally likely to flag them both for help. Because the model is “missing” more women, the team immediately considers “fixing” it — perhaps by lowering the risk threshold for women or retraining the algorithm.
But before they hit the panic button, they should pause.
When they look closer, they notice something: the men in this specific patient group generally have higher baseline health risks than the women. Their risk scores are clustered right around the “decision line,” while the women’s scores are clustered much lower.
This raises a difficult question: Is the model biased against women, or is the “fairness metric” simply reflecting the fact that these two groups have different baseline health profiles?
Evaluation vs. Mitigation: Don’t Fix What Isn’t Broken
In the world of AI ethics, we spend a lot of time trying to fix models (mitigation). We spend much less time asking if our yardsticks (evaluation) are accurate.
When we see a gap in performance between groups, we usually blame “algorithmic bias.” But these metrics don’t exist in a vacuum. They are a combination of two very different things:
- Model Behavior: How the algorithm treats people with the same level of risk.
- Population Reality: The actual differences in health, environment, and social factors between groups.
If we don’t separate these two, we might try to “fix” a model that is actually acting perfectly logically, potentially creating new errors in the process.
The “Equal Opportunity” Trap
In clinical settings, “Equal Opportunity” sounds like the ultimate ethical goal. We want to ensure that “similarly deserving” patients aren’t overlooked.
However, the statistical side of this goal is tricky. To calculate a “hit rate” (TPR), you have to set a cutoff point (a threshold). Anyone above that line gets help; anyone below it doesn’t.
The problem? If Group A has many more high-risk individuals than Group B, the “hit rate” will naturally look different for each group, even if the model is judging every single individual’s risk with 100% accuracy.
Inequality is Not Always Bias
In a perfect world, every demographic group would have the same health outcomes. In reality, risk is shaped by factors the model didn’t create:
- Genetic markers more common in certain ancestries.
- Different levels of exposure to environmental toxins (like smog or lead).
- Disparities in access to nutritious food or chronic stress levels.
These “baseline risks” exist before the patient even walks into the clinic. If Group A and Group B have different “risk shapes,” then a single “hit rate” metric will conflate the model’s performance with the population’s existing inequality.
What is “True Risk” Anyway?
We often talk about “True Risk” as if it’s a fixed number stamped on a person’s forehead. It isn’t. Risk is a probability based on the information we have.
Think of it this way:
- Your risk of a heart attack based on just your age.
- Your risk of a heart attack based on your age and your cholesterol.
Both are “true” given the data provided, but they give different answers. In AI evaluation, we use Calibrated Risk — the probability of an outcome based on the specific scores the model produces.
Fairness evaluation should be about one thing: Does the model treat people with the same level of risk the same way?
Decomposing the Problem
When we look at a “hit rate” (TPR), we are actually looking at a blend of three ingredients:
- The Risk Score: The probability the model assigns.
- The Risk Profile: How those probabilities are spread out across a specific group (e.g., are most people low-risk or high-risk?).
- The Cutoff: The line we draw to decide who gets treated.
Current fairness checks usually just look at the final “blend.” They don’t tell us if the gap is because the model is “bad” at predicting for a certain group, or if that group simply has a different distribution of risk.
A New Way Forward: Equal Treatment for Equal Risk
We need to change the question we ask during AI audits. Instead of asking:
“Are the hit rates equal for everyone?”
We should ask:
“Among people who have the exact same level of risk, does the model give them the same chance of being flagged for help?”
This shift — from Unconditional Parity to Conditional Parity — allows us to respect the reality of population differences while still holding the algorithm accountable for any actual bias in how it processes information.
If the “hit rate” is different simply because one group is healthier than the other, that’s a public health reality, not necessarily an algorithmic failure.
So, how do we actually measure this without getting lost in the weeds? In the next article, I’ll introduce a “risk-standardized” approach that allows us to strip away population differences and see how the model is really performing.
Acknowledgment This series is based on research by Hegarty et al. (2025) regarding risk distribution differences in algorithm fairness. While I collaborate with the authors on related projects, the perspectives here are my own.
메타데이터
- post_id
- 6bf6036189f2
- slug
- equal-opportunity-under-the-microscope-why-fairness-evaluation-needs-risk-awareness-6bf6036189f2
- url
- https://medium.com/@saehwanpark/equal-opportunity-under-the-microscope-why-fairness-evaluation-needs-risk-awareness-6bf6036189f2
- canonical_url
- https://medium.com/@saehwanpark/equal-opportunity-under-the-microscope-why-fairness-evaluation-needs-risk-awareness-6bf6036189f2
- author_url
- https://medium.com/@saehwanpark
- status
- ok
- fetched_at
- 2026-07-10 08:43:10






