K Nearest Neighbors (K-NN) with numpy
The cluster of ML algorithms returned K-NN as the simplest one
K Nearest Neighbors (K-NN) with numpy
The cluster of ML algorithms returned K-NN as the simplest one
K-NN is arguably the simplest machine learning algorithm used for classification and regression. Building the model consists of only storing the training dataset thus reducing the training time. Here we will understand how to use KNN for classification. We will implement KNN with numpy on Seattle Rain Data Set from kaggle. It is a binary classification with True and False labels.
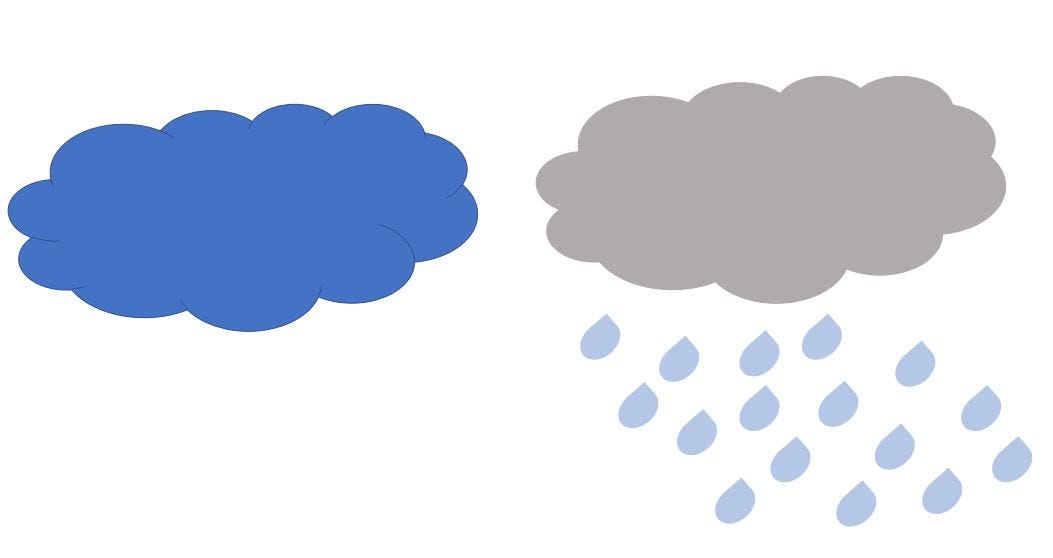
Fig. 1. Did it Rain?
Step 1: Import the libraries
import pandas as pd
import numpy as np
from collections import Counter
from sklearn.model_selection import train_test_split
from sklearn.metrics import classification_report, accuracy_score
Step 2: Read the data and pre-processing
Fig. 2. Photo by Franki Chamaki on Unsplash
#Read the csv in the form of a dataframe
df= pd.read_csv("data.csv")
df.head()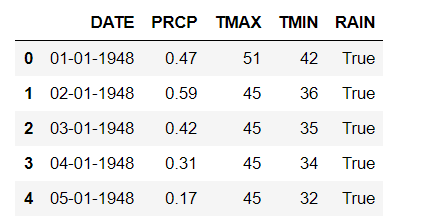
Fig. 3. Take a glance of the data
#Removing the null values
df.dropna(axis=0, inplace=True)
#Reset the index to avoid error
df.reset_index(drop=True, inplace=True)
y = df['RAIN'].replace([False,True],[0,1])
#Removing Date feature and Rain because it is our label
df.drop(['RAIN','DATE'],axis=1,inplace=True) 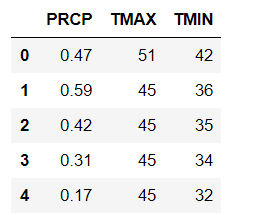
Fig. 4. Training data after pre-processing
#Splitting the data to train(75%) and test(25%)
x_train,x_test,y_train,y_test=train_test_split(df,y,test_size=0.25)
Step 3: Implementing Euclidean distance to find the nearest neighbor
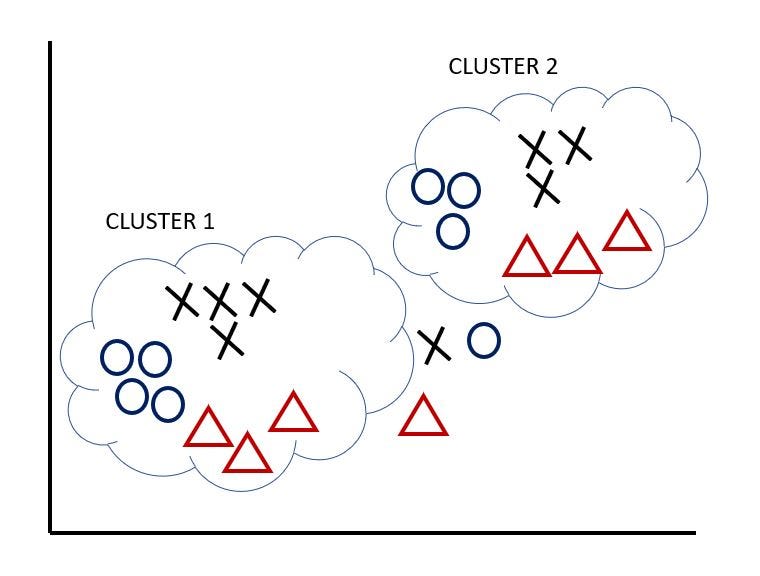
Fig. 5. Classifying the data in two clusters
Let’s try to understand Fig. 5 first, we have three features in two clusters, similar to our Seattle Rainfall data. Lets assume cluster 1 to be of data points when it did not rain and cluster 2 to be of data points when it did rain. The first two clusters can be thought of as our training data. The three data point outside the two clusters are the testing data for which we have to find the label.
Now, we will use Euclidean Distance to calculate the distance between the training data and the testing data. We can also use different methods to calculate distance like Manhatten Distance, Minkowski Distance etc.
Euclidean Distance:- It is used to find the straight line distance between two points.
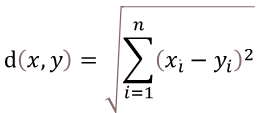
Euclidean Distance between x and y
Since, KNN is non-parametric i.e. it does not make any assumptions about the probability distribution of the input, we find the distance of test data points from the training data and the data points which are near to the test data are considered for classifying our test data. Let’s see this with the help of an image:-
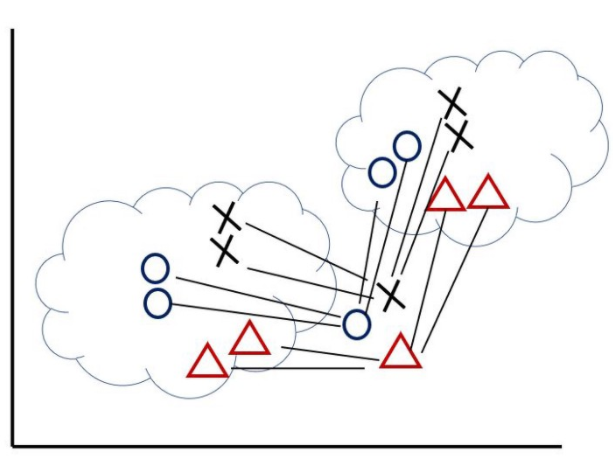
Fig. 6. Calculating Euclidean distance between training and test data
We see that in the image we have 5 data points per feature, 2 classified in one cluster, 2 classified in other cluster and 1 not yet labelled. Once we calculate the euclidean distance between these data points we can classify the cluster where this would lie.
The K in KNN signifies the count which we have to consider, lets say K is provided 5, in this case it will consider top 5 shortest distances after which the class with more frequency will be considered as the class of the test data.
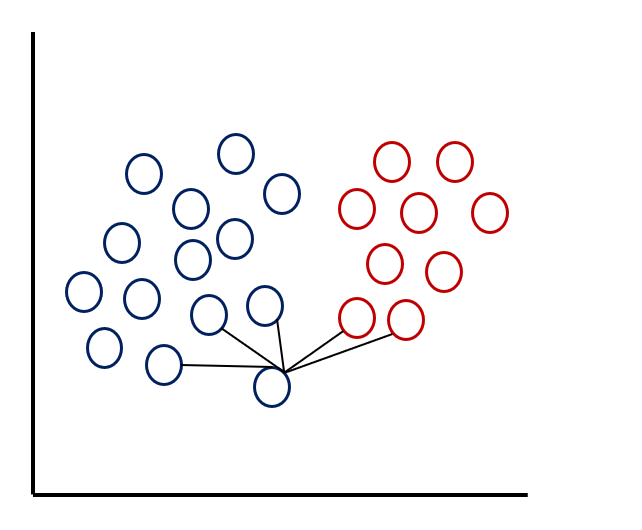
Fig. 7. Nearest neighbors when k is 5
To understand the purpose of K we have taken only one independent variable as shown in Fig. 7 with 2 labels, i.e binary classification and after calculating the distances we have marked 5 nearest neighbors as K is assigned a value of 5. Now as we can see the frequency (3 for blue and 2 for red) of label in color blue is higher than for color red, we will label the test data point as blue. Finding out the value of K is a task in K-NN as it may require multiple iterations by trying different values and evaluating the model based on those values.
def KNN(x,y,k):
    dist = []
    #Computing Euclidean distance
    dist_ind = np.sqrt(np.sum((x-y)**2, axis=1))
    #Concatinating the label with the distance
    main_arr = np.column_stack((train_label,dist_ind))
    #Sorting the distance in ascending order
    main = main_arr[main_arr[:,1].argsort()]
    #Calculating the frequency of the labels based on value of K
    count = Counter(main[0:k,0])
    keys, vals = list(count.keys()), list(count.values())
    if len(vals)>1:
        if vals[0]>vals[1]:
            return int(keys[0])
        else:
            return int(keys[1])
    else:
        return int(keys[0])
Step 4: Calculating the accuracy and classification report
print(classification_report(pred,train_label))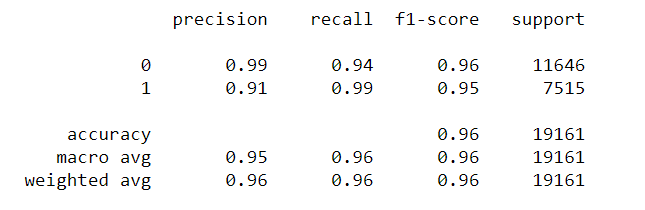
Fig. 8. Classification report with training data
print(classification_report(pred,test_label))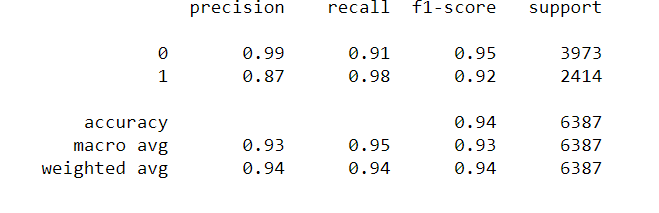
Fig. 9. Classification report for test data
Well we have achieved 96% in training data and 94% in test data, not bad!
When to apply KNN with Euclidean Distance
Fig. 10. Photo by Júnior Ferreira on Unsplash
A question very common, when to apply which algorithm?
Well, the answer is not pretty simple, but it is dependent on the data and task we have at hand, as for KNN with Euclidean distance we can hope to get better results when we have structured data with continuous data type. Again this is a hypothesis which we can prove with multiple implementations of the model.
References Used: -
Code available on Github: -
메타데이터
- post_id
- 6c52cbe28093
- slug
- k-nearest-neighbors-k-nn-with-numpy-6c52cbe28093
- url
- https://medium.com/analytics-vidhya/k-nearest-neighbors-k-nn-with-numpy-6c52cbe28093
- canonical_url
- https://medium.com/analytics-vidhya/k-nearest-neighbors-k-nn-with-numpy-6c52cbe28093
- author_url
- https://medium.com/@akshit527
- status
- ok
- fetched_at
- 2026-07-28 19:00:09