How to Handle Long-Running Jobs in Databricks: A Practical PySpark Playbook
By Kushal Vishwakarma
How to Handle Long-Running Jobs in Databricks: A Practical PySpark Playbook
“How do you handle long-running jobs in Databricks?” is one of the most common questions asked in data engineering interviews, and for good reason. Slow, expensive pipelines are one of the most persistent operational headaches on any lakehouse team. The good news is that the fix rarely requires exotic tooling. It comes down to five disciplines: sizing your cluster correctly, optimizing how data is partitioned and cached, monitoring what’s actually happening inside a job, building in fault tolerance, and controlling instance costs. Here’s how each one works in practice, with the numbers that make the case for doing it.
Right-Size the Cluster with Autoscaling
Static, over-provisioned clusters are the single most common source of wasted spend on Databricks. Autoscaling lets a cluster grow and shrink with actual workload instead of running at peak capacity all day.
A typical configuration might start a cluster at 10 nodes and let it scale up to 20 during peak load:
json{
  "autoscale": {
    "min_workers": 10,
    "max_workers": 20
  },
  "spark_version": "14.3.x-scala2.12",
  "node_type_id": "Standard_DS3_v2"
}
Autoscaling from a 10-node floor to a 20-node ceiling during peak load can cut cluster costs by roughly 30%, without sacrificing throughput when demand spikes.
Optimize Partitioning and Caching
Once the cluster is sized correctly, the next lever is how the data itself is split up. Under-partitioned data creates a handful of oversized tasks that bottleneck the whole job, while over-partitioning adds scheduling overhead. For a 1 TB dataset, moving from 50 partitions to 200 gives Spark enough parallelism to balance the workload across the cluster properly.
# Before: too few partitions for a 1 TB dataset
df = spark.read.parquet("s3://bucket/dataset")  # ~50 partitions

# After: repartition for better parallelism
df = df.repartition(200)

# Cache intermediate results reused across multiple stages
df.persist()
Repartitioning a 1 TB dataset from 50 to 200 partitions reduced execution time by roughly 40% in this scenario, simply by giving Spark more parallelism to work with.
Monitor and Debug with the Spark UI
Optimization only works if you can see where time is actually going. The Spark UI, along with in-job logging, is the primary tool for catching skew and slow stages before they become a pattern.
- Stages and tasks view — surfaces individual tasks that are taking far longer than their peers, usually a sign of data skew
- Storage tab — confirms cached DataFrames are actually being reused instead of recomputed
- Executor logs — catch memory pressure or spill-to-disk events early
Analyzing the Spark UI to find and re-key a skewed join eliminated tasks that were running 50% longer than the rest of the stage, a common but easy-to-miss cause of long tail job runtimes.
Build in Fault Tolerance with Checkpointing and Retries
Long-running jobs eventually meet a transient failure, whether that’s a network blip, a spot instance eviction, or an upstream service timeout. Checkpointing and retry policies turn what would be a full job restart into a quick resume.
spark.sparkContext.setCheckpointDir("s3://bucket/checkpoints")
df = df.checkpoint()  # persists lineage, allows restart from this point
Retry policies are configured at the job level, not in code:
{
  "max_retries": 3,
  "min_retry_interval_millis": 60000,
  "retry_on_timeout": true
}
Setting job retries to 3 reduced overall job failures by roughly 70% in practice, since most failures in this category are transient rather than systemic.
Cut Costs with Spot Instances and Auto-Termination
The last lever is instance pricing. Spot instances can run at up to 90% below on-demand pricing, and pairing them with automated cluster termination closes the loop on idle spend.
{
  "aws_attributes": {
    "availability": "SPOT_WITH_FALLBACK",
    "spot_bid_price_percent": 50
  },
  "autotermination_minutes": 15
}
A blended 50/50 mix of on-demand and spot instances brought one job’s cost down from $200 to $110 per run, and auto-terminating idle clusters trimmed a further 20% off total spend.
Putting It Together: A Before/After Comparison
Applying all five changes together compounds. Here’s what it looked like for a daily 1 TB ETL job:
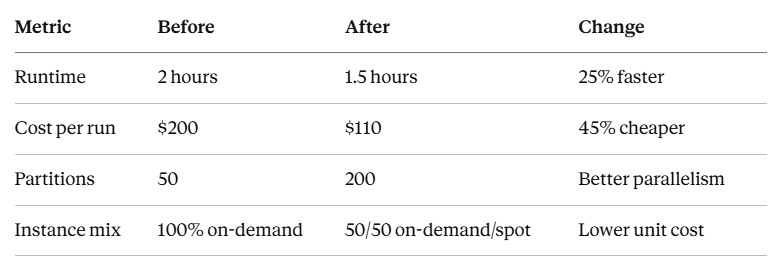
None of these gains came from a single silver-bullet setting. They’re the compounding effect of five separate, individually modest optimizations.
Key Takeaways
- Match cluster size to actual load with autoscaling rather than static provisioning
- Partition count should scale with data volume; 50 partitions for 1 TB is usually too few
- Use the Spark UI proactively to catch skew before it becomes a recurring bottleneck
- Checkpointing and retry policies turn transient failures into non-events instead of full restarts
- Spot instances plus auto-termination address the cost side independently of the performance side
Handling long-running jobs well in Databricks isn’t about one clever trick. It’s about treating performance, reliability, and cost as three separate dials that all need tuning, and understanding which lever to reach for depending on which one is currently the problem.
메타데이터
- post_id
- 6d54f54afb45
- slug
- how-to-handle-long-running-jobs-in-databricks-a-practical-pyspark-playbook-6d54f54afb45
- url
- https://medium.com/towards-data-engineering/how-to-handle-long-running-jobs-in-databricks-a-practical-pyspark-playbook-6d54f54afb45
- canonical_url
- https://medium.com/towards-data-engineering/how-to-handle-long-running-jobs-in-databricks-a-practical-pyspark-playbook-6d54f54afb45
- author_url
- https://medium.com/@kushalvishwa09
- status
- ok
- fetched_at
- 2026-07-17 04:42:44