Datadog: The Unified Monitoring Platform Modern Teams Rely On
In my day-to-day work, I regularly use Datadog to monitor application performance, investigate issues, and understand system behavior when…
Datadog: The Unified Monitoring Platform Modern Teams Rely On
In my day-to-day work, I regularly use Datadog to monitor application performance, investigate issues, and understand system behavior when problems occur. Working with applications in real environments made me realize how important visibility is for maintaining reliability and troubleshooting efficiently. Because of that experience, I thought it would be useful to write an article about Datadog and explain why it has become such a valuable tool in modern technology environments.
In modern software systems, applications are no longer confined to a single server sitting in a data center. Organizations now run applications across cloud environments, containers, microservices, databases, APIs, and distributed infrastructures. While this improves scalability and flexibility, it also creates a major challenge: visibility.
How do teams know what is happening across hundreds of services in real time?
This is where Datadog becomes important.
What is Datadog?
Datadog is a cloud-based monitoring and observability platform designed to help organizations monitor applications, infrastructure, logs, and services from a single place.
Instead of using multiple tools for servers, applications, performance metrics, and logs, Datadog brings everything together into a centralized platform.
The goal is simple: help teams detect problems faster, understand system behavior, and improve application reliability.
Why Monitoring Matters
Imagine an e-commerce application during a major sale event.
Customers start reporting slow page loading times. Some users cannot complete payments. Developers are checking application logs, system administrators are checking server performance, and database engineers are reviewing database activity.
Without a centralized monitoring solution, identifying the root cause can take a long time.
Monitoring platforms like Datadog help teams answer important questions quickly:
- Is CPU usage increasing?
- Is memory usage becoming a bottleneck?
- Which API is responding slowly?
- Are error rates increasing?
- Which service is causing failures?
Having these answers available in real time significantly reduces troubleshooting time.
Key Features of Datadog
1. Infrastructure Monitoring
Datadog collects metrics from servers, virtual machines, containers, cloud services, and network devices.
Teams can monitor:
- CPU usage
- Memory usage
- Disk performance
- Network traffic
- System health
This helps identify resource issues before they become major incidents.
2. Application Performance Monitoring (APM)
Application Performance Monitoring allows developers to analyze how applications behave internally.
Instead of only seeing that an application is slow, teams can determine:
- Which request is causing delays
- Which service is responsible
- Database query execution time
- External API latency
This visibility helps developers fix performance problems more efficiently.
3. Log Management
Logs contain valuable information about application behavior.
Datadog allows teams to:
- Collect logs from multiple systems
- Search and filter logs
- Correlate logs with metrics
- Detect unusual patterns
Rather than switching between tools, engineers can investigate issues from one platform.
4. Dashboards and Visualization
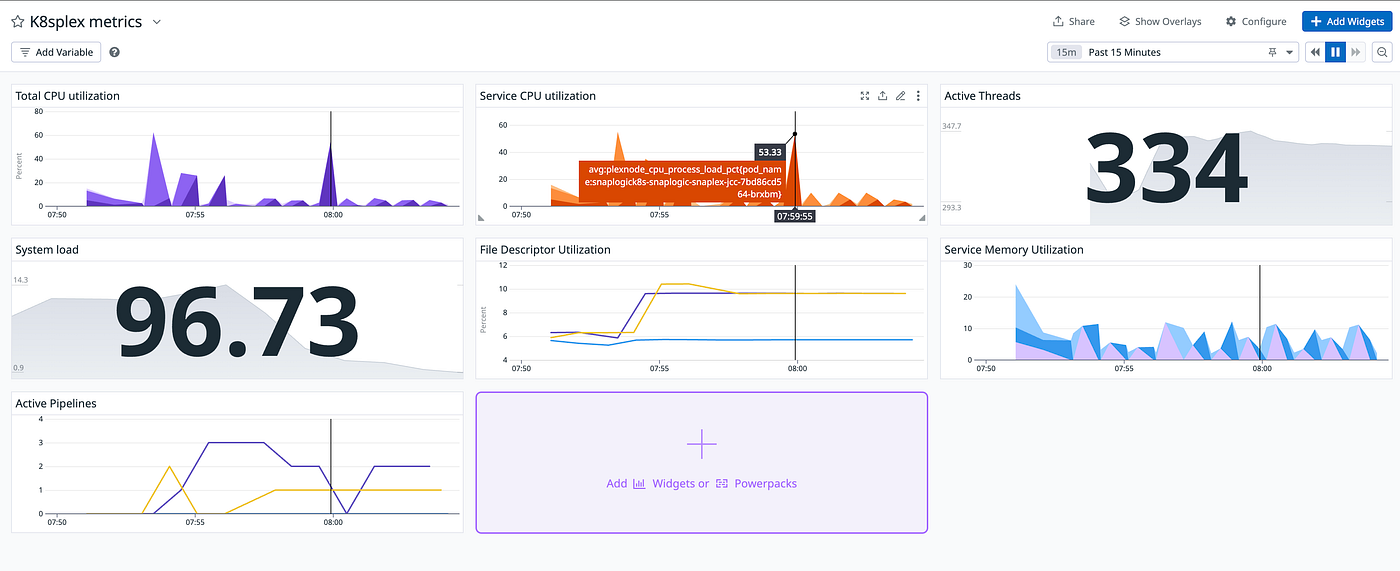
Datadog provides customizable dashboards where teams can visualize important metrics.
Examples include:
- Server health dashboards
- Application response time dashboards
- Database monitoring dashboards
- Business KPI dashboards
Visual dashboards make it easier for teams to understand system status at a glance.
5. Alerts and Incident Detection
Monitoring only becomes valuable when teams are notified at the right time.
Datadog supports alerts based on:
- Threshold conditions
- Anomaly detection
- Forecasting
- Service outages
Notifications can be sent through email, Slack, Microsoft Teams, and other communication platforms.
Common Integrations
One of Datadog’s biggest strengths is its large integration ecosystem.
Some commonly used integrations include:
- AWS
- Azure
- Google Cloud
- Docker
- Kubernetes
- MySQL
- PostgreSQL
- Nginx
- Jenkins
- GitHub
Organizations can often integrate services with minimal configuration.
Benefits of Using Datadog
Using Datadog provides several advantages:
- Faster issue detection
- Reduced downtime
- Improved application performance
- Better visibility across systems
- Simplified troubleshooting
- Enhanced collaboration among teams
For organizations running cloud-native applications, centralized observability becomes increasingly important.
Challenges and Considerations
Despite its strengths, Datadog also has considerations that teams should evaluate.
Cost can increase as organizations collect more metrics, logs, and traces. Large environments with heavy data usage may need careful planning.
Additionally, because Datadog offers many features, new users may require time to fully understand and utilize the platform effectively.
My Own Thoughts …
As systems continue becoming more distributed and complex, visibility becomes essential rather than optional.
Datadog helps organizations move from reactive troubleshooting toward proactive monitoring by giving teams a unified view of infrastructure and applications.
Whether you are a system administrator, developer, DevOps engineer, or application support engineer, understanding observability platforms like Datadog can become a valuable skill in modern technology environments.
Monitoring is no longer only about knowing when something breaks; it is about understanding why it happened and preventing similar issues in the future.
메타데이터
- post_id
- 6d6e2400a2f8
- slug
- datadog-the-unified-monitoring-platform-modern-teams-rely-on-6d6e2400a2f8
- url
- https://medium.com/@thavinduwrites/datadog-the-unified-monitoring-platform-modern-teams-rely-on-6d6e2400a2f8
- canonical_url
- https://medium.com/@thavinduwrites/datadog-the-unified-monitoring-platform-modern-teams-rely-on-6d6e2400a2f8
- author_url
- https://medium.com/@thavinduwrites
- status
- ok
- fetched_at
- 2026-07-16 09:36:51