Playwright Memory Leaks: Causes, Detection, Prevention, and Performance Optimization
As Playwright test suites grow from a few dozen tests to thousands running in parallel, one problem becomes increasingly common: memory…
Playwright Memory Leaks: Causes, Detection, Prevention, and Performance Optimization
As Playwright test suites grow from a few dozen tests to thousands running in parallel, one problem becomes increasingly common: memory leaks. They often start subtly — tests become slower, browsers consume more RAM, CI jobs fail intermittently, or machines eventually run out of memory.
Understanding why memory leaks happen and how to prevent them is essential for building stable, scalable automation frameworks.
This article continues the next topic in your Automation Engineering roadmap.
What Is a Memory Leak?
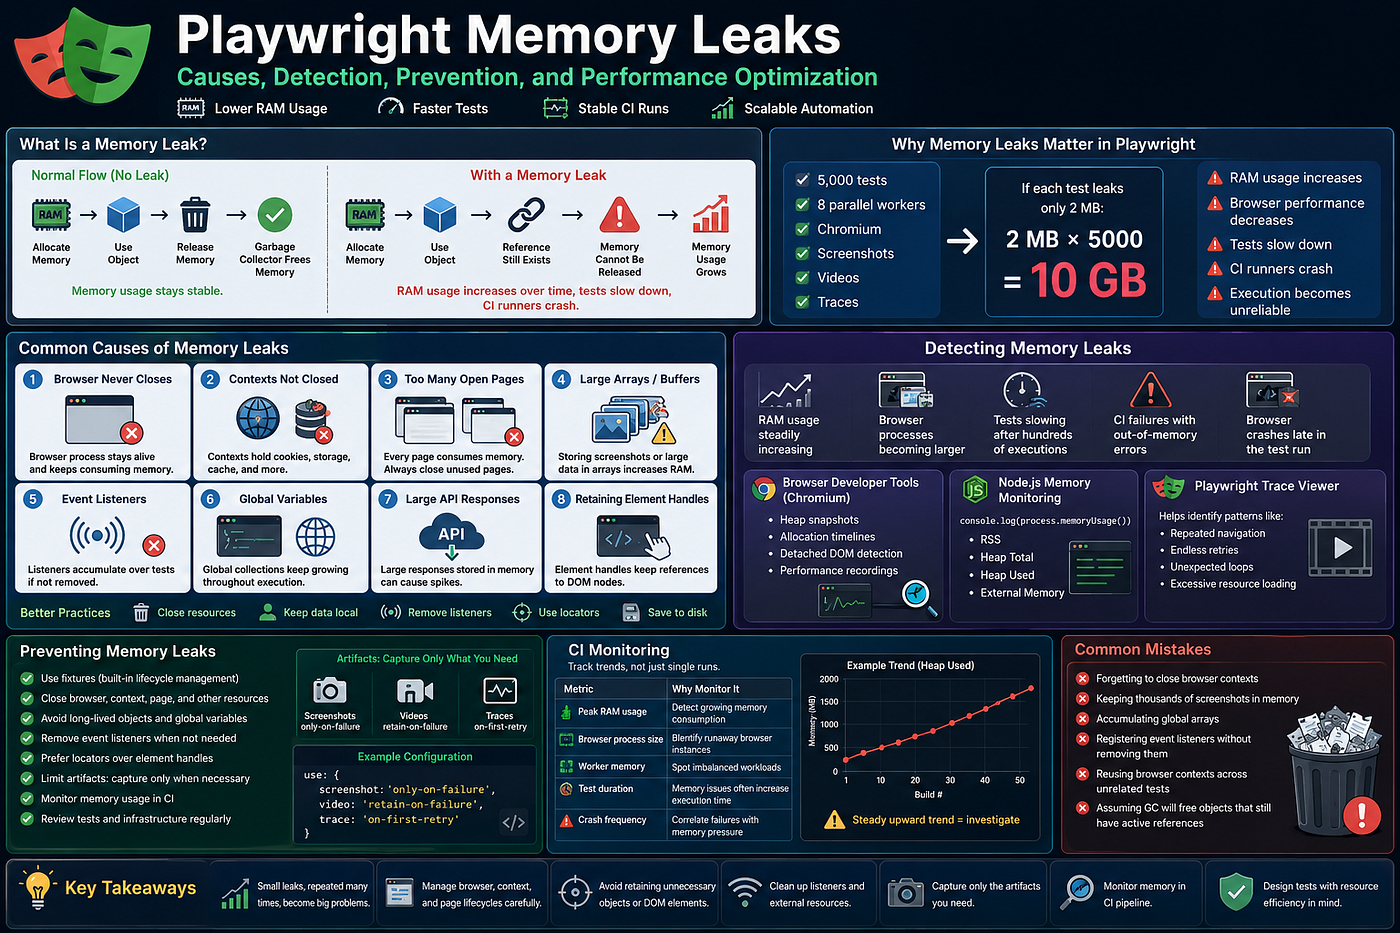
A memory leak occurs when memory that is no longer needed is not released.
Normally:
Allocate Memory

↓

Use Object

↓

Release Memory

↓

Garbage Collector Frees Memory
With a memory leak:
Allocate Memory

↓

Use Object

↓

Reference Still Exists

↓

Memory Cannot Be Released

↓

Memory Usage Grows
Over time:
- RAM usage increases
- Browser performance decreases
- Tests slow down
- CI runners crash
- Execution becomes unreliable
Why Memory Leaks Matter in Playwright
Imagine a suite with:
- 5,000 tests
- 8 parallel workers
- Chromium
- Screenshots
- Videos
- Traces
If each test leaks only 2 MB, that’s:
2 MB × 5000

=

10 GB
A small leak repeated thousands of times becomes a major infrastructure problem.
Where Memory Leaks Come From
Memory leaks can occur in:
- Your automation code
- Playwright usage patterns
- Browser contexts
- Application under test
- Third-party libraries
Finding the source is the first step toward fixing it.
Common Cause #1: Browser Never Closes
Bad:
const browser = await chromium.launch();

// Tests

// Forgot browser.close()
Every browser process remains alive, consuming memory.
Correct:
const browser = await chromium.launch();

try {

    // Tests

} finally {

    await browser.close();

}
Playwright Test manages browser lifecycle automatically when using built-in fixtures.
Common Cause #2: Contexts Not Closed
Each browser context has its own:
- Cookies
- Local storage
- Session storage
- Cache
- Memory
Bad:
const context = await browser.newContext();

const page = await context.newPage();

// Forgot context.close()
Correct:
await context.close();Closing a browser does not replace the need to close manually created contexts when you’re managing them yourself.
Common Cause #3: Too Many Open Pages
Bad:
for (let i = 0; i < 1000; i++) {

  await context.newPage();

}
Eventually:
Browser

├── Page 1

├── Page 2

├── Page 3

...

├── Page 1000
Every page consumes memory.
Always close pages that are no longer needed:
await page.close();Common Cause #4: Large Arrays
Sometimes the leak isn’t Playwright.
Example:
const screenshots = [];

for (...) {

   screenshots.push(await page.screenshot());

}
Each screenshot is stored in memory.
Better:
await page.screenshot({
    path: `screenshots/${Date.now()}.png`
});
Save to disk instead of accumulating large buffers in RAM.
Common Cause #5: Event Listeners
Bad:
page.on('response', handler);Repeated across many tests:
Page

↓

100 Listeners

↓

500 Listeners

↓

1000 Listeners
If listeners are never removed, memory usage increases.
Use:
page.off('response', handler);or register listeners only for the lifetime of the current test.
Common Cause #6: Global Variables
Avoid:
global.users.push(user);Global collections continue growing throughout execution.
Instead:
- Keep data local to the test.
- Use fixtures for lifecycle management.
- Clean up after each test.
Common Cause #7: Large API Responses
Example:
const response = await page.request.get(...);

const data = await response.json();
If the response is hundreds of megabytes and stored globally, memory usage spikes.
Process only what you need and release references once the data is no longer required.
Common Cause #8: Retaining Element Handles
Bad:
const buttons = [];

buttons.push(await page.$('button'));
Element handles maintain references to DOM nodes.
Prefer locators:
const button = page.getByRole('button');Locators resolve elements when needed and don’t keep long-lived references in the same way.
Detecting Memory Leaks
Symptoms include:
- RAM usage steadily increasing.
- Browser processes becoming larger over time.
- Tests slowing after hundreds of executions.
- CI failures with out-of-memory errors.
- Browser crashes late in the test run.
These patterns often indicate resources aren’t being released.
Using Browser Developer Tools
Chromium’s developer tools can help inspect memory.
Useful features include:
- Heap snapshots
- Allocation timelines
- Detached DOM node detection
- Performance recordings
Comparing snapshots before and after repeated actions can reveal objects that continue to accumulate.
Monitoring Node.js Memory
Node provides useful diagnostics.
Example:
console.log(process.memoryUsage());Typical output includes:
- RSS
- Heap Total
- Heap Used
- External Memory
If heapUsed continues increasing after tests complete, investigate retained references.
Playwright Trace Viewer
The Trace Viewer is primarily a debugging tool, but it also helps identify patterns such as:
- Repeated navigation
- Endless retries
- Unexpected loops
- Excessive resource loading
It won’t directly identify memory leaks, but it often provides clues about inefficient test behavior.
CI Monitoring
Track memory trends across builds.
Useful metrics include:
MetricWhy Monitor ItPeak RAM usageDetect growing memory consumptionBrowser process sizeIdentify runaway browser instancesWorker memorySpot imbalanced workloadsTest durationMemory issues often increase execution timeCrash frequencyCorrelate failures with memory pressure
Monitoring trends is often more valuable than looking at a single test run.
Preventing Memory Leaks
Use Fixtures
Instead of manually managing browsers:
test('Example', async ({ page }) => {});Built-in fixtures automatically create and dispose of resources.
Close Resources
Always close:
- Browser
- Context
- Page
- File handles
- Database connections
- Network connections
Treat cleanup as part of every resource’s lifecycle.
Avoid Long-Lived Objects
Instead of:
const allResponses = [];Process responses immediately and discard them when finished.
Remove Event Listeners
If you register custom listeners:
page.on(...)remember to remove them when they’re no longer needed.
Limit Artifacts
Generating screenshots, videos, and traces for every passing test consumes storage and can increase memory usage.
A common strategy is to capture them only on failures.
Example configuration:
use: {
    screenshot: 'only-on-failure',
    video: 'retain-on-failure',
    trace: 'on-first-retry'
}
This balances debugging capability with resource efficiency.
Enterprise Best Practices
For large Playwright suites:
- Use built-in fixtures whenever possible.
- Prefer locators over long-lived element handles.
- Keep test data local to individual tests.
- Monitor memory usage in CI.
- Close resources explicitly when managing them manually.
- Avoid storing large objects unnecessarily.
- Investigate gradual increases in execution time — they often indicate memory problems.
- Regularly review test infrastructure for resource leaks.
Common Mistakes
Avoid these patterns:
- Forgetting to close browser contexts.
- Keeping thousands of screenshots in memory.
- Accumulating global arrays.
- Registering event listeners without removing them.
- Reusing browser contexts across unrelated tests.
- Assuming the garbage collector can free objects that still have active references.
Interview Questions
1. What is a memory leak?
A memory leak occurs when allocated memory is no longer needed but cannot be reclaimed because references to it still exist.
2. Can Playwright itself cause memory leaks?
Yes, but many leaks originate from user code, such as unclosed browser contexts, retained references, or improperly managed resources.
3. Why are browser contexts important?
Each context maintains isolated browser state. Leaving contexts open increases memory consumption and can affect test stability.
4. Why are locators preferred over element handles?
Locators resolve elements when needed and avoid keeping long-lived references to DOM nodes, making tests more resilient and often more memory-efficient.
5. How can you detect memory leaks in a Playwright project?
Monitor memory usage over time, inspect heap snapshots, review browser process sizes, analyze CI metrics, and investigate steadily increasing RAM consumption during long test runs.
Key Takeaways
Memory leaks are rarely caused by a single catastrophic mistake. More often, they result from small inefficiencies repeated thousands of times. To keep large Playwright suites healthy:
- Manage browser, context, and page lifecycles carefully.
- Avoid retaining unnecessary references to objects or DOM elements.
- Clean up event listeners and external resources.
- Capture only the artifacts you need.
- Monitor memory usage as part of your CI pipeline.
- Design tests with resource efficiency in mind from the beginning.
By treating memory as a managed resource rather than an unlimited one, you can build Playwright frameworks that remain fast, stable, and scalable even under heavy parallel workloads.
메타데이터
- post_id
- 6dfaf2f6bcd0
- slug
- playwright-memory-leaks-causes-detection-prevention-and-performance-optimization-6dfaf2f6bcd0
- url
- https://medium.com/@umairqa/playwright-memory-leaks-causes-detection-prevention-and-performance-optimization-6dfaf2f6bcd0
- canonical_url
- https://medium.com/@umairqa/playwright-memory-leaks-causes-detection-prevention-and-performance-optimization-6dfaf2f6bcd0
- author_url
- https://medium.com/@umairqa
- status
- ok
- fetched_at
- 2026-07-24 19:13:54