Linear Regression from Scratch
Hi Everyone,
Linear Regression from Scratch
Hi Everyone,
This is my version of linear regression from scratch. This is my attempt to explain clearly the simplest ML algorithm in Python.
Based on the name, we can guess that the algorithm is trying to predict linear relationship between the input variables X and single output variable Y.
If X posses multiple variables it is Multiple Linear Regression.
Model Representation:
Dependent variable, Y
Y=β0+β1X
β1 is the coefficient and β0 is the bias coefficient.
The equation is similar to a line representation,
y=mx+b, where m=β1(Slope) and b=β0(Intercept)
We basically want to draw a line that estimates relationship between X and Y.
There are two ways to find the coefficients,
-
Ordinary Least Square Method
-
Gradient Descent Approach
In this tutorial, we only focus on the Ordinary Least Square Method
Ordinary Least Square Method
Lets say we have a few points and we want to plot the scatter points
You can see a line in the image. We want to minimize the error, having the least error. This can be found by reducing the error. The distance from the mean and the points is illustrated as follows.

The total error is the sum of all errors of each point can be summed as D,

The two coefficients B1 and B0 for minimizing the coefficients can be found as,

where x^ and y^ are the mean value of the output variable Y.
This can be implemented in python as,
import numpy as np
import pandas as pd
import matplotlib.pyplot as plt
plt.rcParams['figure.figsize'] = (20.0, 10.0)
# Reading Data
data = pd.read_csv('head.csv')
print(data.shape)
print data.head()
print data.info()(237, 4)The information panel of the pandas datapoint. We can see that there are four different headers depicting the distribution of the data

We go over all values in X and Y to find out the coefficients b1 and b0. We print the coefficients as the final possible answer.
mean_x = np.mean(x)
mean_y = np.mean(y)
m = len(x)# Using the formula to calculate b1 and b2
numerator = 0
denominator = 0for i in range(m):
numerator += (x[i] - mean_x) * (y[i] - mean_y)
denominator += (x[i] - mean_x) ** 2
b1 = numerator / denominator
b0 = mean_y - (b1 * mean_x)# Print coefficients
print(b1, b0)We then show this information through matplotlib scatterplots,
max_x = np.max(x) + 100
min_x = np.min(x) - 100
# Calculating line values x and y
x1 = np.linspace(min_x, max_x, 1000)
y1 = b0 + b1 * x1# Ploting Line
plt.plot(x1, y1, color='#58b970', label='Regression Line')
# Ploting Scatter Points
plt.scatter(x, y, c='#ef5423', label='Scatter Plot')plt.xlabel('Head Size in cm3')
plt.ylabel('Brain Weight in grams')
plt.legend()
plt.show()Voila! We can see the learned line from the distributions we just took an input from,

This model is not so bad. But we need to find how good is our model. There are many methods to evaluate models. We will use Root Mean Squared Error and Coefficient of Determination(R2 Score).
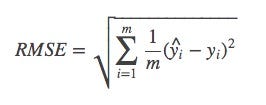
Root Mean Squared Error is the square root of sum of all errors divided by number of values, or Mathematically,
# Calculating Root Mean Squares Error
rmse = 0
for i in range(m):
y_pred = b0 + b1 * X[i]
rmse += (Y[i] - y_pred) ** 2
rmse = np.sqrt(rmse/m)print(rmse)72.1206213784
Root Mean Squared Error is the square root of sum of all errors divided by number of values, or Mathematically,
Now we will find R2 score. R2 is defined as follows,

SSt is the total sum of squares and SSr is the total sum of squares of residuals.
R2 Score usually range from 0 to 1. It will also become negative if the model is completely wrong. Now we will find R2R2 Score.
ss_t = 0
ss_r = 0
for i in range(m):
    y_pred = b0 + b1 * X[i]
    ss_t += (Y[i] - mean_y) ** 2
    ss_r += (Y[i] - y_pred) ** 2
r2 = 1 - (ss_r/ss_t)
print(r2)0.6393117199570.63 is ok. Now we have implemented Simple Linear Regression Model using Ordinary Least Square Method.
To know more about interpreting R2, please look,
https://github.com/sugeerth/LinearRegression
This post is inspired by Mubaris NK, https://mubaris.com/2017/09/28/linear-regression-from-scratch/.
메타데이터
- post_id
- 6f2e6dad76a0
- slug
- linear-regression-from-scratch-6f2e6dad76a0
- url
- https://medium.com/@sugeerth/linear-regression-from-scratch-6f2e6dad76a0
- canonical_url
- https://medium.com/@sugeerth/linear-regression-from-scratch-6f2e6dad76a0
- author_url
- https://medium.com/@sugeerth
- status
- ok
- fetched_at
- 2026-07-30 02:57:19






