Spring Boot Observability Stack (OpenTelemetry · Prometheus · Loki · Tempo · Grafana ·…
In the world of microservices, “it works on my machine” is rarely enough. When a request fails in production, you need to know exactly why…
Spring Boot Observability Stack (OpenTelemetry · Prometheus · Loki · Tempo · Grafana · Alertmanager)

In the world of microservices, “it works on my machine” is rarely enough. When a request fails in production, you need to know exactly why it failed, where the latency spiked, and which logs correlate to that specific error. This capability is called Observability.
This guide introduces a monitoring stack for Spring Boot services that solves these problems. It uses the OpenTelemetry Java Agent for 100% automatic instrumentation, connecting logs, metrics, and traces into a single “pane of glass” using the Grafana LGTM stack (Loki, Grafana, Tempo, Prometheus) and provides ready-to-use dashboards and alerting.
Components Overview
OpenTelemetry (OTel)
Universal observability instrumentation framework
- What it is: An open-source, vendor-neutral standard for collecting telemetry data (traces, metrics, logs) from applications.
- How we use it: The OpenTelemetry Java agent (opentelemetry-javaagent.jar) auto-instruments Spring Boot applications without any code changes
- What it does in this project:
- Traces: Automatically captures HTTP requests, database calls, and cross-service communication. Creates spans showing request flow from service-1 → service-2
- Context Propagation: Injects traceId and spanId into logs (via MDC) and HTTP headers (W3C Trace Context) so you can correlate logs ↔ traces
- Distributed Tracing: Propagates trace context across services using tracecontext and baggage propagators
- Export: Sends traces to Tempo via OTLP (OpenTelemetry Protocol) over gRPC on port 4317
- Why it’s important: OTel is the glue that connects your application code to the observability backends. Without it, you’d need to manually instrument every endpoint.
Key Benefits:
- ✅ Zero code changes required (auto-instrumentation)
- ✅ Vendor-neutral (works with Tempo, Jaeger, Zipkin, Datadog, etc.)
- ✅ Standardized trace context propagation (W3C Trace Context)
- ✅ Automatic correlation of logs and traces via traceId/spanId injection
Prometheus
Time-series metrics database and alert evaluator
- Scrapes metrics from services every 15 seconds (via /actuator/prometheus)
- Stores metrics in a local time-series database
- Evaluates alert rules defined in alert_rules.yml (e.g., service down, error rate > 5%)
- Forwards firing alerts to Alertmanager
Alertmanager
Alert routing, grouping, and notification delivery
- Receives firing alerts from Prometheus
- Groups similar alerts together (by alertname)
- Prevents duplicate notifications (deduplication)
- Routes alerts to receivers (email, Slack, PagerDuty, etc.)
Grafana
Unified visualization and exploration UI
- Connects to multiple datasources: Prometheus, Loki, Tempo, Alertmanager
- Provides pre-built dashboards (JVM Metrics, HTTP Metrics)
Loki
Log aggregation system
- Stores logs with indexed labels (service, level, traceId, etc.)
- Does NOT index the full log text (only labels) — keeps storage costs low
- Queried with LogQL
Promtail
Log shipper and parser
- Tails log files on disk (service-1.log, service-2.log)
- Parses JSON entries and extracts structured fields
- Attaches labels to each log line and pushes to Loki
Tempo
Distributed tracing backend
- Receives traces from the OpenTelemetry Java agent via OTLP gRPC (port 4317)
- Stores complete span data
- Shows request flow across multiple services
Data Flow Diagram
┌─────────────────────────────────────────────────────────────────────────┐
│                          HOST MACHINE                                    │
│                                                                          │
│  ┌──────────────┐                    ┌──────────────┐                  │
│  │  service-1   │                    │  service-2   │                  │
│  │   :8081      │──── HTTP call ────▶│   :8082      │                  │
│  └──────┬───────┘                    └──────┬───────┘                  │
│         │                                    │                           │
│         │ OTel Java Agent                    │ OTel Java Agent          │
│         │ (auto-instrument)                  │ (auto-instrument)        │
│         │                                    │                           │
│         ├─── Traces (OTLP gRPC) ────────────┼────────┐                 │
│         │                                    │        │                  │
│         ├─── Metrics (Actuator) ────────────┼────┐   │                 │
│         │    (scraped by Prometheus)         │    │   │                  │
│         │                                    │    │   │                  │
│         └─── Logs (JSON to files) ──────────┴──┐ │   │                 │
│              service-1.log, service-2.log       │ │   │                  │
│                                                 │ │   │                  │
└─────────────────────────────────────────────────┼─┼───┼──────────────────┘
                                                  │ │   │
                    ┌─────────────────────────────┘ │   │
                    │  Promtail (tails log files)   │   │
                    │  - Parses JSON                 │   │
                    │  - Extracts traceId/spanId     │   │
                    │                                │   │
        ┌───────────▼────────────────────────────────┼───┼───────────────┐
        │          DOCKER: monitoring_net            │   │               │
        │          (custom bridge: 172.19.0.0/16)    │   │               │
        │                                            │   │               │
        │  ┌──────────┐      ┌──────────┐           │   │               │
        │  │   Loki   │◀─────│ Promtail │───────────┘   │               │
        │  │  :3100   │ push │  :9080   │               │               │
        │  └────┬─────┘ logs └──────────┘               │               │
        │       │                                        │               │
        │  ┌────▼─────────────┐    ┌────────────┐       │               │
        │  │   Prometheus     │    │   Tempo    │◀──────┘               │
        │  │     :9090        │    │   :3200    │ OTLP traces           │
        │  └────┬─────────────┘    └─────┬──────┘                       │
        │       │ scrapes metrics         │                              │
        │       │ (via 172.19.0.1)        │                              │
        │       │                         │                              │
        │       │ evaluates rules         │                              │
        │       │ fires alerts            │                              │
        │       │                         │                              │
        │  ┌────▼─────────────┐           │                              │
        │  │  Alertmanager    │           │                              │
        │  │     :9093        │           │                              │
        │  └────┬─────────────┘           │                              │
        │       │ routes                  │                              │
        │       │ notifications           │                              │
        │       │                         │                              │
        │  ┌────▼─────────────┐           │                              │
        │  │  MailHog / SMTP  │           │                              │
        │  │  :1025 (SMTP)    │           │                              │
        │  │  :8025 (Web UI)  │           │                              │
        │  └──────────────────┘           │                              │
        │                                 │                              │
        │  ┌─────────────────────────────▼──────────────────────┐       │
        │  │              Grafana :3000                          │       │
        │  │  ┌──────────────────────────────────────────────┐  │       │
        │  │  │ Datasources: Prometheus, Loki, Tempo, AM    │  │       │
        │  │  │ Dashboards: JVM Metrics, HTTP Metrics        │  │       │
        │  │  │ Explore: Logs (LogQL), Traces (TraceQL)      │  │       │
        │  │  └──────────────────────────────────────────────┘  │       │
        │  └─────────────────────────────────────────────────────┘       │
        │                                                                 │
        └─────────────────────────────────────────────────────────────────┘
                              ▲
                              │
                    User accesses via localhost
                    (published ports: 3000, 9090, 9093, 8025, etc.)
Key Points:
- Traces: OpenTelemetry Java agent auto-instruments Spring Boot → exports via OTLP gRPC to Tempo (:4317) → visualized in Grafana
- Metrics: Spring Boot Micrometer exposes metrics at
/actuator/prometheus→ Prometheus scrapes (:8081/:8082 via gateway) → visualized in Grafana - Logs: Logback writes JSON to files with
traceId/spanId(injected by OTel) → Promtail parses and pushes to Loki → visualized in Grafana - Alerts: Prometheus evaluates alert rules → Alertmanager routes notifications → SMTP (MailHog or Gmail)
- Correlation: OpenTelemetry injects
traceId/spanIdinto logs (via MDC) and HTTP headers (via W3C Trace Context), enabling seamless log ↔️ trace correlation
GitLab Repo Link:
https://gitlab.com/developer-playbook/springboot-otel-monitoring
Prerequisites:
Docker, Docker Compose, Java 17+, and Maven installed.
Quick Start
./deploy-monitoring.sh start- Builds both Spring Boot services with Maven.
- Starts the monitoring stack via Docker Compose.
- Launches the services on host ports 8081/8082.
- Waits for readiness, then generates sample traffic.
Access points:
- Grafana: http://localhost:3000 (admin / admin123)
- Prometheus: http://localhost:9090
- Alertmanager: http://localhost:9093
- MailHog: http://localhost:8025
- Tempo API: http://localhost:3200
- Services: http://localhost:8081, http://localhost:8082
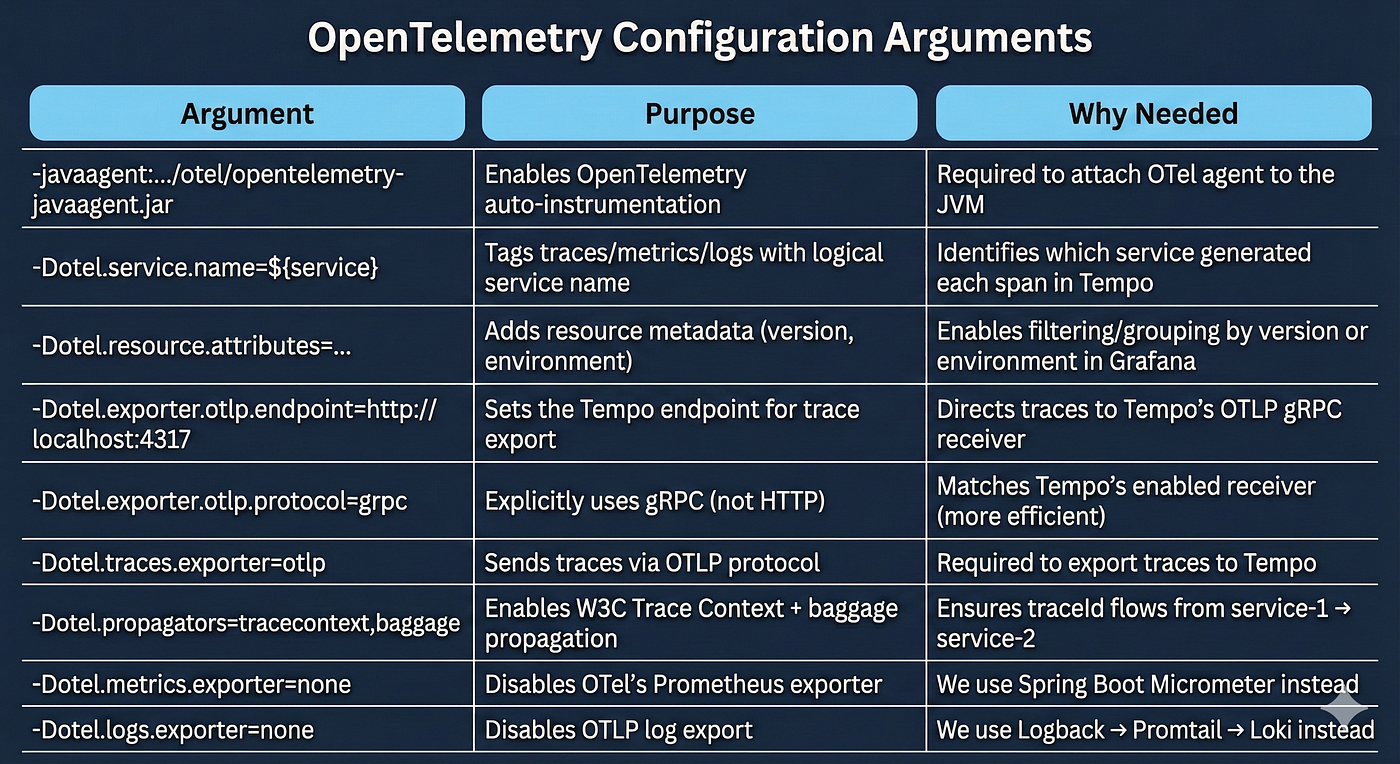
OpenTelemetry Java Agent Arguments Explained
Why so minimal?
- The OpenTelemetry Java agent uses sensible defaults for Spring Boot 3 applications
- Trace context propagation, MDC injection, and HTTP instrumentation work out-of-the-box
- We only override what’s necessary: service name, endpoint, and exporters
Why disable OTel metrics/logs exporters?
- Metrics: Spring Boot Actuator + Micrometer already exposes excellent JVM and HTTP metrics at
/actuator/prometheus. OTel's metrics would be redundant and use a different format. - Logs: We want structured JSON logs in files (for easy searching) with
traceId/spanIdembedded. Logback → Promtail → Loki gives us more control over log format and parsing.
What OTel handles for us automatically:
- ✅ HTTP server instrumentation (Spring MVC controllers)
- ✅ HTTP client instrumentation (RestTemplate, WebClient)
- ✅
traceIdandspanIdinjection into SLF4J MDC (appears in logs) - ✅ W3C Trace Context propagation in HTTP headers (
traceparent,tracestate) - ✅ Span creation for each request with timing, status codes, and errors
Note: Prometheus scraping /actuator/prometheus will generate traces in Tempo. This is expected behavior and indicates the monitoring system is working correctly. Your API traces (e.g., /api/hello, /api/call-service-2) will also appear alongside them.
How Data Flows (The Complete Picture)
1. Application Instrumentation (OpenTelemetry)
- OTel Java agent attaches to service-1 and service-2 JVMs at startup
- Auto-instruments HTTP requests, RestTemplate calls, and Spring MVC controllers
- Creates spans for each operation with timing, status codes, and errors
- Injects
**traceIdand `spanId`** into: - SLF4J MDC → appears in log files
- HTTP headers (
traceparent) → propagates to downstream services
2. Traces
- OpenTelemetry Java agent → Tempo (OTLP gRPC on
localhost:4317) - Tempo stores complete trace data with all spans
- Grafana queries Tempo using TraceQL to visualize request flows
3. Metrics
- Spring Boot Micrometer exposes metrics at
/actuator/prometheus - Prometheus scrapes metrics every 15s (via gateway
172.19.0.1:8081/8082) - Grafana queries Prometheus using PromQL for dashboards
- Prometheus evaluates alert rules and forwards firing alerts to Alertmanager
4. Logs
- Logback writes JSON logs to
./logs/service-1.logand./logs/service-2.log **traceIdandspanId** are included in each log line (injected by OTel MDC)- Promtail tails log files, parses JSON, extracts labels (
traceId,spanId,level, etc.) - Promtail pushes logs to Loki via HTTP
- Grafana queries Loki using LogQL and creates derived fields to link logs ↔️ traces
5. Alerts
- Prometheus evaluates rules (
service down,error rate > 5%) - Firing alerts sent to Alertmanager
- Alertmanager routes notifications to SMTP (MailHog or Gmail)
6. Correlation Magic 🪄
- Click a log line in Grafana → see its
traceId→ click to jump to the full trace in Tempo - Click a span in Tempo → filter Loki logs by
traceId→ see all logs for that request - This is possible because OpenTelemetry automatically injects trace context everywhere
Logs in Grafana (Loki)
- Open Grafana → Explore → select
Loki. - Add filters:
- By level:
{service="service-1", level="INFO "} | json - By class:
{service="service-1", logger="c.e.s.controller. Service1Controller"} | json - By trace/span:
{service="service-1"} | json | traceId != ""(or click a log line and filter ontraceId) Click theTraceIDvalue (derived field) to jump to the corresponding Tempo trace. Notes: - Promtail extracts labels:
service,level,logger,traceId,spanId. - JSON and agent-style plain text lines are both parsed; timestamps are normalized.
Traces in Grafana (Tempo)
- Open Grafana → Explore → select
Tempo. - Query by service:
{ "service.name" = "service-1" } - Or paste a trace ID from a log line. You should see parent spans in
service-1with downstream spans inservice-2for/api/call-service-2.
If you see no data, generate traffic again:
curl "http://localhost:8081/api/hello"
curl "http://localhost:8081/api/call-service-2"
Dashboards (Provisioned)
- JVM Metrics: Heap used (MB), heap usage (%), process CPU (%), GC pause (ms over 5m).
- HTTP Metrics: Per-API call counts (5m increase) for:
service1_hello_totalservice1_calls_service2_totalservice2_hello_totalservice2_process_total
Open Grafana → Dashboards and select JVM Metrics or HTTP Metrics.
Alerts
Alert rules are defined in monitoring/alert_rules.yml:
- Service1Down / Service2Down: Fires when
up{job="service-x"} == 0for 1 minute. Indicates the service is completely down. - HighErrorRateService1/2: Fires when HTTP 5xx error rate exceeds 5% of total requests over a 2-minute window.
Alert routing is configured in monitoring/alertmanager.yml. Firing alerts appear in:
- Prometheus: http://localhost:9090/alerts (alert evaluation status)
- Alertmanager: http://localhost:9093/#/alerts (alert routing & grouping)
- Email inbox (MailHog or Gmail, depending on configuration)
Email Configuration
Option 1: Local Testing with MailHog (Default)
MailHog provides a local SMTP server and web UI to capture alert emails without sending real emails.
- Web UI: http://localhost:8025
- No setup required — works out of the box
Option 2: Production with Gmail SMTP
To receive real alert emails via Gmail:
Generate a Gmail App Password (required for 2FA-enabled accounts):
- Go to https://myaccount.google.com/apppasswords
- Sign in to your Google account
- Select “Mail” and “Other (Custom name)” → enter “Alertmanager”
- Click “Generate” → copy the 16-character password
Update monitoring/alertmanager.yml:
- Comment out the MailHog section (lines 2–4)
- Uncomment the Gmail section (lines 7–11)
- Replace placeholders:
smtp_smarthost: 'smtp.gmail.com:587'
smtp_from: 'your-email@gmail.com'
smtp_auth_username: 'your-email@gmail.com'
smtp_auth_password: 'abcd efgh ijkl mnop'  # 16-char App Password
smtp_require_tls: true
Restart the stack:
./deploy-monitoring.sh restartTest the configuration:
./simulate-alert.sh app-down service-1Check your Gmail inbox for the alert email (may take 1–2 minutes).
Note: Gmail has sending limits (500 emails/day for free accounts). For high-volume production systems, consider using dedicated SMTP services (SendGrid, Amazon SES, etc.).
Validation
After any change:
./deploy-monitoring.sh restart   # rebuild & restart (or ./deploy-monitoring.sh start)
./deploy-monitoring.sh test      # ensure all health checks pass
Additionally:
- Grafana Explore → Loki: confirm new logs appear with
traceIdlabels. - Grafana Explore → Tempo: confirm only service traces show up.
- Prometheus →
Targets: verifyservice-1/service-2areUP. - Trigger alerts using
simulate-alert.shand confirm email notifications are delivered.
Conclusion
Observability doesn’t have to be complicated. By leveraging the OpenTelemetry Java Agent, we removed the need for manual coding, keeping our services clean and focused on business logic. By combining it with the LGTM stack, we gained a robust, correlated view of our system’s health.
Whether you are debugging a latency issue or responding to a production outage, having logs, metrics, and traces linked together turns “guessing” into “knowing”.
Enjoyed this article?
👏 Clap to support the content 🔄 Share it with your network ➕ Follow me for more engineering contents 🤝 Connect with me on LinkedIn
메타데이터
- post_id
- 7341dc655f1d
- slug
- spring-boot-observability-stack-opentelemetry-prometheus-loki-tempo-grafana-7341dc655f1d
- url
- https://medium.com/techtrends-digest/spring-boot-observability-stack-opentelemetry-prometheus-loki-tempo-grafana-7341dc655f1d
- canonical_url
- https://medium.com/techtrends-digest/spring-boot-observability-stack-opentelemetry-prometheus-loki-tempo-grafana-7341dc655f1d
- author_url
- https://medium.com/@mustufa589
- status
- ok
- fetched_at
- 2026-06-14 11:28:49