LLM Observability: The Non-Negotiable Layer within AI; Why It is Important.
Introduction
LLM Observability: The Non-Negotiable Layer within AI; Why It is Important.

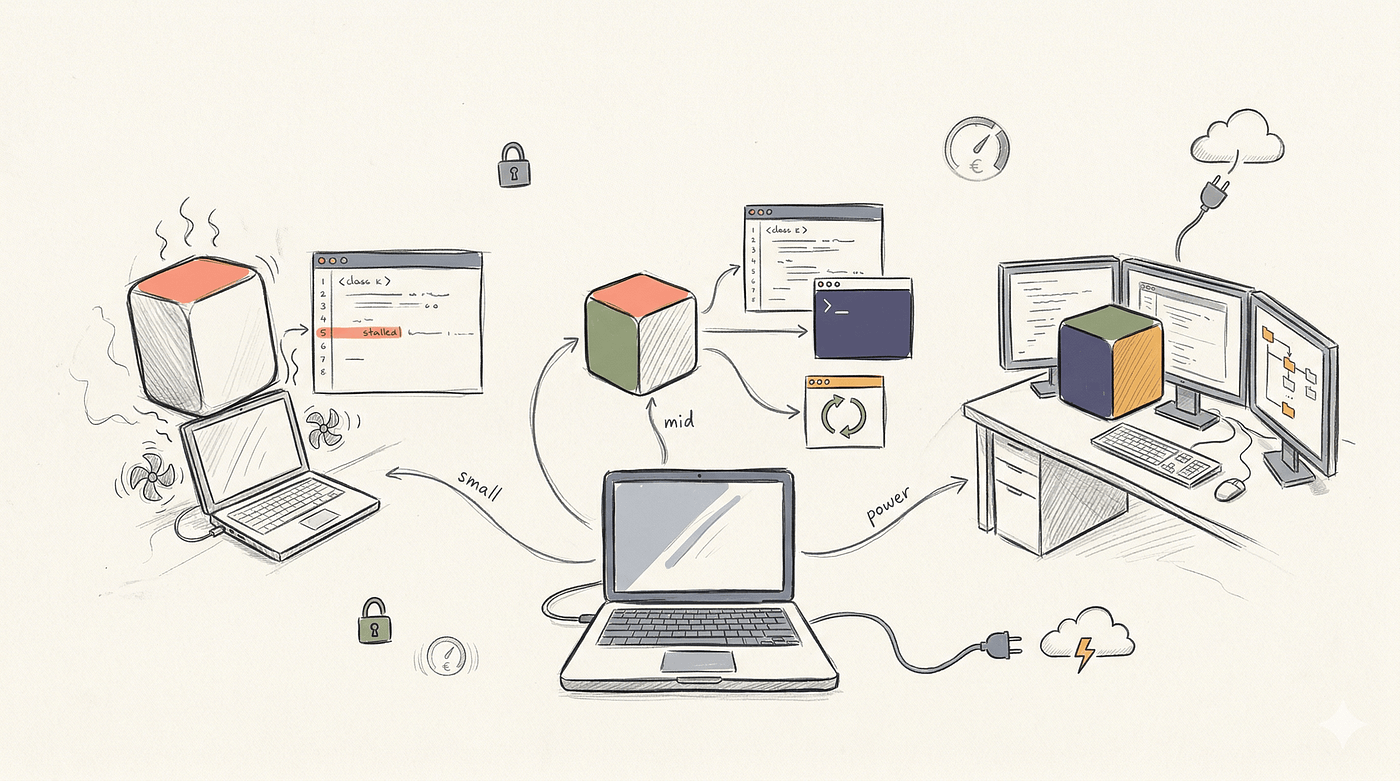
Image Generated by Gemini
Introduction
Let’s assume you deploy your LLM application, it can be a company product or a chatbot, assume whatever that links from start to finish with a LLM model in between. Let’s also assume when you test it locally, it performs great, and results look promising. Naturally, you deploy it and it still looks great.
One day, someone reports an issue. The system produced a wrong answer. You go to investigate, and you find: no record of the original prompt. No visibility into what the model actually understood. No trace of which documents were retrieved. Nothing to reconstruct what happened. At this point, debugging becomes guesswork, and an incoming migraine (I wouldn’t wish migraine even on my worst enemy, it’s horrible)
This is not a rare situation. It’s the default state for most teams deploying LLM-based systems without a proper observability layer. Traditional logging can confirm a request was processed, but it can’t tell you how or why a model produced a particular response.
LLM observability closes that gap. It lets you capture what the model saw, what context it was given, how it processed information, what input went is, what it’s reasoning chain is and how the final response was assembled. Without it, your system is a black box, even to you, and of course to everyone else.
And the failures are not always dramatic. A RAG-based customer support bot can start citing a return policy that was updated three months ago, and nobody notices for six weeks, because every request returns a clean 200, latency looks fine, and there are no errors to alert on. The system is broken in a way that only a customer sees. That is the exact problem observability exists to catch.
What is LLM Observability?
In simple terms, LLM observability is the practice of collecting, analyzing, and acting on data generated by language model systems in production. Its goal goes beyond checking whether the system is up, it’s about understanding whether it’s producing accurate, relevant, and safe outputs, mostly useful for auditing at a latter stage.
Image Generated by Gemini
This involves capturing signals like latency, token usage, prompts and responses (or their metadata), retrieved context, and evaluation scores. Together, these give you a complete picture of how your system actually behaves under real-world usage.
Monitoring vs. observability: Monitoring tells you something is wrong. Observability tells you why. For deterministic software, monitoring is often enough. For LLMs, where the failure is a confident wrong answer rather than a thrown exception, observability is the minimum viable approach.
Why Traditional Monitoring Falls Short
Most teams already rely on tools like Datadog or Grafana to monitor infrastructure performance. These are indispensable, but they were designed for deterministic systems, where a successful request usually implies correct execution.
LLMs are fundamentally different. They’re probabilistic. The same input can produce different outputs and sometimes something so unexpected, though its the same systemic pattern, that my hair has turned white and I stopped figuring it out (for now). Your system can show perfect latency, zero errors, and full uptime, while quietly delivering wrong answers to every user. Traditional tools are blind to this. LLM observability isn’t a replacement for them; it’s the layer that covers what they can’t see.
The Four Pillars of LLM Observability
A structured approach to LLM observability comes down to four components. Each captures something the others can’t. And I learnt this the hard way.
-
Metrics: Performance metrics like time to first token and latency percentiles tell you how the system feels to users. Token usage tracks cost and load. But the metrics that matter most are the ones traditional tools miss entirely: relevance, groundedness, hallucination rate, and safety compliance.
-
Traces: A trace captures the full lifecycle of a request across every component: retrieval, prompt construction, inference, post-processing. When something fails, traces let you reconstruct exactly what happened instead of guessing. The non-negotiable here is a consistent trace ID propagated across all components. This extends to the model’s reasoning chain itself. With models that think before they respond, observability means capturing not just what went in and what came out, but what the model was considering in between, what it assumed about the question, which direction it started going before correcting itself, and where its confidence was shaky. That intermediate reasoning is often where the real failure lives. Without visibility into it, you’re only seeing the final answer, not the thinking that produced it.
-
Logs: LLM logs need a different approach than traditional logs. Because prompts often contain sensitive data, most teams adopt a metadata-first strategy, recording token counts, latency, model identifiers, and evaluation scores, while limiting raw content storage unless strictly necessary.
-
Evaluation: This is what makes LLM observability different from everything that came before it. The question isn’t whether a request completed, it’s whether the response was actually good. Start small: relevance, groundedness, and safety. Three metrics you act on beat twenty you ignore.
Of these four, evaluation is the most important to get right early. A small, focused set of metrics, relevance, groundedness, safety, is far more actionable than an exhaustive taxonomy you’ll never have time to act on.
Observability in RAG and Agent Systems
RAG pipelines can fail at any stage, retrieval, reranking, context assembly, generation. Your model might get irrelevant documents and produce a confident, coherent, wrong answer. The key is evaluating each stage independently, not just the final output. Good retrieval does not guarantee good answers, and they can disagree.
Agent systems are harder still. One user request can trigger dozens of model calls, tool invocations, and branching decisions. Without step-level trace reconstruction, capturing every tool input, output, and intermediate decision, debugging agentic failures isn’t debugging. It’s guessing. The same applies to chain of thought, an agent that reasoned its way to the wrong tool call leaves no trace of why unless you’re capturing it. The decision looks fine from the outside. The reasoning was broken from the start.
Healthcare AI: When Observability Becomes a Safety Requirement
In most domains, a poor LLM response is a product problem. In healthcare, it can be a patient safety issue. That changes what observability means, it’s no longer about debugging or cost. It’s a core pillar of reliability, accountability, and regulatory compliance.
Image Generated by: linkedin.com/punyakeerthi-bl-864382aa
HIPAA and GDPR impose real constraints: limited raw content storage, strict governance controls, detailed audit trails for every interaction. These aren’t optional; they’re design requirements from day one. Healthcare systems also need domain-specific evaluation metrics: clinical accuracy, guideline adherence, appropriate escalation. In high-risk scenarios, human review belongs in the workflow, not bolted on after an incident.
In healthcare AI, observability is not a debugging tool. It is the mechanism through which you can credibly claim your system is safe to operate.
Cost Observability: The Bill Nobody Saw Coming
Most teams monitor quality and reliability. Few monitor costs, until an invoice surprises someone. Token costs grow invisibly fast, especially in agent loops. Most teams that audit their usage find a 30 to 50 percent reduction is achievable with zero quality loss. The savings are already there. You just can’t see them.
Cost observability means tracking per request, per model, per team, per API key; not just the monthly aggregate. A bloated system prompt replicated across millions of requests is often the biggest line item, and it’s invisible until you look. Track input versus output token ratios, cache hit rates, and per-run agent costs, which are the highest-risk surface by far.
Practical rule: Set a cost-per-request baseline for each feature or endpoint. Alert when it drifts more than 20% above that baseline. Cost drift is often the first observable signal that something has changed in your pipeline before quality metrics catch up.
Enterprise Challenges: What Changes at Scale
Individual teams can get observability working in an afternoon with a proxy-based tool and a few evaluation metrics. Enterprises face a different set of problems and they’re mostly not technical. They’re organizational, regulatory, and architectural.
- Data privacy. Logging raw prompts in enterprise settings can accidentally create a regulated data lake containing PII, trade secrets, and proprietary business logic. Your observability pipeline needs PII scrubbing before data hits storage. Default to logging metadata, not content.
- Regulatory compliance. The EU AI Act requires transparency and human oversight for high-risk systems — observability is the technical foundation. GDPR requires every AI-assisted decision to be traceable. HIPAA requires full audit trails and BAAs with every vendor in the data path, including your observability tool. Non-compliance costs more than the infrastructure.
- Multi-tenancy. Cost attribution, data isolation, and differential SLAs all require per-request metadata tagging by team, product, and customer. None of this comes built into standard observability tooling by default.
- Non-determinism at scale. You can’t monitor LLM quality as binary pass/fail. You need distributions and statistical thresholds. And when a model provider quietly updates their base model, your prompts can shift behavior with no change on your end. Observability is how you catch it before users do.
The Mistakes You Don’t Want to Make
Most teams don’t fail at observability because they didn’t care. They fail because they made a small set of very common mistakes early on. Here’s what to watch for.
- Logging outputs but not inputs: Recording model responses without capturing the full prompt and retrieved context means you can never reconstruct why a response was generated. When something goes wrong, you’re already blind.
- Treating “no errors” as “working correctly”: An LLM system can return HTTP 200 responses all day while producing subtly wrong, biased, or hallucinated answers. Zero errors is a floor, not a success metric.
- Skipping trace IDs across components: If each component of your pipeline logs independently without a shared trace identifier, you can never connect a bad output back to the retrieval step, prompt, or model version that caused it.
- Building too many metrics before acting on any: Tracking 30 quality dimensions sounds thorough. In practice it creates noise, delays action, and often results in nothing being monitored effectively. Start with three: relevance, groundedness, safety.
- Adding observability after a production incident: Reactive observability is better than none, but by the time you’re adding it post-incident, you’ve already lost the data you needed most. Instrument before you deploy.
- Storing raw prompts without a privacy strategy: Full prompt logging is powerful but carries real risk, especially in healthcare, legal, or enterprise contexts. Adopt a metadata-first strategy and only store raw content when there’s a clear, justified need to do so.
Tools Worth Knowing
Here are the tools worth knowing for LLM observability:
- **Langfuse — **Tracing, logging, and evaluation in one platform. Self-hostable for privacy-sensitive environments.
- **Arize Phoenix **— Strong on model performance analysis and RAG evaluation. Well-suited for deep quality investigation.
- **Helicone **— Proxy-based approach for rapid deployment. Minimal setup overhead for teams that need to move fast.
- **OpenLIT **— Integrates well with Grafana and existing observability stacks. Good for teams that already have infrastructure in place.
- **FloTorch **— Enterprise platform for agentic workflows with built-in observability, tracing, and evaluation. Optimizes across cost, latency, and throughput out of the box.
The general rule of thumb: start with a managed platform (Langfuse or Helicone) to get visibility fast, then migrate to a custom stack if your requirements outgrow it.
The Bottom Line
Image Generated by: linkedin.com/feed/update/urn:li:activity:7404165634080591872/
As LLMs become foundational to modern software, observability is no longer optional infrastructure, it’s the difference between a system you can trust and one you’re just hoping works.
The good news: you don’t need to instrument everything at once. Pick three quality metrics. Add trace IDs. Set up basic evaluation. Ship that first. Observability is a practice, not a one-time project.
The teams that get this right won’t just debug faster — they’ll build better systems, catch regressions before users do, and earn something that can’t be bought: confidence in what they’ve built.
메타데이터
- post_id
- 74a97367a6fa
- slug
- llm-observability-the-non-negotiable-layer-within-ai-why-it-is-important-74a97367a6fa
- url
- https://medium.com/@moghalsheeba/llm-observability-the-non-negotiable-layer-within-ai-why-it-is-important-74a97367a6fa
- canonical_url
- https://medium.com/@moghalsheeba/llm-observability-the-non-negotiable-layer-within-ai-why-it-is-important-74a97367a6fa
- author_url
- https://medium.com/@moghalsheeba
- status
- ok
- fetched_at
- 2026-06-09 15:37:30