Everyone Says Graphify Cut Their AI Coding Bill 70x.
Open any developer feed right now and you will trip over the same headline in five different fonts. Someone cut their Claude Code token…
Everyone Says Graphify Cut Their AI Coding Bill 70x. The Real Number Depends on One Thing Nobody Mentions.
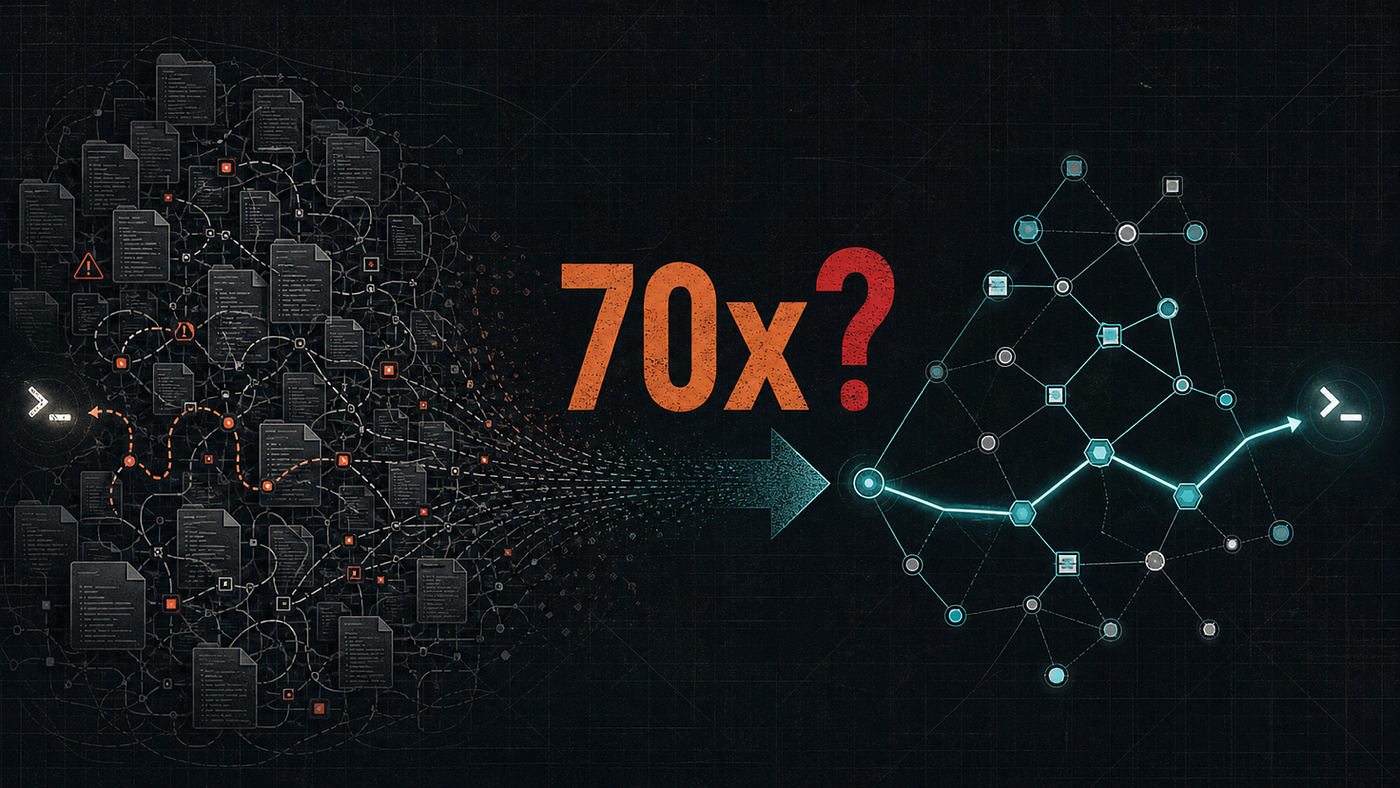
Open any developer feed right now and you will trip over the same headline in five different fonts. Someone cut their Claude Code token usage 70x with Graphify. Someone else swears it was 120x. A third person, more modest, claims a tidy 71.5x. The multipliers keep climbing like a car dealership sign, and the tool underneath them, an open-source skill called Graphify, has piled up close to 78,000 GitHub stars on the strength of exactly this promise.
I have been paying real money to AI coding agents for long enough to be suspicious of any number with an “x” after it. So I read the claims properly, installed the thing on my own machine, and pointed it at the kind of codebase I actually work in. The short version: the tool is real, the idea behind it is sound, and the 70x figure is not a lie. It is just wildly conditional. Whether you get anything close to it comes down to a single property of your project that almost none of these posts bother to state out loud.
Where the 70x actually comes from
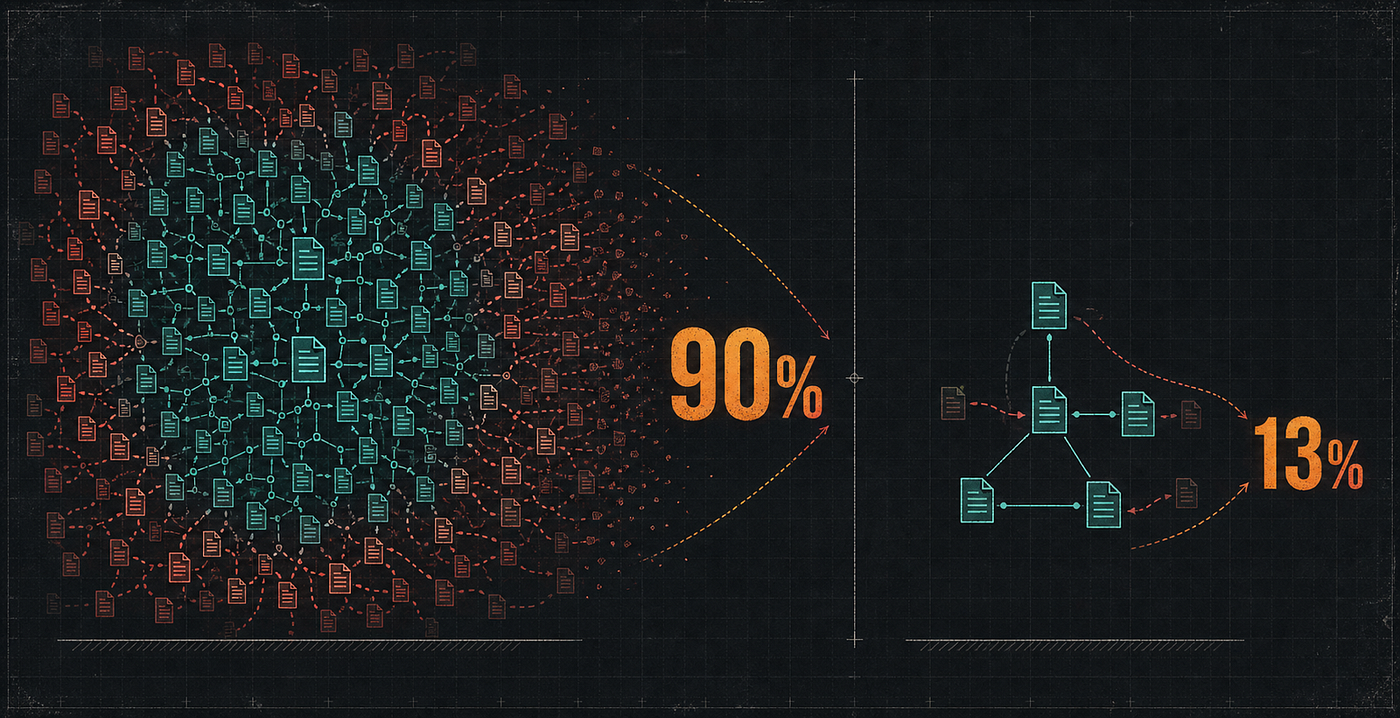
Start with why your agent burns tokens in the first place. Ask Claude Code or Cursor to explain one function and it does a competent job for very little money. Ask it to trace how a request travels from your controller down to the database, and the behaviour changes completely. The agent starts exploring. It reads files, dozens and sometimes hundreds of them, follows imports, opens neighbouring modules, greps for a symbol, reads more files. Every one of those reads is billed. Almost none of it is reasoning. The model is not thinking hard about your question yet. It is still trying to find where the answer lives.
That exploration is the fat that Graphify trims. It parses your repository ahead of time and hands the agent a pre-built map, so instead of reading two hundred files to reconstruct a call chain, the agent asks the map one question and gets the answer back. The tokens you save are the orientation tokens, the ones spent finding relevant code rather than understanding it.
Which tells you exactly where the giant multipliers come from, and where they evaporate. On a sprawling monorepo the orientation cost is enormous, so removing it looks miraculous. On a tidy 200-file service the agent was never going to flail for long, so the graph saves you very little. The public benchmarks on the sibling tool CodeGraph show the same spread in black and white: around 90 percent fewer tokens on a large TypeScript project, and a limp 13 percent on a small Java library. Same tool, same model, order-of-magnitude difference in payoff, and the only variable that moved was the size and tangle of the codebase.
So when a post promises 70x, the honest translation is “70x on a big, deeply interconnected repository, for tasks that are mostly navigation.” That is the one thing nobody puts in the headline.
What Graphify actually is
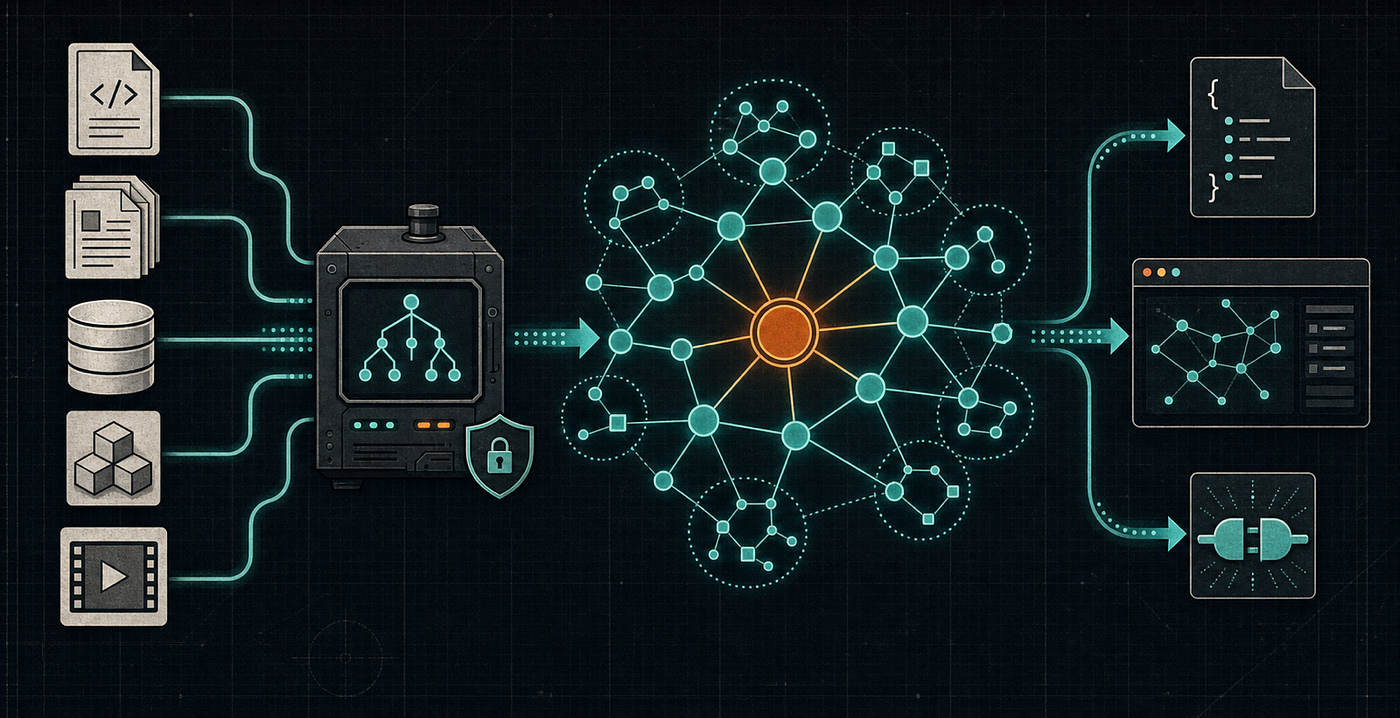
Underneath the marketing, the mechanism is refreshingly plain. You type /graphify . inside your assistant, or run the CLI directly, and it walks your folder building a knowledge graph. Code is parsed with tree-sitter into an abstract syntax tree, and the symbols and relationships (functions, classes, calls, imports, inheritance) become nodes and edges. This part runs entirely on your machine with no model involved, which means it is deterministic and free. Nothing about your source leaves the laptop.
What surprised me is how far past raw code it reaches. Graphify will happily ingest your SQL schema, your Terraform, your Markdown docs, an arXiv paper, even a YouTube video, and drop all of it into the same graph as your application code. It tags every relationship it records as EXTRACTED, INFERRED, or AMBIGUOUS, so you can see at a glance what it found in the source versus what it guessed. It ranks the most-connected concepts in your project as “god nodes,” the hubs everything routes through, and it clusters the graph into labelled communities. The output is three files: a queryable graph.json, an interactive graph.html you can click around in a browser, and a plain report. If your agent wants repeated structured access, Graphify also exposes the graph as a Model Context Protocol server, so the assistant can call query_graph, shortest_path, or get_neighbors like any other tool.
It is built on tree-sitter and NetworkX, released under the permissive MIT license, and maintained mostly by one developer, Safi Shamsi, with a crowd of contributors behind him. For a project this young it is remarkably complete.
The part nobody puts in the headline

Here is the asterisk that the 70x crowd skips. The graph only helps with the exploration half of the work. If your question is “why is this query slow” or “design me a caching layer for this service,” the heavy lifting is reasoning, and the graph contributes nothing to reasoning. It gathers context more efficiently. It does not think for the model. On the days my work is mostly hard problems rather than navigation, Graphify’s savings round down to noise, and that is not a flaw so much as a boundary the enthusiasm tends to blur.
The second asterisk matters more for how you deploy it. Code extraction is local and free, but the feature everyone gets excited about, turning your docs and papers and diagrams into graph nodes, is not. That layer needs a model to read prose and pull out meaning, so Graphify sends semantic descriptions of those documents to whatever backend you have configured. It never ships raw source, which is a smart design choice, but “100 percent local and free” is only strictly true for the code. The moment you want the “why” layer, you are either paying an API or running a local model to produce it.
That distinction happens to land squarely in my daily setup. I run Qwen 3.6–27B on a 36GB MacBook Pro through Ollama for most things, and I still pay for a frontier API on the hard cases that a local model fumbles. Graphify supports pointing its extraction at a local Ollama backend, so I could keep the whole pipeline on the laptop and off the invoice. That worked, with the predictable catch: a 27-billion-parameter local model is slower and less sharp at semantic extraction than the paid alternative, so the document graph it produced was rougher. Free, private, and good enough for orientation. Not the same artefact I would get from a top-tier API.
Running it on my own machine
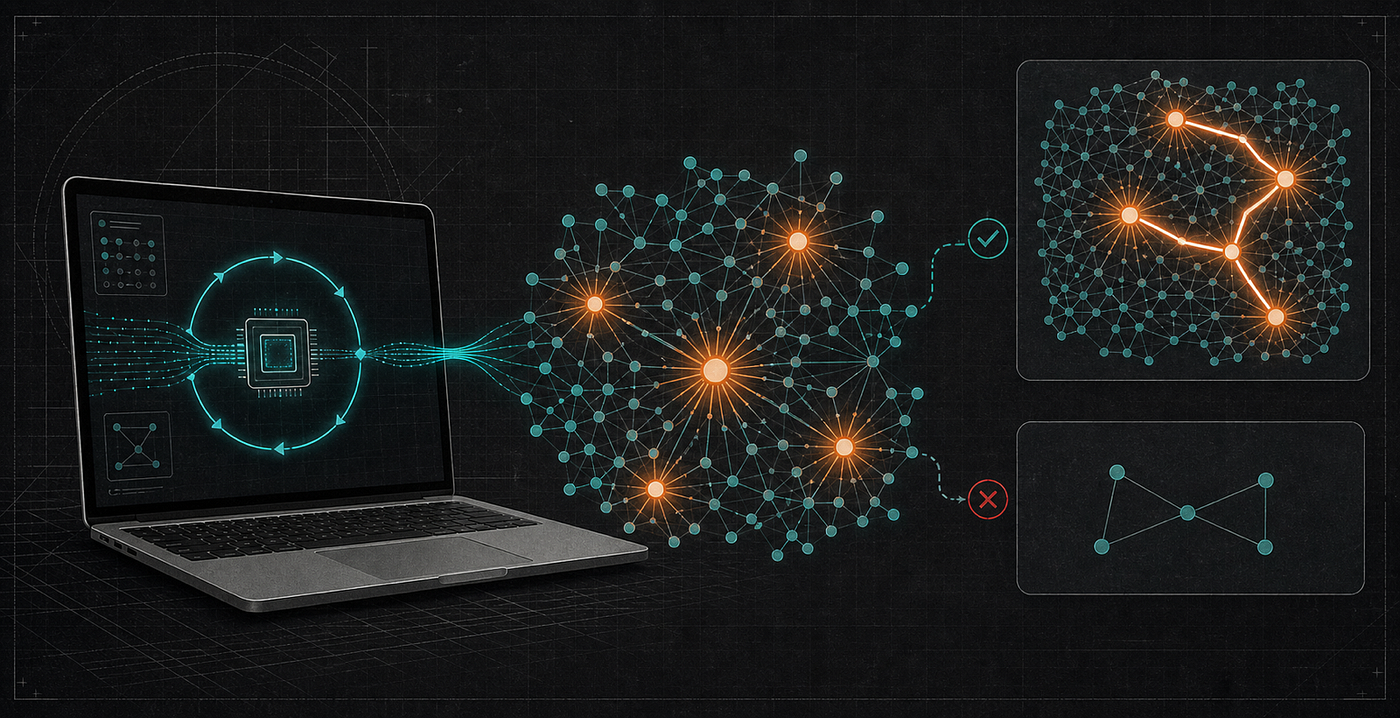
On a large service I know well, the graph earned its keep. The agent stopped its usual habit of opening a dozen files to remind itself how the pieces connect, and the interactive HTML view turned out to be more useful than I expected, less as a token-saving trick and more as a map of a system I thought I already had in my head. The god-node ranking quietly pointed at two modules that everything depended on, which is the sort of thing you feel in your bones after a year on a codebase but rarely see laid out. If I were onboarding onto that repo cold, I would run Graphify on day one just for the picture, never mind the tokens.
On a small side project the story inverted. Building the graph, keeping it current, and reasoning about whether it was even stale cost more attention than the handful of file reads it saved. The agent was fast on that repo already. A map is worth nothing when you can see the whole town from where you are standing.
So should you install it
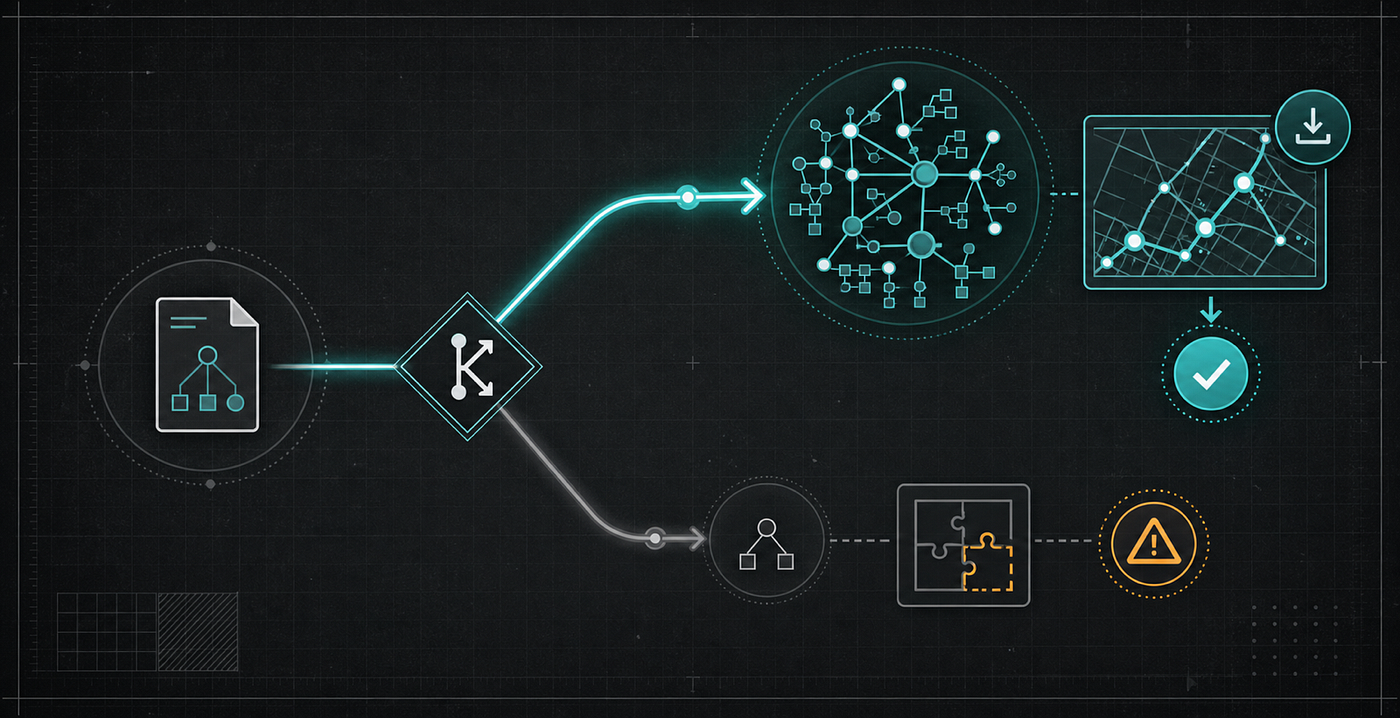
If you work in a large, deeply linked codebase and a real slice of your day is the agent tracing things across it, install Graphify and expect it to pay for itself, though probably not at 70x. If your repositories are small or your work skews toward reasoning over navigation, the graph is a solved problem you did not have, and the honest expected value is closer to CodeGraph’s 13 percent than to anyone’s viral screenshot.
Treat the star count the way you would treat any number that grew from 58,000 to 78,000 in a few months: as evidence of a real itch, not proof the scratch works for you. The itch is genuine. Agents are expensive precisely because they explore, and handing them a map instead of a flashlight is one of the more sensible ideas to come out of this whole cycle. The disappointment, when it comes, will not be with the tool. It will be with the multiplier you were promised, measured against the codebase you actually have.
Give it a weekend on your biggest repo. Just do the arithmetic yourself before you go quoting anyone’s “x” in a standup.
메타데이터
- post_id
- 752fc1e1f0d9
- slug
- everyone-says-graphify-cut-their-ai-coding-bill-70x-752fc1e1f0d9
- url
- https://medium.com/@lenner9090/everyone-says-graphify-cut-their-ai-coding-bill-70x-752fc1e1f0d9
- canonical_url
- https://medium.com/@lenner9090/everyone-says-graphify-cut-their-ai-coding-bill-70x-752fc1e1f0d9
- author_url
- https://medium.com/@lenner9090
- status
- ok
- fetched_at
- 2026-07-10 16:32:07