Real-Time Quality Assurance for Enterprise Application — Powered By AI
Today’s standard enterprise applications are complex and mostly driven by the microservice architecture. Even in the legacy systems, we…
Real-Time Quality Assurance for Enterprise Application — Powered By AI
Today’s standard enterprise applications are complex and mostly driven by the microservice architecture. Even in the legacy systems, we would find many components or modules which are very critical, and their malfunction would impact many other components. Today we perform the dependency tracking and impact assessment among the components manually and it is both tedious and also an error-prone task which mainly depends on the expertise of an individual. We also have many monitoring systems, mostly ping systems, today working in silos to detect the failure of the component but most of them fail to give the impact of the failure on the other components in the systems. Also, with Agile methodologies adopted and changes being implemented and deployed in production frequently, it is common to have a unit/ sanity test suite executed frequently. But in case of a test case failure, it is difficult to point to the business feature being impacted as this knowledge would be limited to only the developer of that module.
To address the above issues and bring in the power of machine learning for predictive analytics we have developed a system with the following capabilities.
Dependencies Tracking
We have a built-in a visualization using D3 which gives a complete view of the application with all of its components and also the dependencies among the component. Other metadata about a component like the technologies involved, servers/sites currently running those application components can also be viewed here and the same can be used as filters if required.
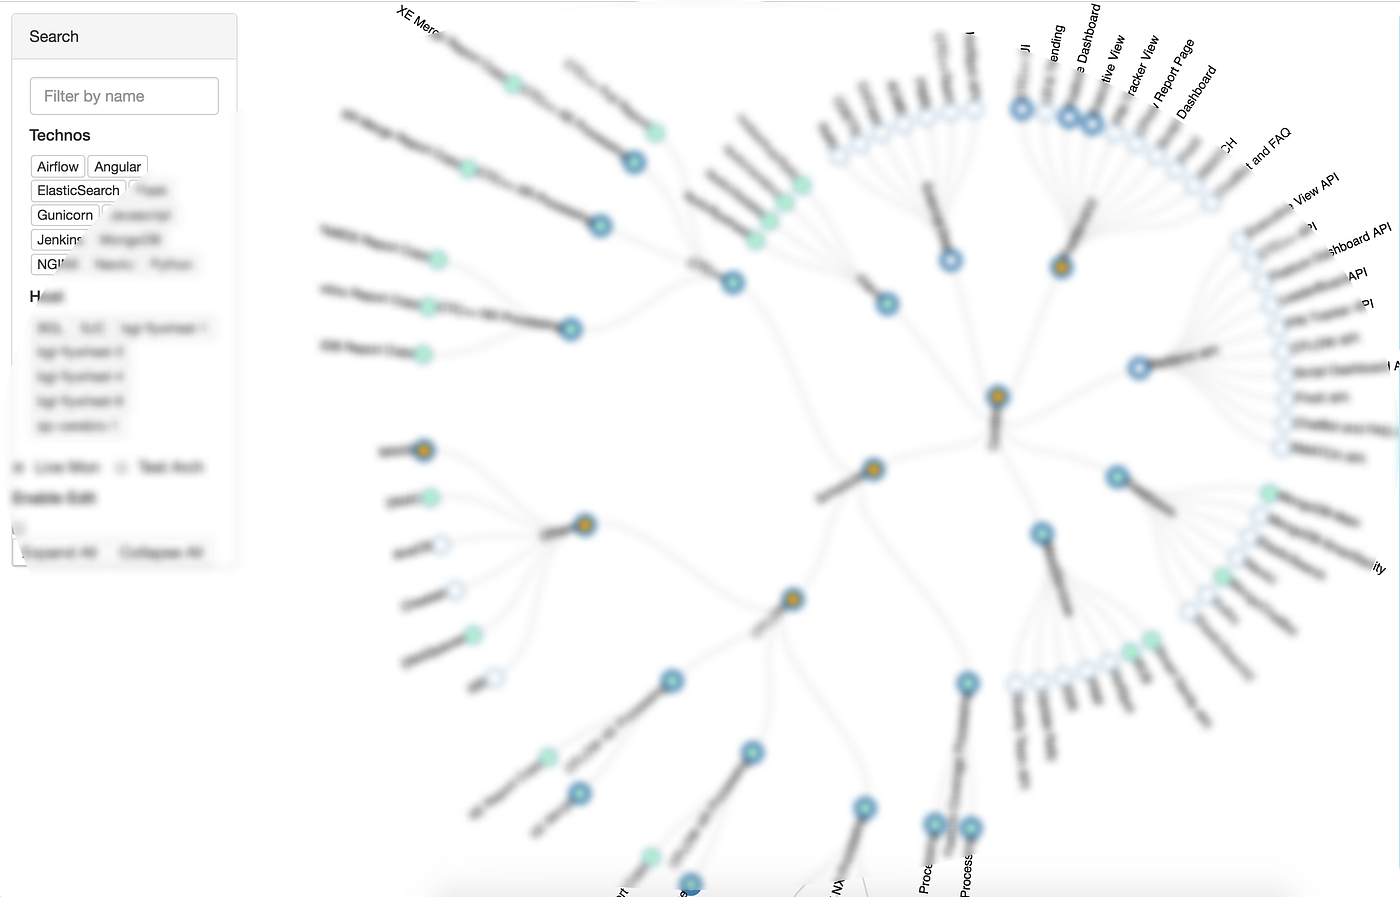
To get the upstream and downstream information for a node, we can just hover on it. A node’s upstream will be indicated by blue and its downstream by red. With this, we get a clear picture as to what modules/components are needed for the proper working of the given component [upstream] and also the components information which will be impacted if something goes wrong with the given component[downstream].

To get the above benefits, a one-time configuration has to be done with information like node dependencies, host info, etc. The same can be done by just clicking on a node and filling up a simple form
Framework for Live Monitoring
We have developed a framework for defining the policies and health checks for each component in the above architecture diagram. The framework provides an easy way to define the health rules and any violation will be reflected in the architecture flow. Currently, we support API monitoring, CLI monitoring, and DB monitoring.
The application owner has to define the policies and the violation check conditions one time using a simple UI we provide and map it to a component in the architecture flow.

More Information about this framework can be found in my other article here
Test Suite Execution Engine
The third aspect of our system is the execution of the test cases and mapping the results back to the architecture diagram. We use Jenkins to execute the test cases defined in the application. For every component defined we create a Jenkins pipeline job automatically. To map a test case to a particular component in the architecture diagram, we expect one additional tagging which will be the component name to be provided for every test case. We use Allure Plugin for providing this additional tag and also for the visualization of test case execution trending and other information. Allure supports python, java, C, Angular, and other major languages. Once tagged, the visualization shows all the test cases mapped to a component and also with its test execution results.

Predictive Analytics and Anomaly detection
We also have a state of art machine learning algorithm for the anomaly detection in terms of response time or any other parameters defined as the business rule in live monitoring. This system will raise alerts not just when the defined business rules violate but also when our ML systems predict the anomaly.
Currently, the alerting channel is Webex Teams and Email Notifications and the same can be configured using the framework.
Next Steps:
- Auto-discovery of the architecture to avoid manual entry for the first time.
- Self-Healing capability in case of failure
- Auto test case creation for the module
- Enhance the Machine learning algorithm used for anomaly detection.
We have prototyped this system for one of our internal application at Cisco and it is been found very useful from the team. If you need more information on any of the aspects or interested to implement this for your application reach out to me on LinkedIn or mail me at parmesh20120@gmail.com
메타데이터
- post_id
- 755f68ea5102
- slug
- real-time-quality-assurance-for-enterprise-application-powered-by-ai-755f68ea5102
- url
- https://medium.com/@parmesh20120/real-time-quality-assurance-for-enterprise-application-powered-by-ai-755f68ea5102
- canonical_url
- https://medium.com/@parmesh20120/real-time-quality-assurance-for-enterprise-application-powered-by-ai-755f68ea5102
- author_url
- https://medium.com/@parmesh20120
- status
- ok
- fetched_at
- 2026-07-13 06:23:13




