Approximation of the location of the data.
To know where the majority of data lies for summarizing a feature.
Approximation of the location of the data.
To know where the majority of data lies for summarizing a feature.
Photo by Firmbee.com on Unsplash
For non-members click here.
When exploring a data feature that might consist of thousands of distinct values, we have to know where most of the data is located.
Some major estimations are discussed below.
1. Mean
It is the basic estimate, it simply means average: sum up all the values and at last divide it by the count of the number of values.
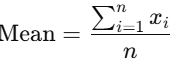
The formula of the mean (pic by author)
where ’n’ refers to the total number of records present.
In Python, we can use NumPy to calculate the mean.
import numpy as np

#describing data
data=[10,20,13,12,423,453,321]

#mean of data using numpy
mean_data=np.mean(data)
print(mean_data)
If we have a dataset in a 2d matrix:
import pandas as pd

#defining data frame
data={'A': [10,20,30,40,50], 'B': [30,40,20,43,23]}
df=pd.DataFrame(data)

#mean of column A
mean_a= df['A'].mean()
print(mean_a)
If in the dataset we have NaN values then mean() gonna ignore it and if we want the NaN values and do not want them to be ignored then:
df['A'].mean(skipna=False)Trimmed Mean
This is another variation of mean and as the name suggests it is trimmed or fixed to a specific point. In trimmed mean, we sort the values first, and from the first and last endpoints drop a fixed number of values and then take an average of these values.

Trimmed mean formula (pic by author)
where k is the proportional cut from the first and last of sorted values.
Why do we need trimmed mean? A trimmed mean is used to eliminate the influence of extreme values, which can negatively affect the arithmetic mean and lead to the condition of outliers( these are data points that are different from the majority of data and can distort models).
Trimmed mean are not sensitive to outliers and are not affected by them.
In Python, trimmed mean comes under the library scipy. stats.
from scipy.stats import trim_mean

#defining data
data=[10,20,30,0.5,5,15.25]

#defining 20% cut from first and last ends
trimmed_mean=trim_mean(data,proportiontocut=0.2)

print(trimmed_mean)
Weighted Mean
Another variation of mean is weighted mean where user specifies a weight for each variable in the feature.

Weighted mean formula(pic by author)
Why do we use weighted mean? Sometimes some values are more important than others and some are less important, so we use weighted mean to specify this.
In Python, we can use numpy. average for weighted mean.
import numpy as np

#defining weights and weights can be negative also
weights=[1,2,-1,3,5]

#defining data
data=[200,10,60,8,200]

weighted_mean=np.average(data,weights=weights)

print(weighted_mean)
2. Median
It is the middle number in a sorted list of data.
For an odd number of counts If the count of values(n) is odd values then it is very easy to find the middle element just go for (n+1/2) element. For example: elements= 1,2,3,4,5 here count of elements is 5 which is odd so the median=element[(5+1)/2] therefore, median= 3. So, the formula of the median with an odd number of counts= data[(n+1)/2]
For an even number of counts If we have an even count of values then we have two middle elements, then we can take the average of both the middle elements. For example: elements= 1,2,3,4,5,6 here 3 and 4 are the middle elements so to select a single element we have to take an average of element[n/2] and element[(n/2)+1] therefore, median= (3+4)/2 = 3.5 So, the formula of the median with an odd number of counts= (data[n/2]+data[(n/2)+1])/2
Compared to the mean which uses all observations the median depends only on the values in the center of sorted data.
The median is robust to outliers as it is not affected by distinct values other than the data set.
Outliers tend to distract data but sometimes outliers are very helpful like in the case of spam detection or anomaly detection where outliers are captured and marked as spam or anomaly.
In Python, with the help of library statistics, we can find the median.
import statistics

data=[7,3,1,4,2,8,6,7,9,10]

median=statistics.median(data)

print(median)
If we have a data set in a 2d matrix:
import pandas as pd

#defining data frame
data={'A': [10,20,30,40,50], 'B': [30,40,20,43,23]}
df=pd.DataFrame(data)

#median of column B
meadian_b= df['B'].median()
print(meadian_b)
Weighted median
In weighted median first, we have to sort the data, although each data value has an associated weight so instead of the middle number the weighted median is a value such that the sum of weights is equal to the lower and upper halves of the sorted list.
Example: data= [20,10,40,30] firstly we have to sort the data. After sorting, data=[10,20,30,40] The weights given by the user, weights=[1,2,3,4] Total weight=1+2+3+4=10 So, for 1st element in data(which is 10) the weight=1, which is less than 50% of the total weight(which is 5). for the 2nd element in data(which is 20) the weight (first element weight)+2(current weight) = 3, which is also less than 50% of the total weight(which is 5). for the 3rd element in data(which is 30) the weight= 1+2+3 = 6, which is greater than 50% of the total weight( which is 5). Therefore median =30.
The weighted median in Python comes under library wquantiles.
Before implementing we have to install the library wquantiles.
pip install wquantilesimport wquantiles
import numpy as np
data=[20,10,40,30]
weights=[1,2,3,4]
#data is list and wquantiles do not work with list it works with numpy array only so converting list ot numpy array
data=np.array(data)
weighted_median= wquantiles.median(data,weights)
print(weighted_median)The weighted median is also robust to outliers.
3. Mode
The most frequent element in a list is mode. mode is majorly used fo categorical data.
Bimodal
If there are exactly two values with the highest frequency.
Example: data=[10,20,10,20,30] Mode =10 and 20.
Multimodal
If there are more than two modes.
Example: data=[3,2,2,3,4,4] Mode = 2,3, and 4.
No modes
If no values repeat.
Example: data=[1,2,3,4] Mode = no mode.
In Python, the statistics library contains mode.
import statistics

data=[1,2,3,3,4]

mode= statistics.mode(data)

print(mode)
If data is in 2D matrix
import pandas as pd

#defining data frame
data={'A': [10,20,30,40,40], 'B': [30,40,20,20,10]}
df=pd.DataFrame(data)

#mode of column B
mode_b= df['B'].mode()
print(mode_b)
Thank you for reading.😊
메타데이터
- post_id
- 75c2e12772ab
- slug
- approximation-of-the-location-of-the-data-75c2e12772ab
- url
- https://medium.com/learn-data-science-with-ayush-nautiyal/approximation-of-the-location-of-the-data-75c2e12772ab
- canonical_url
- https://medium.com/learn-data-science-with-ayush-nautiyal/approximation-of-the-location-of-the-data-75c2e12772ab
- author_url
- https://medium.com/@anautiyal3355
- status
- ok
- fetched_at
- 2026-06-16 19:09:56