Implementing Cisco IOS-XE Monitoring Using Model-Driven Telemetry with Telegraf, InfluxDB2, and…
A Step-by-Step Guide to Configuring Cisco IOS-XE MDT with Telegraf, InfluxDB2, and Grafana for Real-Time Network Monitoring
Implementing Cisco IOS-XE Monitoring Using Model-Driven Telemetry with Telegraf, InfluxDB2, and Grafana
Monitoring Cisco IOS-XE devices efficiently requires a robust and modern approach to data collection and visualization. This tutorial provides a detailed, step-by-step guide to implementing Model-Driven Telemetry (MDT) with Telegraf, InfluxDB2, and Grafana. You’ll learn how to configure Cisco IOS-XE for telemetry streaming, set up Telegraf to collect and parse data, use InfluxDB2 for storing metrics, and build Grafana dashboards for clear, actionable network insights. This setup ensures a scalable and real-time monitoring solution tailored for Cisco networks.
For this tutorial, We’ll use this topology:
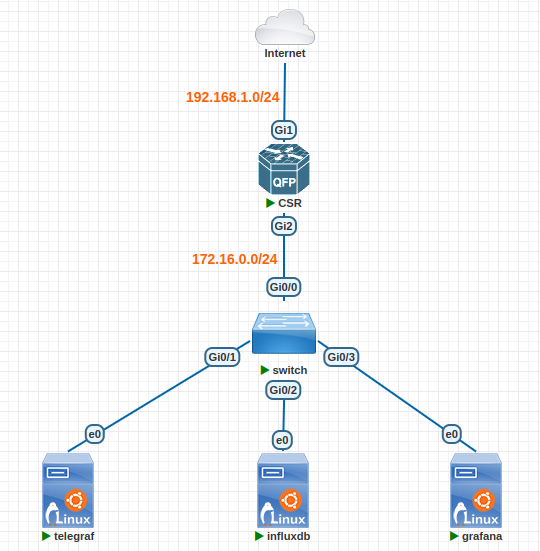
Implementing Cisco IOS-XE Monitoring Using Model-Driven Telemetry with Telegraf, InfluxDB2, and Grafana — Topology
Lab components and pre-requisites:
- CSR (Cisco IOS-XE 17.x)
- GigabitEthernet1: 192.168.1.147/24
- GigabitEthernet2: 172.16.0.1/24
- Static default route and PAT are configured for internet access from local network
- Configure static TCP NAT if Grafana dashboard is needed to be accessible from the outside network
- telegraf (Ubuntu 22.04 Server) - IP Address: 172.16.0.10/24
- This server will be used to host Telegraf Service to receive gRPC Stream from Cisco IOS-XE’s MDT
- influxdb (Ubuntu 22.04 Server) - IP Address: 172.16.0.20/24
- This server will be used to host InfluxDB2 to store stream data received from telegraf that coming from Cisco IOS-XE’s MDT
- grafana (Ubuntu 22.04 Server) - IP Address: 172.16.0.30/24
- This server will be used to host Grafana as stream data visualization platform
- Grafana should be already installed and configured
Assuming that all prerequisites are completed, we can proceed to the deployment and configuration steps.
A. Deploy and Configure InfluxDB2
- Install
influxdb2then enable and start the service
curl --silent --location -O \
https://repos.influxdata.com/influxdata-archive.key
echo "943666881a1b8d9b849b74caebf02d3465d6beb716510d86a39f6c8e8dac7515  influxdata-archive.key" \
| sha256sum --check - && cat influxdata-archive.key \
| gpg --dearmor \
| tee /etc/apt/trusted.gpg.d/influxdata-archive.gpg > /dev/null \
&& echo 'deb [signed-by=/etc/apt/trusted.gpg.d/influxdata-archive.gpg] https://repos.influxdata.com/debian stable main' \
| tee /etc/apt/sources.list.d/influxdata.list

sudo apt-get update && sudo apt-get install influxdb2

sudo systemctl enable --now influxdb- Setup InfluxDB2
influx setup \
  --username <username_string> \
  --password <password_string>\
  --org <organization_string>\
  --bucket <bucket_string> \
  --force
Replace all placeholders with these values:
<username_string>: Username of your choice that will be used as initial admin user for InfluxDB2<password_string>: Username of your choice that will be used as initial admin password for InfluxDB2<organization_string>: Organization name of your choice as initial organization for InfluxDB2<bucket_string>: Bucket name of your choice as initial bucket for InfluxDB2. We can directly insert the bucket name to store Cisco IOS-XE’s MDT stream data here so we don’t need to create another bucket
For this lab, InfluxDB2 setup will be like this:
influx setup \
  --username admin \
  --password Passw0rd$ \
  --org "Hades Inc" \
  --bucket hades_monitoring \
--force- After that, create an auth token for InfluxDB2 that will be used for Telegraf and Grafana to access the monitoring bucket. Give read and write access only to the monitoring bucket
# First, get the ID Value of Organization. Grep the Organization Name, then print the value of first column only
orgID=$(influx org list | grep "Hades Inc" | awk '{print $1}')

# Next, get the ID of monitoring bucket. Grep the Monitoring Bucket Name, then print the value of first column only
bucketID=$(influx bucket list | grep "hades_monitoring" | awk '{print $1}')

# After that, generate read and write auth token for monitoring
influx auth create --org-id $orgID --read-bucket $bucketID --write-bucket $bucketID- Verify InfluxDB2 Setup
systemctl status influxdb
lsof -P -i -n | grep ":8086"
influx org list
influx bucket list- Retrieve the value of the auth token that was created earlier. From this command, identify the admin username and auth token that has read and write access to the monitoring bucket, and save the token string for later use in the Telegraf and Grafana configuration
influx auth listB. Deploy and Configure Telegraf
- Install
telegraf
curl --silent --location -O \
https://repos.influxdata.com/influxdata-archive.key \
&& echo "943666881a1b8d9b849b74caebf02d3465d6beb716510d86a39f6c8e8dac7515  influxdata-archive.key" \
| sha256sum -c - && cat influxdata-archive.key \
| gpg --dearmor \
| sudo tee /etc/apt/trusted.gpg.d/influxdata-archive.gpg > /dev/null \
&& echo 'deb [signed-by=/etc/apt/trusted.gpg.d/influxdata-archive.gpg] https://repos.influxdata.com/debian stable main' \
| sudo tee /etc/apt/sources.list.d/influxdata.list

sudo apt-get update && sudo apt-get install telegraf- Edit Telegraf configuration file
nano /etc/telegraf/telegraf.conf- Add this configuration at the bottom of the configuration file to listen for the gRPC stream from Cisco IOS-XE MDT
[[inputs.cisco_telemetry_mdt]]
  transport = "grpc"
  service_address = ":57000"

  [inputs.cisco_telemetry_mdt.aliases]
ifstats = "ietf-interfaces:interfaces-state/interface/statistics"- Then, add this configuration after the above configuration to forward the stream data to the InfluxDB2 service
[[outputs.influxdb_v2]]
  urls = ["<influxdb2_url>"]
  local_address = "<local_server_address>"
  token = "<influxdb2_monitoring_bucket_rw_token>"
  organization = "<influxdb2_organization_name>"
  bucket = "<influxdb2_monitoring_bucket_name>"
Replace all placeholders with these values:
<influxdb2_url>: InfluxDB2 Service URL. For a normal / default deployment, It should behttp://<InfluxDB2_Server_Address>:8086<local_server_address>: The Telegraf server’s IP Address that will be used to reach InfluxDB2 server<influxdb2_monitoring_bucket_rw_token>: Auth token string that has been generated and retrieved before to access the monitoring bucket<influxdb2_organization_name>: InfluxDB2 organization name where the monitoring bucket resides<influxdb2_monitoring_bucket_name>: Bucket name in InfluxDB2 that will be used to store monitoring data stream
For this lab, the configuration will be:
[[outputs.influxdb_v2]]
  urls = ["http://172.16.0.20:8086"]
  local_address = "172.16.0.10"
  token = "8fT5_0ShbsFogUiELppvyZvILTfyhtQQw31q8iouDRuKxusbZ0Cpzh2vQLbFjopPLpsBVKI56U1pWXnSoEoKEg=="
  organization = "Hades Inc"
bucket = "hades_monitoring"- Save the configuration, then enable and restart
telegraf
systemctl enable telegraf
systemctl restart telegraf- Verify the status of Telegraf Service
systemctl status telegraf
lsof -P -i -n | grep :57000
C. Configure Cisco IOS-XE Model-Driven Telemetry (MDT)
We’ll configure MDT to stream 3 types of monitoring data:
- CPU usage in five seconds interval
- Memory usage
- Interface statistics (rx-kbps and tx-kbps)
- Enter the Router’s console / line, then switch to Global Configuration Mode
enable
configure terminal- Enable NETCONF-YANG
netconf-yang- Configure telemetry stream for CPU usage data in five seconds interval
telemetry ietf subscription 1
 encoding encode-kvgpb
 filter xpath /process-cpu-ios-xe-oper:cpu-usage/cpu-utilization/five-seconds
 source-address 172.16.0.1
 stream yang-push
 update-policy periodic 100
 receiver ip address 172.16.0.10 57000 protocol grpc-tcp
 exit
Explanation of each command:
telemetry ietf subscription 1: Define new telemetry subscription with ID number 1encoding encode-kvgpb: Use kvGPB encoding method. We should use this encoding for gRPC protocolfilter xpath /process-cpu-ios-xe-oper:cpu-usage/cpu-utilization/five-seconds: Filter the metrics using XPath to specify the data to be sent by the subscription. Here, we use an XPath filter for CPU usage data at five-second intervalssource-address 172.16.0.1: Define source address (One of Router’s IP Address(es)) that will be used to send the metricsstream yang-push: Use YANG Push IETF standard for stream type to communicate the metrics -update-policy periodic 100: Frequency / interval to send the metrics in milliseconds. Here, we’ll send the metrics every secondreceiver ip address 172.16.0.10 57000 protocol grpc-tcp: Define where the metrics should be sent. Here, we use the IP address of the Telegraf server, the gRPC listener port configured in the Telegraf service, and gRPC-TCP as the protocolexit: Leave the telemetry subscription configuration mode and go back to Global Configuration Mode- Create and configure a new telemetry subscription to stream memory usage metrics data. We’ll use the same configuration as before except the XPath filter
telemetry ietf subscription 2
 encoding encode-kvgpb
 filter xpath /memory-ios-xe-oper:memory-statistics/memory-statistic/used-memory
 source-address 172.16.0.1
 stream yang-push
 update-policy periodic 100
 receiver ip address 172.16.0.10 57000 protocol grpc-tcp
exit- For interface statistics, we need 2 different telemetry subscriptions configured. The first one for rx-kbps metrics data, and the other one for tx-kbps metrics data. We’ll use the same configuration as before except the XPath filter
telemetry ietf subscription 3
 encoding encode-kvgpb
 filter xpath /interfaces-ios-xe-oper:interfaces/interface/statistics/rx-kbps
 source-address 172.16.0.1
 stream yang-push
 update-policy periodic 100
 receiver ip address 172.16.0.10 57000 protocol grpc-tcp
 exit
telemetry ietf subscription 4
 encoding encode-kvgpb
 filter xpath /interfaces-ios-xe-oper:interfaces/interface/statistics/tx-kbps
 source-address 172.16.0.1
 stream yang-push
 update-policy periodic 100
 receiver ip address 172.16.0.10 57000 protocol grpc-tcp
exit- End the configuration and save it
end
write- Verify the configuration
show telemetry ietf subscription all
show telemetry ietf subscription 1 detail
show telemetry ietf subscription 2 detail
show telemetry ietf subscription 3 detail
show telemetry ietf subscription 4 detail
D. Configure Data Stream Visualization in Grafana
- Login to Grafana as Admin User
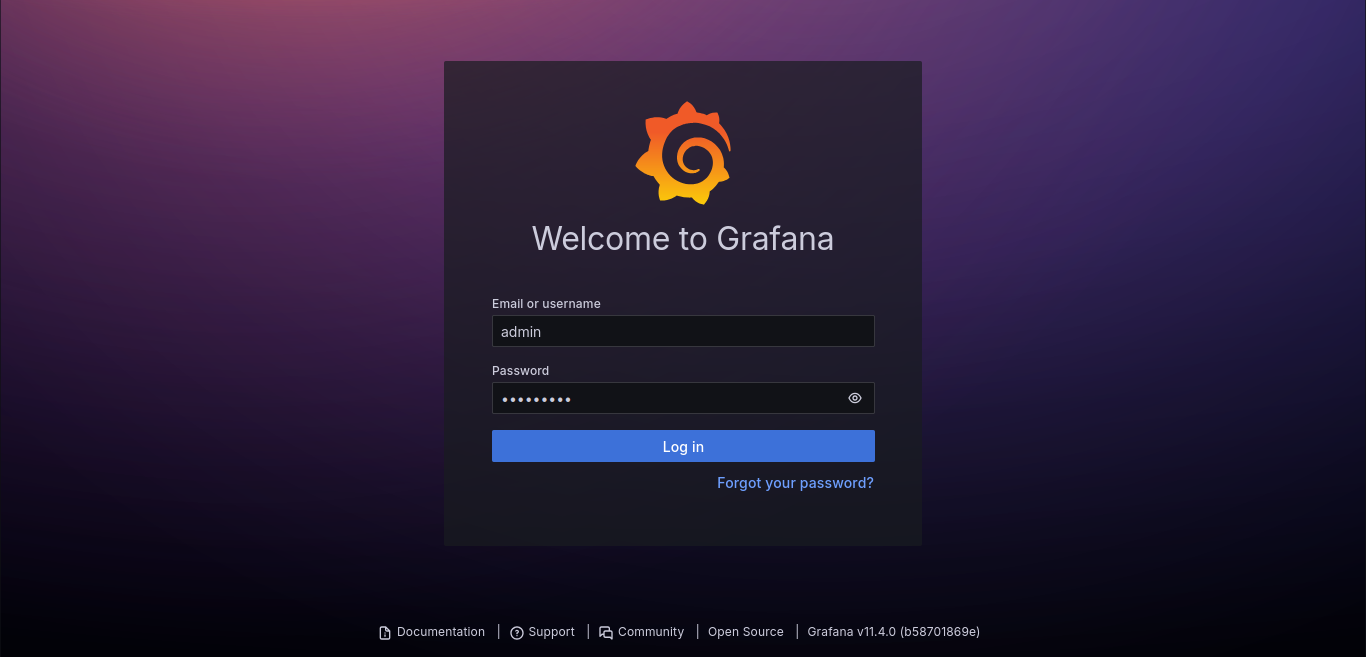
Grafana login Page
- Go to Menu > Connections > Add new connection. Search for InfluxDB data source type
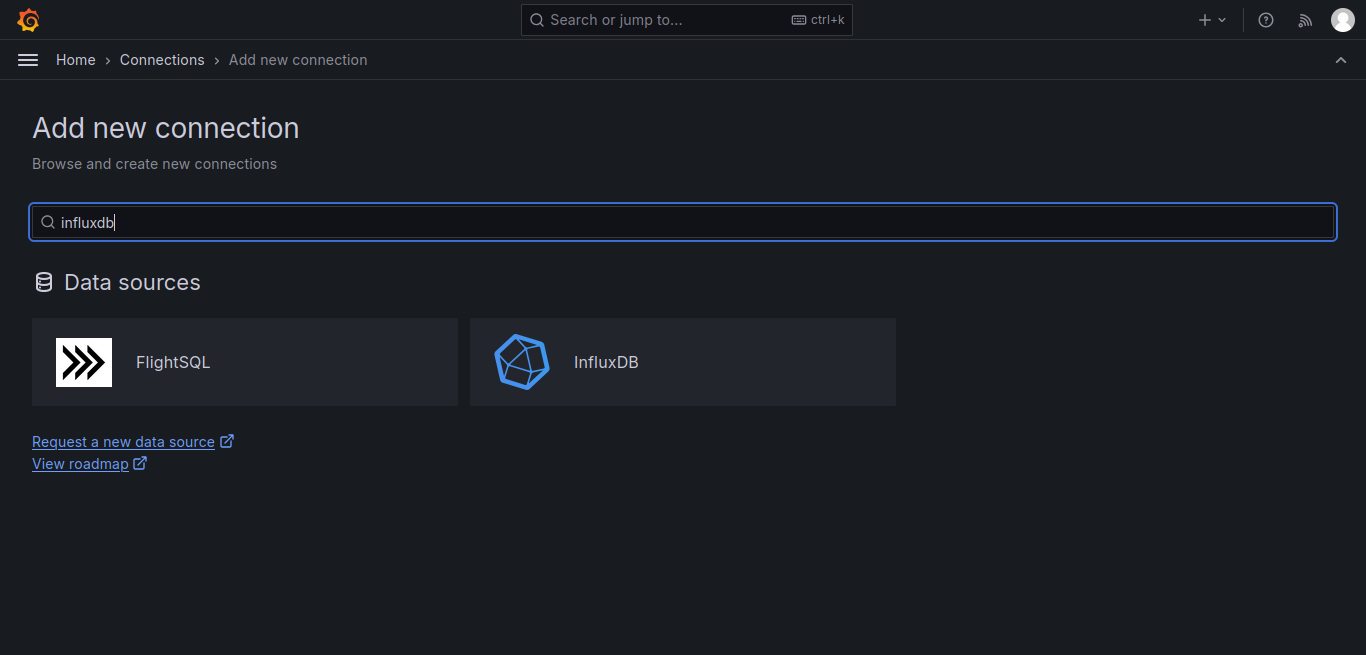
Add a new Grafana Data Source
- Click InfluxDB, then add a new InfluxDB data source. Configure these mandatory settings:
- Name: Choose data source name of your own
- Query Language: InfluxQL
- URL: InfluxDB2 Service URL. For a normal / default deployment, It should be
http://<InfluxDB2_Server_Address>:8086- Database: Bucket name in InfluxDB2 that will be used to store monitoring data stream - User: Admin username that has been configured in InfluxDB2
- Password: Auth token string that has been generated and retrieved before to access the monitoring bucket in InfluxDB2
Adjust another settings if needed. After that, Save & test the data source and make sure It’s working

Grafana Data Source Configuration and Test Result
- Go to Menu > Dashboards, and then create a New Dashboard

Grafana New Empty Dashboard
- Go to Settings, adjust all needed configuration (For example: Title), and then Save Dashboard
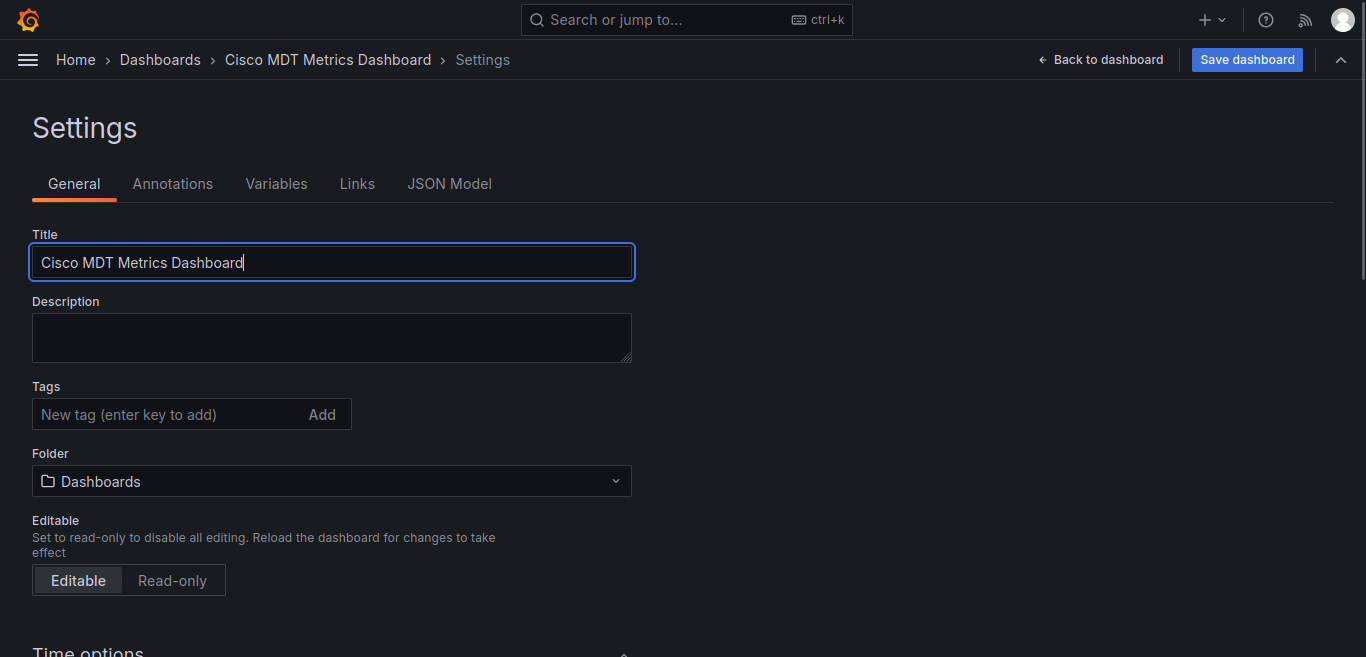
Grafana Dashboard Settings
- Go back to the dashboard view, then add a new visualization. Choose the configured InfluxDB data source as data source. Here, we’ll visualize data stream for CPU usage metrics. Configure these settings:
- Panel options > Title: Panel name of your choice
- Standard options > Unit: Choose Misc > Percent (0–100)
- Queries > A > FROM:
Default|Cisco-IOS-XE-process-cpu-oper:cpu-usage/cpu-utilization** - Queries > A > SELECT:**
field (five_seconds)|mean ()
After that, save the dashboard

Grafana Panel for CPU usage Visualization
- Go back to the dashboard view and add a new visualization for memory usage. Configure these settings:
- Panel options > Title: Panel name of your choice
- Standard options > Unit: Choose Data > bytes(SI)
- Queries > A > FROM:
Default|Cisco-IOS-XE-memory-oper:memory-statistics/memory-statistic** - Queries > A > SELECT:**
field (used_memory)|mean ()
Then, save the dashboard

Grafana Panel for Memory usage Visualization
- For interface statistics, We’ll add 2 panels in this lab:
- Panel for rx-kbps and tx-kbps for interface GigabitEthernet1
- Panel for rx-kbps and tx-kbps for interface GigabitEthernet2
First, we’ll create it for GigabitEthernet1. Go back to the dashboard view and add a new visualization. Configure these settings:
- Panel options > Title: Panel name of your choice
- Standard options > Unit: Choose Data rate> kilobytes/sec
- Queries > A > FROM:
Default|Cisco-IOS-XE-interfaces-oper:interfaces/interface/statistics- Queries > A > WHERE (Add a new WHERE clause): Click +, choose name::tag. For tag value, select **GigabitEthernet1 - Queries > A > SELECT:**
field (rx_kbps)|mean ()
After that, add a new query (Query B) and configure it like this:
- Queries > B > FROM:
Default|Cisco-IOS-XE-interfaces-oper:interfaces/interface/statistics- Queries > B > WHERE (Add a new WHERE clause): Click +, choose name::tag. For tag value, select **GigabitEthernet1 - Queries > B > SELECT:**
field (tx_kbps)|mean ()
After configuring, save the dashboard

Grafana Panel for Interface Statistics Visualization (GigabitEthernet1)
- For GigabitEthernet2 statistics visualization, Go to the dashboard view and Duplicate the GigabitEthernet1 statistics visualization. Edit the clone like this:
- Change the Panel options > Title value - Change the WHERE clause for Queries A and B to name::tag = GigabitEthernet2
Make sure the configuration is adjusted, and then save the dashboard
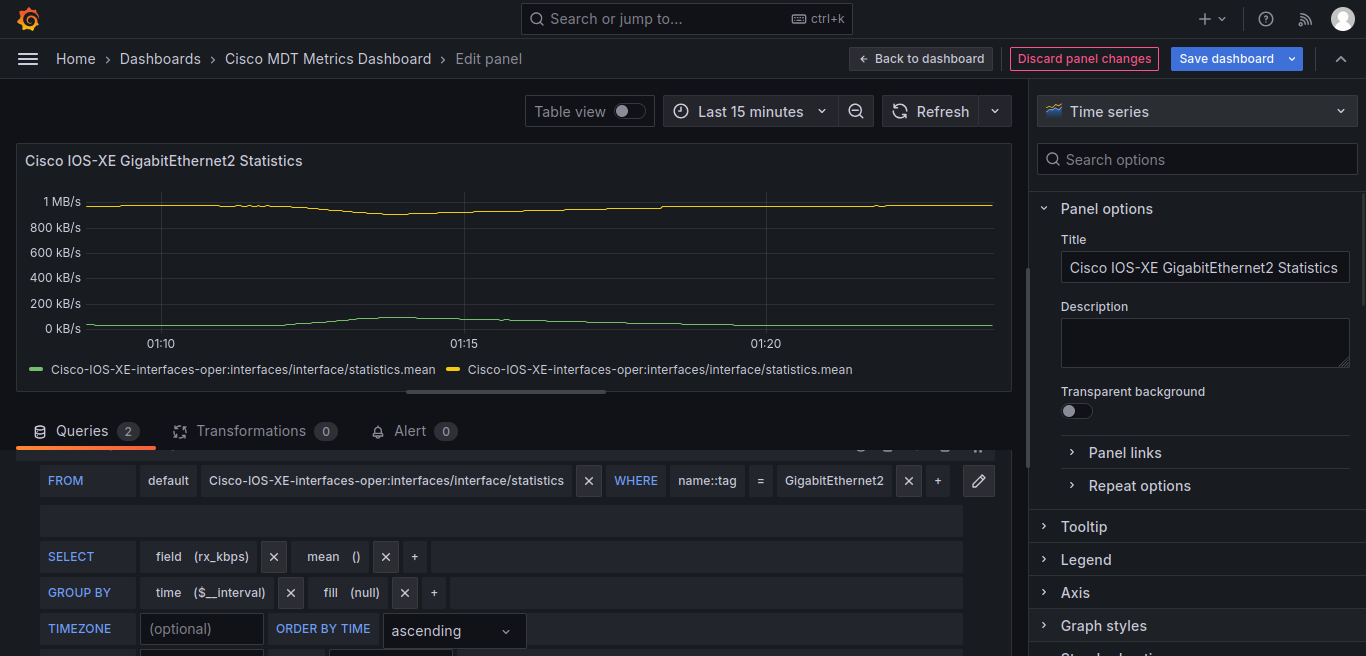
Grafana Panel for Interface Statistics Visualization (GigabitEthernet2)
- Your Grafana dashboard is ready to use for observability and monitoring, utilizing streaming data collected from Cisco IOS-XE’s MDT
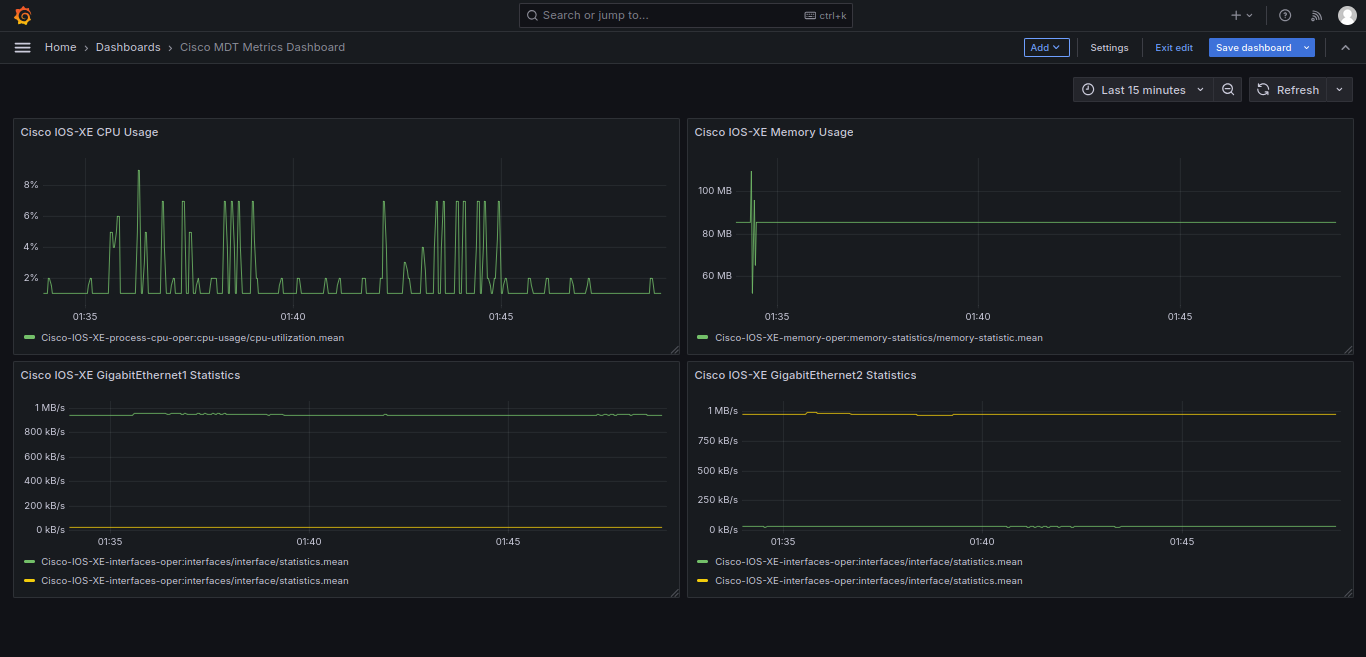
Grafana Dashboard containing CPU usage, Memory usage, and Interface statistics from Cisco IOS-XE’s MDT
References:
- https://www.cisco.com/c/en/us/support/docs/wireless/catalyst-9800-series-wireless-controllers/222054-configure-advanced-grpc-workflow-with-te.html
- https://www.cisco.com/c/en/us/td/docs/ios-xml/ios/prog/configuration/172/b_172_programmability_cg/model_driven_telemetry.html
- https://docs.influxdata.com/telegraf/v1/install/#download-and-install-telegraf
- https://docs.influxdata.com/influxdb/v2/install/?t=Linux#choose-the-influxdata-key-pair-for-your-os-version
- https://docs.influxdata.com/influxdb/v2/get-started/setup/?t=Set+up+with+the+CLI
- https://docs.influxdata.com/influxdb/cloud/admin/tokens/create-token/
- https://developer.cisco.com/yangsuite/
메타데이터
- post_id
- 76def72257ea
- slug
- implementing-cisco-ios-xe-monitoring-using-model-driven-telemetry-with-telegraf-influxdb2-and-76def72257ea
- url
- https://medium.com/@kevintim/implementing-cisco-ios-xe-monitoring-using-model-driven-telemetry-with-telegraf-influxdb2-and-76def72257ea
- canonical_url
- https://medium.com/@kevintim/implementing-cisco-ios-xe-monitoring-using-model-driven-telemetry-with-telegraf-influxdb2-and-76def72257ea
- author_url
- https://medium.com/@kevintim
- status
- ok
- fetched_at
- 2026-06-26 21:52:29