TFPlanBuilder: See Every Infrastructure Change Before You Apply It
I had an idea. I wrote one page describing it. Kiro built the rest. Here’s what that looks like — and how it actually works
TFPlanBuilder: See Every Infrastructure Change Before You Apply It
I had an idea. I wrote one page describing it. Kiro built the rest. Here’s what that looks like — and how it actually works

Part 1: Kiro — The IDE That Builds From Intent
The Problem With “AI That Writes Code”
Most AI coding tools operate at the line level. You describe a function, it writes the function. You describe a class, it writes the class. The result is code that works in isolation but doesn’t cohere — no consistent architecture, no shared conventions, no documented decisions.
Kiro is designed differently. It doesn’t start at the code. It starts at the intent and works down through requirements, design, and tasks before touching a file.
Step 1: Solution Intent
The entry point to any Kiro session is a solution intent — a short document that answers:
- What are we building?
- Why does it exist? What problem does it solve?
- Who uses it and how?
- What are the non-negotiable constraints?
For this project, mine was roughly this:
What: A visualization tool that renders
terraform planoutput as an animated city skyline — creates as rising buildings, updates as scaffolding, destroys as wrecking balls.
Why:
terraform planis dense text. Walls ofwill be created,will be destroyed. You can read it, but you can't see it. A visual metaphor makes changes immediately understandable without reading every line.
Who: Platform engineers reviewing infrastructure PRs. DevOps teams doing a sanity check before
terraform apply. Anyone who needs to understand what's about to change at a glance.
Constraints: No data should leave the browser. Must work as both a hosted web app and a local CLI. Zero setup friction for the CLI.
Then I hit go. That’s the only prompt.
Why Intent First?
The intent document isn’t just context for Kiro — it’s a filter. Every downstream decision gets evaluated against it. The constraint “no data leaves the browser” became three specific security requirements (NFR-3). The constraint “zero setup friction” became a functional requirement to use only Node.js built-in modules (FR-3.5).
Intent also tells Kiro what not to build. A tool whose purpose is “make terraform plans understandable at a glance” doesn’t need a database, a user account system, a backend API, or authentication. Kiro filtered all of that out before the requirements were even written.
The hierarchy:
Solution Intent       →  why we're building this
    └── Requirements  →  what it must do
            └── Design     →  how it works
                    └── Tasks       →  what to implement
Step 2: Specs — Requirements, Design, Tasks
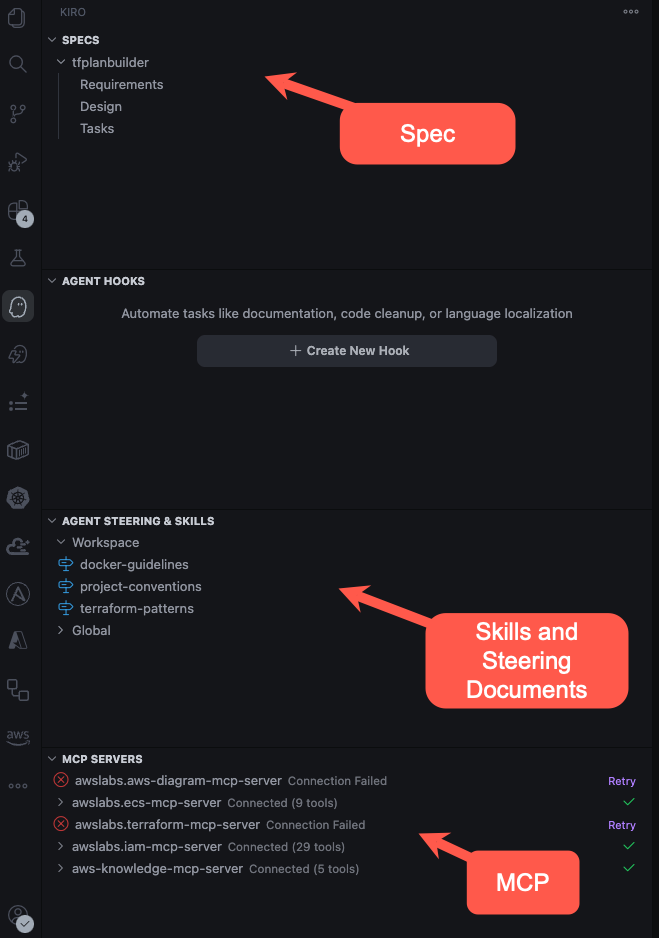
From the intent, Kiro generated a full spec living at .kiro/specs/tfplanbuilder/.
requirements.md
Functional and non-functional requirements, derived from intent:
FR-1: Plan Visualization
  FR-1.1  Accept terraform plan text (raw CLI format)
  FR-1.2  Accept terraform show -json JSON format
  FR-1.3  Animate creates as buildings rising with a crane
  FR-1.4  Animate updates/replaces as scaffolding
  FR-1.5  Animate destroys as wrecking ball + rubble
  FR-1.6  Color buildings by provider (AWS=orange, Azure=blue, GCP=green)
  FR-1.7  Shape buildings by resource type (storage=silo, db=tank, default=tower)
FR-2: Click-to-Inspect
  FR-2.1  Click any building to open an inspector panel
  FR-2.2  Show resource address, provider, type, name, module path
  FR-2.3  Show attribute-level diff (before → after) when JSON data is available
FR-3: CLI Tool
  FR-3.5  Zero external dependencies (Node.js built-ins only)
  FR-3.6  Available as both `tfplanbuilder` and `tfpb`
NFR-3: Security
  Container runs as non-root user
  nginx serves security headers
  No data leaves the browser - all parsing is client-side
  CLI binds to 127.0.0.1 only
design.md
Architecture decisions with rationale — not just what but why:
- Why nginx over Python’s
http.server(multi-process, gzip, security headers, ~11MB Alpine image) - Why a single NAT gateway (cost-optimized for non-prod; acceptable trade-off at this scale)
- Why ECS Express Mode over traditional ECS+ALB (eliminates ~150 lines of ALB/listener/target-group/security-group Terraform)
- Why request-count-per-target for auto-scaling (correct metric for a web app serving variable-size static content)
tasks.md
52 implementation tasks across 11 phases, generated before any code was written:
Phase 1: Application Layer        (Docker, nginx, health check)
Phase 2: Networking Module        (VPC, subnets, NAT, routes)
Phase 3: ECR Module               (repo, lifecycle policies)
Phase 4: ECS Express Module       (cluster, IAM, gateway service)
Phase 5: Root Terraform           (wiring modules, variables, outputs)
Phase 6: CI/CD Pipeline           (OIDC, build, push, deploy)
Phase 7: CLI Tool                 (server, stdin, browser open)
Phase 8: Click-to-Inspect         (panel, diff rendering)
Phase 9: Parser Enhancements      (modules, for_each, provider detection)
Phase 10: Developer Experience    (Makefile, README, blog)
Phase 11: Kiro Configuration      (steering files, spec documents)
Kiro worked through each phase sequentially. When a task was complete, it checked it off and moved to the next. The CLI wasn’t an afterthought — because the intent said “must work as a local CLI,” Phase 7 was in the spec from the start.
Step 3: Steering Files — Persistent Guardrails
Specs define what to build. Steering files define how to build it — and they persist across the entire session, not just a single prompt.
Steering files live in .kiro/steering/. Each one can be configured to load globally or only when specific file types are touched:
.kiro/steering/
├── project-conventions.md    → always loaded
├── terraform-patterns.md     → fileMatch: **/*.tf
└── docker-guidelines.md      → fileMatch: **/Dockerfile
What Each Steering File Contains
**project-conventions.md** (always active):
- Use Terraform >= 1.6 with AWS provider ~> 6.0
- Every module must have
main.tf,variables.tf,outputs.tf - All variables must have
descriptionandtype - Use
localsfor name prefixes:"${var.project_name}-${var.environment}" - Prefer
for_eachovercountfor individually-addressable resources - Never commit
.tfvarsfiles - Use OIDC federation over long-lived access keys in CI/CD
- CLI: zero external dependencies, support stdin and
--file, exit 0/1
**terraform-patterns.md* (loads when editing `.tf`):
- ECS Express Mode resource model: what you provide vs. what AWS manages
- Correct IAM role ARNs:
AmazonECSTaskExecutionRolePolicyandAmazonECSInfrastructureRoleforExpressGatewayServices - Variable convention template with
validationblock - Resource naming pattern:
"${var.project_name}-${var.environment}-<purpose>" - S3+DynamoDB state backend config (commented, ready to enable)
**docker-guidelines.md** (loads when editing Dockerfiles):
- Pin to specific minor versions (
nginx:1.27-alpine, notnginx:alpine) - Run as non-root user (
USER nginx) - Required
HEALTHCHECKformat:
HEALTHCHECK --interval=10s --timeout=3s --start-period=5s --retries=3 \     CMD wget --quiet --tries=1 --spider http://localhost:8080/ping || exit 1
Application port is 8080 internally, health endpoint is /ping
Leverage Docker layer caching in CI (cache-from/cache-to)- These rules applied automatically. When Kiro wrote the Dockerfile, it used
nginx:1.27-alpinewithout being asked. When it wrote Terraform, variables haddescription,type, andvalidationblocks without being reminded. The steering file was active.
The value compound over time. A new team member — human or another AI agent session — gets the same guardrails from day one without needing to know the conventions exist.
Step 4: Hooks — Automated Feedback Loops
Hooks fire on specific events and close the feedback loop automatically. Kiro doesn’t wait to be asked to validate — it validates when the relevant file is saved.
TriggerActionDockerfile saveddocker build — verify the image builds*.tf file savedterraform validate — catch syntax errors immediatelyindex.html changedCLI restarted, / fetched — confirm page loadsSpec file updatedTasks flagged for review if requirements changed
The hook that mattered: after every change to index.html, the CLI server restarted and fetched the root path. When the inspector panel was added, this caught a JavaScript syntax error in the slide-out animation before it made it into the Docker image.
This is the difference between “I should run terraform validate after I save" and "it just runs." The feedback loop compresses from minutes to seconds, and it can't be forgotten.
Step 5: Research Capability
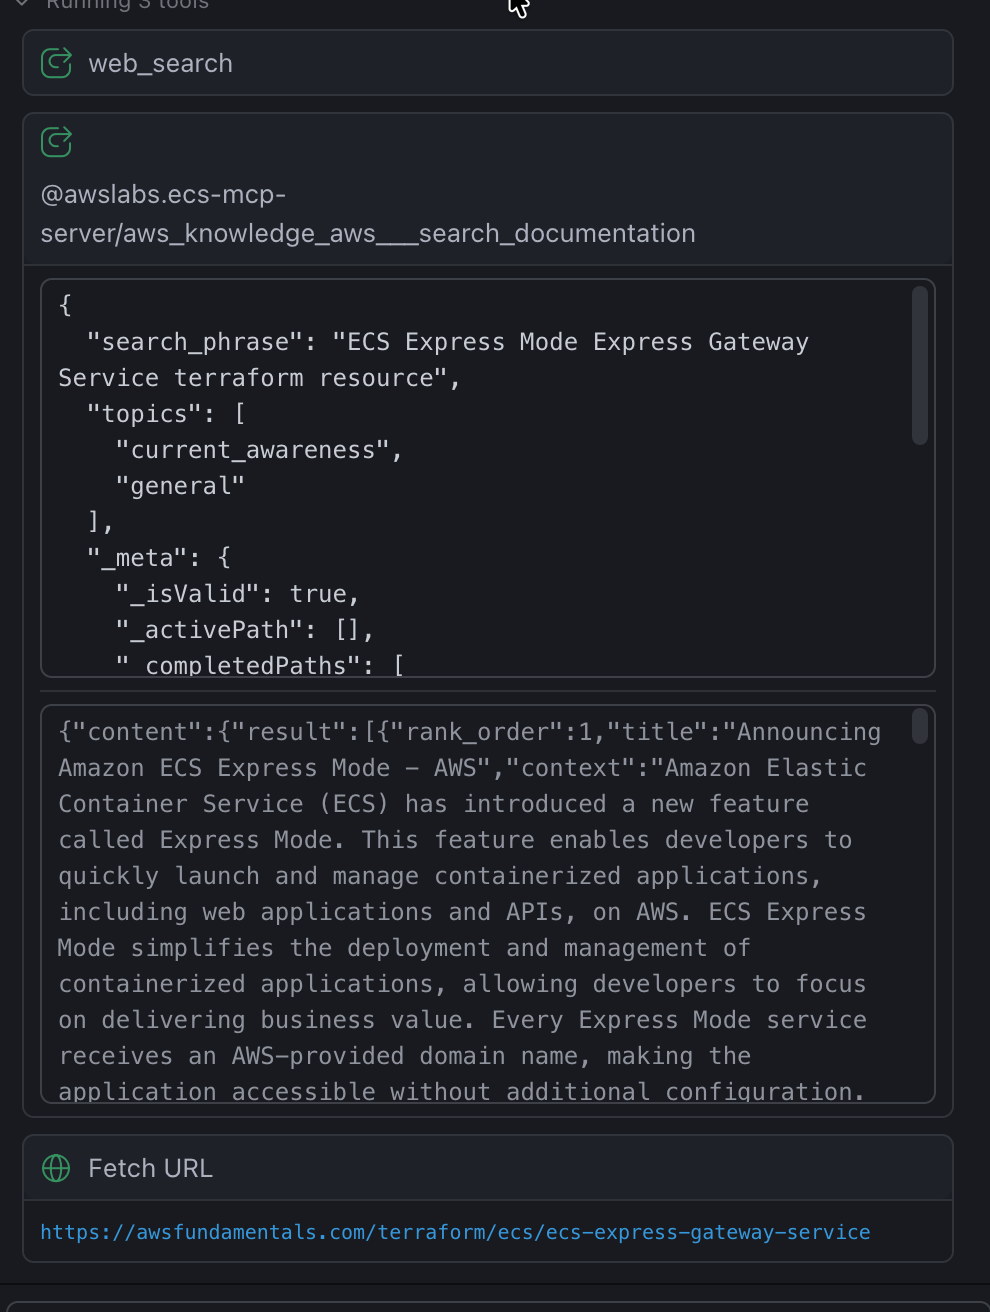
ECS Express Mode launched November 2025 — after most LLMs’ training cutoff. Kiro had no memorized patterns for it.
Instead, it used its documentation tools to read:
- The CloudFormation resource spec for
AWS::ECS::ExpressGatewayService - The CLI reference for
aws ecs create-express-gateway-service - The IAM getting-started guide for the required trust policies
From those, it synthesized working Terraform — including the correct managed policy ARNs, the trust relationship structure for both IAM roles, and the understanding that Express Mode manages the ALB, TLS, target groups, and auto-scaling so you don’t have to declare them.
Part 2: TFPlanBuilder — Your Infrastructure Plan, Visualized as a Living City
The Terraform Plan Problem
Every terraform apply starts with a plan review. You run terraform plan, and Terraform compares three things: your configuration files (what you want), the state file (what it last deployed), and the actual cloud infrastructure (what's really there). The diff becomes the plan.
The output is accurate. It’s complete. But it’s a wall of text — sometimes hundreds of lines for a non-trivial change. You scan line by line, building a mental model of what will change, what will be destroyed, what’s being replaced under the hood. Miss one line and you might approve a destroy you didn’t intend.
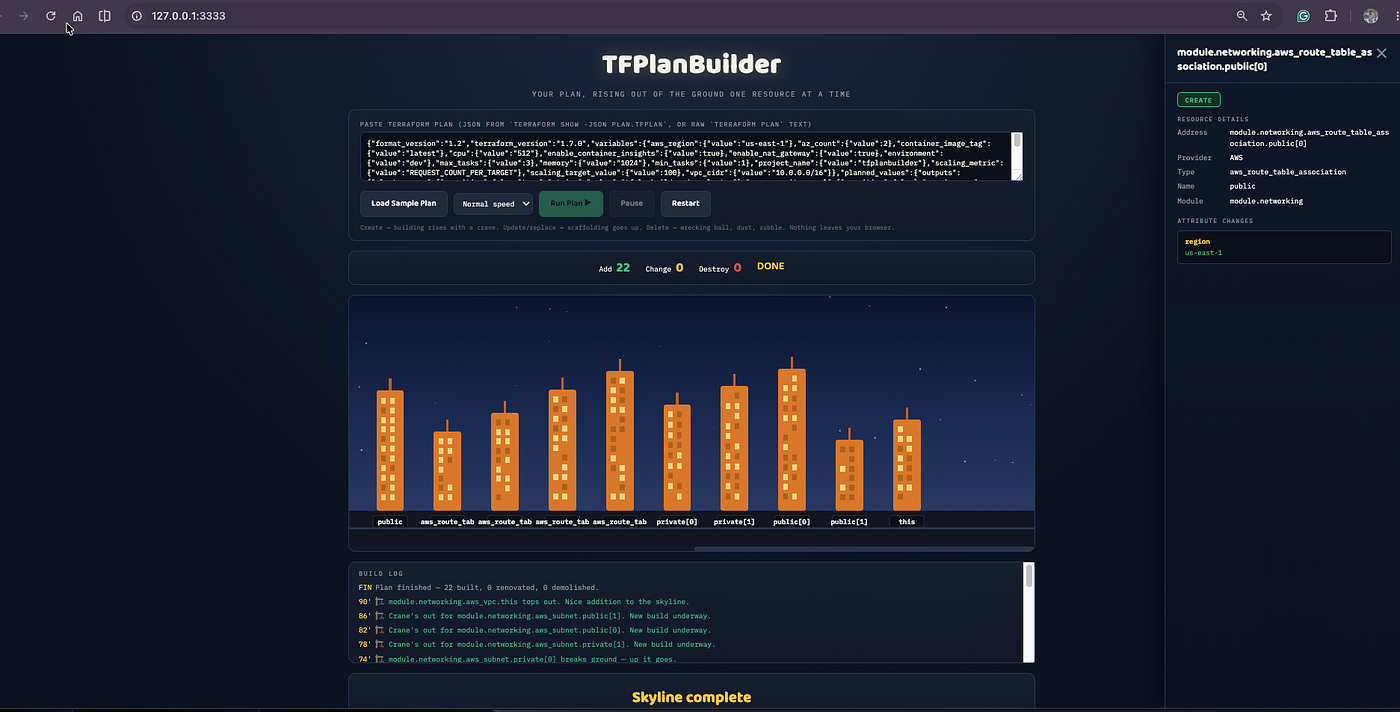
TFPlanBuilder solves this by turning that wall of text into a city skyline you can read in seconds. Every resource is a building. Every action has a distinct visual — cranes for creates, scaffolding for updates, wrecking balls for destroys. The same plan you’d spend ten minutes reading becomes something you can assess at a glance.
Where the Data Comes From: Terraform’s Plan JSON
Terraform has two plan output formats. Understanding both is key to how TFPlanBuilder works.
Format 1: Raw plan text
When you run terraform plan, the output is human-readable text:
# aws_vpc.main will be created
# aws_subnet.public["a"] will be created
# module.ecs.aws_ecs_cluster.this will be created
# aws_s3_bucket.legacy will be destroyed
It tells you what is changing and how, but nothing about the attribute values — the actual CIDR ranges, ARNs, configuration details. It’s a summary.
Format 2: Machine-readable JSON
When you run terraform plan -out=plan.tfplan followed by terraform show -json plan.tfplan, Terraform serializes the full plan into a structured JSON file. This is the richer format.
The JSON contains a resource_changes array where each entry describes one resource change in full detail:
resource_changes[n]
  ├── address          "module.networking.aws_vpc.main"
  ├── type             "aws_vpc"
  ├── name             "main"
  ├── module_address   "module.networking"
  ├── provider_name    "registry.terraform.io/hashicorp/aws"
  └── change
        ├── actions    ["create"]          ← or ["update"], ["delete"], ["create","delete"]
        ├── before     { cidr_block: null, ... }   ← current state (null for creates)
        └── after      { cidr_block: "10.0.0.0/16", enable_dns_support: true, ... }
The actions array can hold a single action (["create"], ["update"], ["delete"]) or a compound ["create", "delete"] — which means the resource must be destroyed and recreated because an attribute cannot be updated in place. That compound case is what Terraform calls a replace, and it's one of the most important things to catch in a plan review because it causes downtime for stateful resources.
The before and after objects contain the full attribute state of the resource — every field that Terraform knows about. For a VPC being created, before is empty and after holds every attribute that will be set. For a security group rule being updated, both before and after are populated with the old and new values side by side.
The State File’s Role
The JSON plan is not generated in isolation. Terraform produces it by comparing your .tf configuration against the current terraform.tfstate — a JSON file that records every resource Terraform last deployed, including all its attributes as they existed at apply time. When a resource's current state diverges from what the state file says (drift), or the configuration differs from the state file, a plan change is generated.
The plan JSON captures all of this: not just which resources are changing, but exactly which attributes changed, from what value to what value. That attribute diff is what powers the inspector panel in TFPlanBuilder.
How TFPlanBuilder Uses the Plan
The tool accepts both formats. When it receives JSON, it reads the full resource_changes array and keeps the complete before/after data in memory for each resource — that's what populates the inspector when you click a building. When it receives raw plan text, it parses the summary lines to get the resource addresses and actions, but the inspector can only show metadata, not the attribute diff (that data simply isn't in the text output).
This means: pipe JSON for full detail, paste text for the overview. Both are valid. The visualization is identical either way.
Reading the Address
The resource address in the plan JSON carries a lot of information:
module.networking.aws_vpc.main
│                  │        │
│                  │        └─ resource name (logical name in your .tf)
│                  └────────── resource type (determines provider and shape)
└───────────────────────────── module path (may be nested: module.a.module.b)
For resources created with for_each, the address includes the key: aws_subnet.public["a"] or aws_subnet.public[0]. TFPlanBuilder handles all of these correctly — stripping the index, resolving the module path, and extracting the resource type to determine color and shape.
From Address to Building

Each resource in the plan becomes a building on the skyline. Three visual properties are determined from the address alone:
Color → cloud provider. The resource type prefix reveals the provider. aws_* resources are rendered in amber-orange (AWS's brand color). azurerm_* resources are blue. google_* and gcp_* resources are green. Resources from other providers get a neutral grey. In a multi-cloud plan, the provider split is visible instantly — no need to read type prefixes.
Shape → resource category. Storage resources (S3 buckets, storage accounts, GCS buckets) render as silos — a tall rounded shape that visually reads as a container. Database resources (RDS instances, SQL servers, ElastiCache clusters) render as squat tanks with a dome roof. Everything else — compute, networking, IAM, ECS, Lambda — renders as a tower with an antenna.
Height → consistent identity. The building height is derived from a hash of the resource address. The same address always produces the same height. This means the skyline is reproducible: if you run terraform plan twice and the same resources appear, they produce the same city layout. The skyline is a fingerprint of the plan.
The Two Modes
TFPlanBuilder ships as the same single-page application in two delivery modes. The visualization engine, the parser, the inspector — all identical. What differs is how the plan data gets in and how the session is initiated.
CLI Mode — For Engineers in the Terminal
The CLI is designed for engineers who live in the terminal and want to visualize a plan without leaving their workflow.
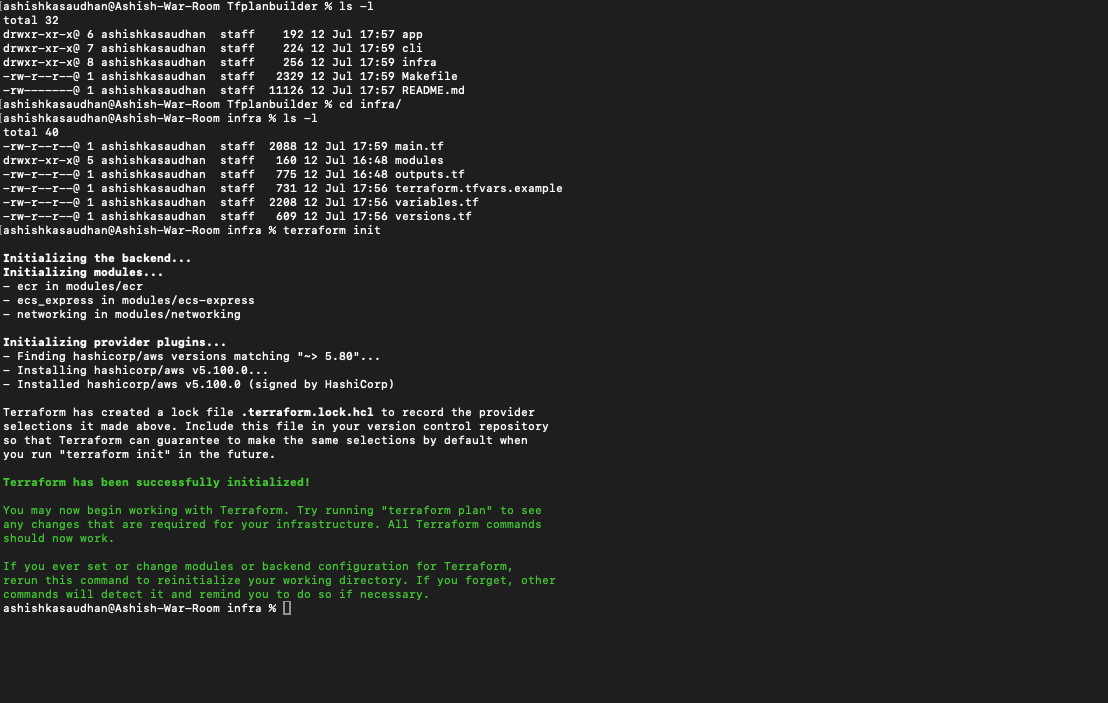
# From a saved plan file
terraform plan -out=plan.tfplan
terraform show -json plan.tfplan | tfpb
# Or directly from a JSON file
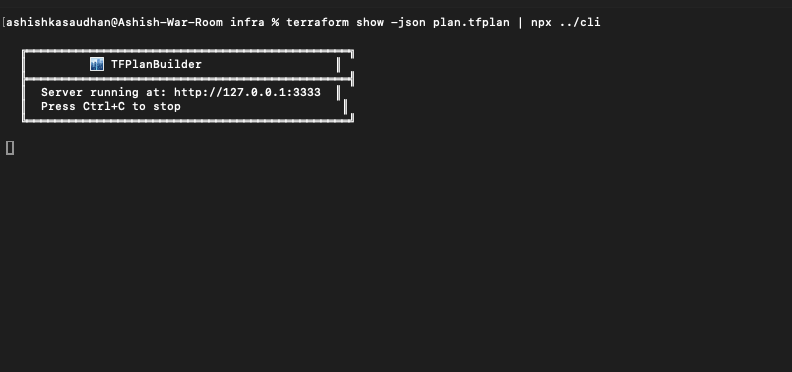
tfpb --file plan.jsonWhen you run the CLI:
- The CLI reads the plan — either from stdin (piped input) or from a file path. It validates that data was provided and holds it in memory.
- A local HTTP server starts on
127.0.0.1:3333— binding to localhost only, so the plan data is never reachable from the network even for a fraction of a second. - The browser opens automatically — the CLI detects your platform (macOS, Windows, Linux) and uses the appropriate system command to open the URL.
- The visualization auto-starts — the page silently fetches the plan data from the local server’s
/api/planendpoint, populates the input, and begins the animation immediately. You don't click anything; you just watch your plan come to life.
The entire session is local. The plan data lives in the CLI process’s memory and is served only to 127.0.0.1. When you Ctrl-C, the server shuts down and the data is gone.
This mode is best for: regular plan reviews in CI/CD validation, quick checks before a large apply, or any workflow where you already have a plan file and want a fast visual confirmation.
Web UI Mode — For Teams and Shared Reviews
The hosted version runs as a containerized web app on ECS Express Mode. Anyone on the team can access it via a browser — no CLI install, no Node.js required.
The workflow:
- Run
terraform planorterraform show -json plan.tfplanin your terminal - Open the tool in your browser
- Paste the output into the textarea — either raw plan text or JSON
- Click Run Plan ▶
The visualization runs entirely inside the browser. The plan data never leaves the client — it’s parsed and rendered in JavaScript without any network request to a backend. You can paste a production plan with real VPC CIDRs, real ARNs, real database connection strings, and none of that data is transmitted anywhere.
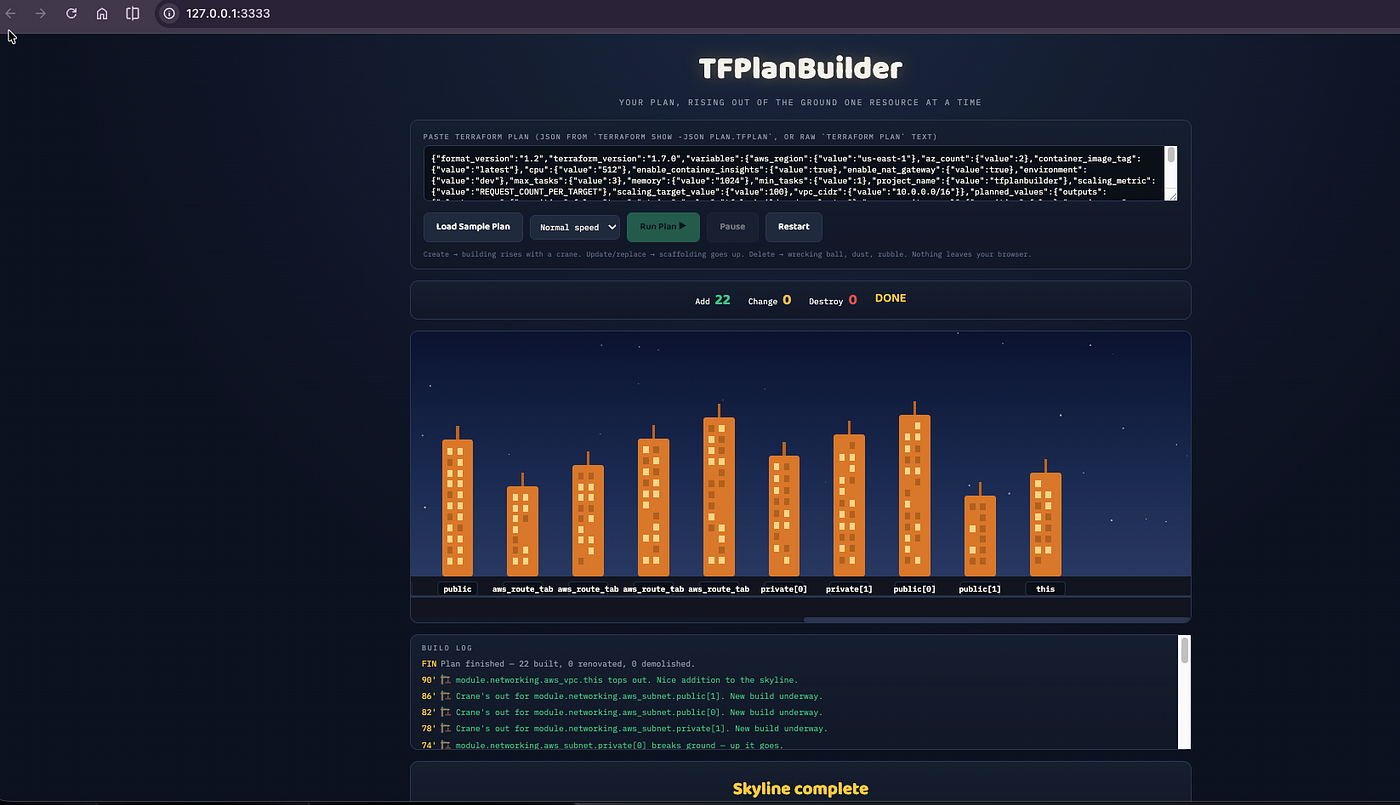
The UI also provides:
- Speed control — Normal, Fast, Slow — for plans with many resources where you want to watch at your own pace or fast-forward
- Pause and Resume — stop the animation mid-plan to inspect a resource before the next one animates in
- Load Sample Plan — a built-in demo plan with AWS, Azure, creates, updates, and destroys, so you can try the tool without having a real plan on hand
This mode is best for: team plan reviews during PR checks, demos, and onboarding new engineers who have never visualized a Terraform plan before.
The Click-to-Inspect Panel
Both modes share the same inspector. Click any building in the skyline — at any point during or after the animation — and a panel slides in from the right.
For plans fed from JSON (terraform show -json), the inspector shows:
- Resource address — the full address including module path and for_each key
- Provider — resolved from the resource type prefix
- Type and name — the Terraform resource type and the logical name from your config
- Module path — where in the module hierarchy this resource lives
- Attribute diff — every attribute that changed, with the before value and after value side by side
The attribute diff reads directly from the before and after objects in the plan JSON — the same data that Terraform itself uses to decide what to change. Creates show new values in green. Destroys show old values in red. Updates and replaces show the old value struck through and the new value next to it.
For plans fed from raw text, the inspector still shows the address, type, name, and module path — extracted by parsing the address string — but the attribute diff is unavailable because the text format doesn’t include it.
The inspector is how you go from “I can see something is being destroyed” to “I can see exactly which attribute changed and why.” It’s the bridge between the visual overview and the detail you need to actually approve the plan.
The Benefits, in Plain Terms
You see the full plan simultaneously, not line by line. A 50-resource plan is a city. Destroys are immediately alarming — wrecking balls and rubble are hard to miss. Creates are satisfying. Updates are calm. The visual vocabulary matches the operational risk of each action.
Multi-cloud plans are readable at a glance. The color split between orange, blue, and green buildings tells you at a glance how much of the plan is AWS vs Azure vs GCP. You don’t need to read type prefixes to understand the blast radius.
The inspector replaces terminal scrolling. Instead of scrolling back through hundreds of plan lines to find a specific resource block, you click the building and see exactly what’s changing. The diff is already formatted.
Your plan data never leaves your machine. In CLI mode it stays in the local process. In web UI mode it stays in the browser tab. This matters for production plans that contain sensitive configuration values.
It works with what you already have. You don’t need a special export or a plugin. terraform plan text or terraform show -json output — both work, and you almost certainly already run one of these commands as part of your review process.
The Infrastructure Behind the Hosted Version
The web app itself is a single static HTML file served by nginx. The entire visualization — parser, renderer, animation engine, inspector — runs in the browser. nginx’s only job is to serve the file and respond to health checks.
That simplicity made the hosting straightforward. Three Terraform modules:
Networking — a VPC with public and private subnets across two availability zones. The nginx containers run in private subnets with no public IPs. Outbound internet access goes through a single NAT gateway (one per region rather than one per AZ — cost-optimized for a non-critical tool).
ECR — an Elastic Container Registry repository that stores the nginx image. Images are scanned for vulnerabilities on push. A lifecycle policy keeps the last ten tagged images and purges untagged images after seven days.
ECS Express Mode — the entire compute and serving layer is managed by a single aws_ecs_express_gateway_service resource. Express Mode provisions the Application Load Balancer, HTTPS listener, ACM certificate, target groups, security groups, and auto-scaling policies automatically. What would be roughly 150 lines of ALB and ECS Terraform in a traditional setup is handled by this one resource. The service scales between one and three tasks based on request count, which is the right metric for a web app serving static content.
The CI/CD pipeline uses OIDC federation — the GitHub Actions workflow assumes an IAM role via a short-lived token rather than storing long-lived AWS access keys as secrets. Every push to main builds a new Docker image, pushes it to ECR, and deploys via terraform apply.
Try It
# Pipe a real plan (full attribute diff in inspector)
terraform plan -out=plan.tfplan
terraform show -json plan.tfplan | npx tfplanbuilder
# Or use a saved JSON file
npx tfplanbuilder --file plan.json
# Or paste raw plan text into the hosted web UI
make run
Your plan. Your data. On your screen.
Links
About the Author
I’m Ashish Kasaudhan, a DevOps and platform Architect working across infrastructure automation, cloud architecture, and enterprise container platforms. I write about the mechanics behind AWS and DevOps tooling — what actually changed, not just the marketing summary.
If this was useful, I’d appreciate a connect on LinkedIn: linkedin.com/in/ashish-kasaudhan-713a4225
And if you’re reading this on Medium — a clap (or a few) helps this reach more devops/platform engineers. Comments and corrections are welcome, especially if you’ve already hit the Terraform provider gaps called out above.
메타데이터
- post_id
- 7785adf02faa
- slug
- tfplanbuilder-see-every-infrastructure-change-before-you-apply-it-7785adf02faa
- url
- https://blog.devops.dev/tfplanbuilder-see-every-infrastructure-change-before-you-apply-it-7785adf02faa
- canonical_url
- https://blog.devops.dev/tfplanbuilder-see-every-infrastructure-change-before-you-apply-it-7785adf02faa
- author_url
- https://medium.com/@ashishkasaudhan
- status
- ok
- fetched_at
- 2026-07-15 11:23:19