GraphicLayer vs FeatureLayer in ArcGIS For Javascript SDK
In the ArcGIS for JavaScript SDK, the GraphicLayer and FeatureLayer classes are commonly used to add graphics and display them on a map.
GraphicLayer vs FeatureLayer in ArcGIS For Javascript SDK
In the ArcGIS for JavaScript SDK, the GraphicLayer and FeatureLayer classes are commonly used to add graphics and display them on a map.
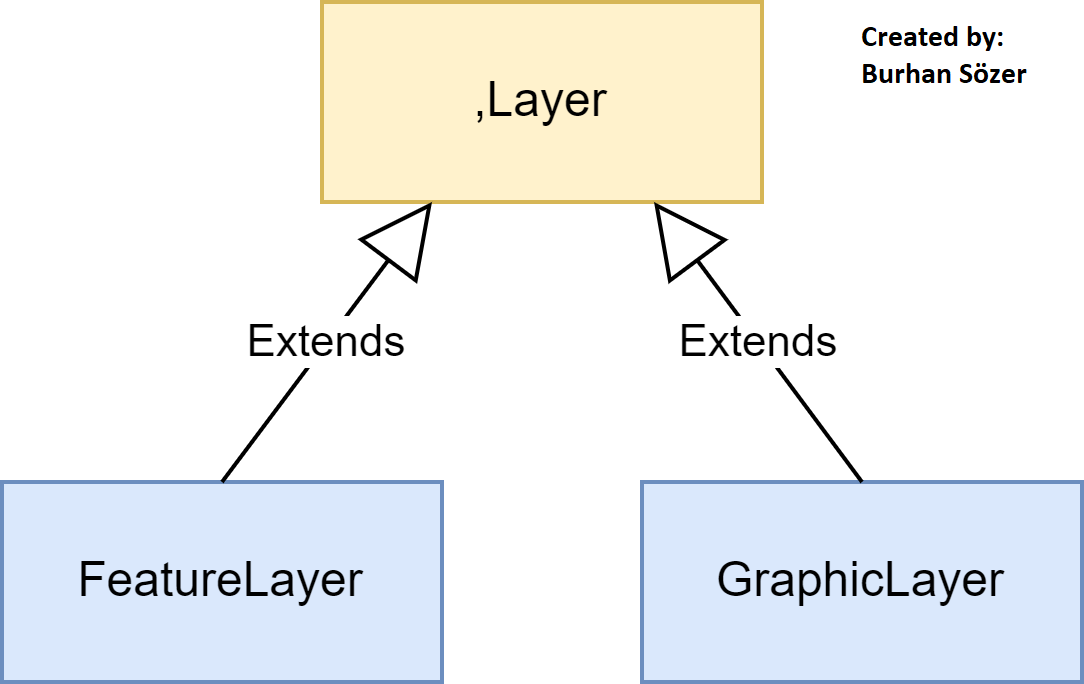
While both of these classes are inherited from the Layer class, they have distinct differences, and it’s important to understand when to use each of them.
GraphicLayer
It is rendered using a LayerView (either in MapView or SceneView) on the client-side, and it can contain one or more graphics.
Unlike FeatureLayer, GraphicsLayer does not have predefined schemas, so graphics can encompass various geometry types such as points, polygons, and lines.
Graphics within a GraphicsLayer can also incorporate different symbols and attributes. Notably, a GraphicsLayer cannot have an associated renderer.
When working with features of diverse geometry types, it’s more suitable to use a GraphicsLayer rather than adding graphics directly to the MapView.
To do that, the first step is creating a graphic.
function CreatePolyline() {
    let polyline = {
    type: "polyline",  // autocasts as new Polyline()
        paths: [
            [26.041667, 35.813056],
            [38.5675, 39.106389],
            [44.526389, 37.203056],
            [45.726389, 38.803056],
        ]
    };

    let polylineSymbol = {
    type: "simple-line",  // autocasts as SimpleLineSymbol()
    color: [226, 119, 140],
    width: 3
    };

    let polylineAtt = {
    Name: "TestLine",
    Owner: "BurhanSozer"
    };

    return new Graphic({
        geometry: polyline,
        symbol: polylineSymbol,
        attributes: polylineAtt
        });
}
Then, the created graphic object is added to the graphic layer to show on the map.
function AddGraphicLayerToMap() {
    const lineGraphic = CreatePolyline();
    const polygonGraphic = CreatePolygon();
    const graphicLayer = new GraphicsLayer();

    graphicLayer.graphics.add(lineGraphic)
    graphicLayer.graphics.add(polygonGraphic)

    // graphicLayer.addMany([lineGraphic, polygonGraphic])

    map.add(graphicLayer);
}j
FeatureLayer
Unlike GraphicLayer class, the FeatureLayer has many functionalities containing queries, analyzing and rendering to visualize data in a spatial context.
Only one geometry type is defined each Feature layer.
For instance, if the polygon type is specified, the array of graphics within the source property will exclusively contain polygons.
It contains features with attributes that provide information about spatial objects. These attributes can be viewed in a popup window and used for rendering the layer.
The rendering of FeatureLayer’s features as graphics in the View are performed by the FeatureLayerView.
Creating a FeatureLayer
1- Reference a service url:
Here, its ‘url’ property is set to the REST endpoint of the layer, which can be a Feature Service or a Map Service.
const polygonFeatureLayer = new FeatureLayer({
    url: "https://sampleserver6.arcgisonline.com/arcgis/rest/services/Census/MapServer/3"
});
In many situations, layers can be listened to and updated based on events.
When changing a layer view, the whenLayerView method can be utilized. Additionally, the watch method is useful to trace the defined object by an event type. After that, the traced object may be query in the server-side, so this is beneficial to increase performance in client-side.
Namely, the querying methods such as queryFeatures within the FeatureLayer class directly retrieve features from the service.
If you’d like to show this explanation with an example, it can be provided like below.
function AddFeatureLayerQueryInClientSide() {
    const polygonFeatureLayer = new FeatureLayer({
        url: "https://sampleserver6.arcgisonline.com/arcgis/rest/services/Census/MapServer/3"
    });
    map.add(polygonFeatureLayer);

    // when changing layer view
    view.whenLayerView(polygonFeatureLayer).then(layerView => {
        layerView.watch("updating", val => {
            if (!val) {
                layerView.queryFeatures({
                    // where: "STATE_NAME = 'Washington'"
                }).then(res => {
                    console.log(res.features.map(x => x.attributes));
                })
            }
        })

    })
}
2- Add client-side features:
FeatureLayer has a ‘source’ property defined as an array of graphics with geometry and attributes.
The ‘spatialReference,’ ‘geometryType,’ ‘hasZ,’ and ‘hasM’ properties can be extracted from the ‘source’ property. However, it’s important to note that after the initialization of a FeatureLayer, its source is not automatically updated.
If features are added, removed, or modified during runtime, it is recommended to use the ‘applyEdits()’ method to update the features and then use ‘queryFeatures()’ to retrieve the updated features.
The FeatureLayer class also has the ‘popupTemplate’ property to display content on the popup window.
To add a featurelayer that is created by an array of graphics in client-side, the method below can be used.
function AddFeatureLayerByGraphic() {
    const graphic = CreatePoint();
    const featureLayer = new FeatureLayer({
        source: [graphic],
        objectIdField: "OBJECTID",
        fields: [{
                name: "OBJECTID",
                type: "oid"
            }, {
                name: "Name",
                type: "string"
            }],
        geometryType: "point",
        spatialReference: view.spatialReference,
        popupTemplate: {
            content: "<img src='https://www.turkiyesehirrehberi.org/wp-content/uploads/2020/10/anitkabir-ankara.jpg'>"
        },
    });

    map.add(featureLayer);
}
3- Query in Server-Side
The primary method commonly used is executeQueryJSON(), which performs a query to obtain JSON results based on the parameters specified in the Query object provided to the function. executeQueryJSON() returns a Promise containing the features within the layer.
For example, when working with a feature layer representing cities around the world, and you want to retrieve features containing cities with a population exceeding 1,000,000 people, you can use the following code.
function AddFeatureLayerQueryInServerSide() {
    let queryUrl = "https://sampleserver6.arcgisonline.com/arcgis/rest/services/SampleWorldCities/MapServer/0";

    query.executeQueryJSON(queryUrl, {  // autocasts as new Query()
        where: "POP > 1000000"
    }).then((res) => {
        console.log(res?.features.map(x => x.attributes.CITY_NAME));
    }, (error) => {
        console.log(error);
    })

};
Result
- The FeatureLayer is used to represent service-based data and often points to an external service within a web map or web mapping application.
- The FeatureLayer provides capabilities for dynamic data access, editing, and querying. This class is particularly ideal for applications that require access to and manipulation of dynamic datasets.
- The GraphicLayer is utilized to depict client-side-generated graphics or geometries. It’s commonly used to display user-added graphics or drawings on a map.
- The choice between FeatureLayer and GraphicLayer depends on your map application’s specific requirements. FeatureLayer is suitable for managing large and dynamic datasets, while GraphicLayer is better for smaller, more customizable datasets.
- According to Esri, when dealing with client-side graphics, it’s typically recommended to create a FeatureLayer using its source property. This is because the FeatureLayer offers greater functionality compared to the GraphicsLayer, encompassing capabilities such as rendering, querying, and labeling.
You can access and clone the basic example code used in this explanation.
Thanks for reading.
메타데이터
- post_id
- 77bf0640f084
- slug
- graphiclayer-vs-featurelayer-in-arcgis-for-javascript-sdk-77bf0640f084
- url
- https://medium.com/@bsozer06/graphiclayer-vs-featurelayer-in-arcgis-for-javascript-sdk-77bf0640f084
- canonical_url
- https://medium.com/@bsozer06/graphiclayer-vs-featurelayer-in-arcgis-for-javascript-sdk-77bf0640f084
- author_url
- https://medium.com/@bsozer06
- status
- ok
- fetched_at
- 2026-06-17 12:55:42