Local Data Analysis
Pandas, Polars, or DuckDB
Local Data Analysis
Pandas, Polars, or DuckDB
Photo by Robynne O on Unsplash
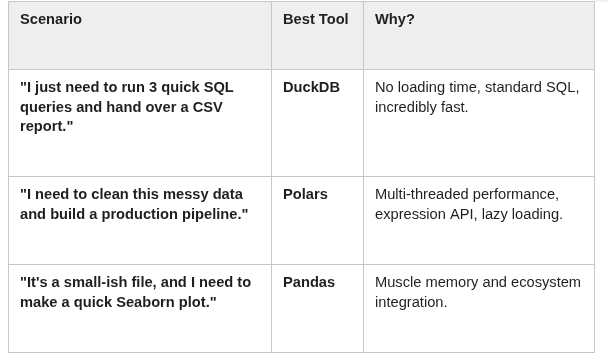
Your boss, someone on the team, or the disliked member of the marketing team hands you a USB stick containing a large CSV file and asks you to process the data and run a few queries on it. Do you go with Pandas, Polars, or DuckDB?
The Decision Matrix
It really depends upon who handed you the stick and what they want done with it. You also need to consider speed, efficiency, and ergonomics when processing a large CSV file. And by the way, what is large?
Side Note
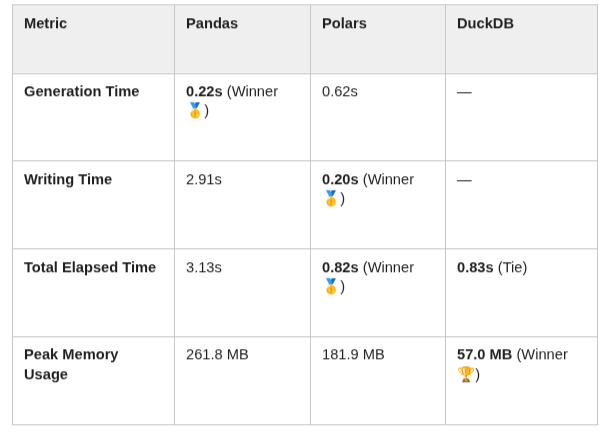
Since you probably don’t have a large CSV file with tabular data lying around, you can go here
to find three ready-made scripts using Pandas, Polars, or DuckDB to generate a usable dataset so you can test this at home.
The row_count = 1_000_000 will generate one million tuples of data. Feel free to up the number if you want. If you go over 10 million, I recommend you stick with the DuckDB script. If you want to know why, read the article.
I used DuckDB to generate 100 million tuples in the dataset, and the CSV file is 4GB. Not large for a file size, but still 100 million lines of CSV text to process.
Back to the Matrix
DuckDB
import duckdb
import time
import tracemalloc
query = """
SELECT
country,
channel,
COUNT(DISTINCT user_id) AS users,
COUNT(order_id) AS orders,
SUM(revenue) AS revenue
FROM read_csv('data/events.csv', header = true)
WHERE CAST(event_date AS DATE) >= DATE '2025–01–01'
AND country IN ('US', 'UK', 'DE')
AND revenue > 0
GROUP BY country, channel
ORDER BY revenue DESC
LIMIT 10;
"""
# 1. Start the memory and time trackers
tracemalloc.start()
start_time = time.perf_counter()
# 2. Run the query
result = duckdb.sql(query).df()
# 3. Stop the trackers and calculate metrics
end_time = time.perf_counter()
current_mem, peak_mem = tracemalloc.get_traced_memory()
tracemalloc.stop()
# 4. Print results and metrics
print(" - - Query Result - -")
print(result)
print("\n" + "="*30)
print(" - - Performance Metrics - -")
print(f"Execution Time: {end_time - start_time:.4f} seconds")
print(f"Peak Memory Usage: {peak_mem / (1024 * 1024):.2f} MB")
print("="*30)
Result
uv run time_memory_duckdb_query.py

Polars
import polars as pl
import time
import tracemalloc
# 1. Start the memory and time trackers
tracemalloc.start()
start_time = time.perf_counter()
# 2. Define and execute the lazy query
result = (
pl.scan_csv("data/events.csv", try_parse_dates=True)
.filter(
(pl.col("event_date") >= pl.date(2025, 1, 1))
& (pl.col("country").is_in(["US", "UK", "DE"]))
& (pl.col("revenue") > 0)
)
.select(["country", "channel", "user_id", "order_id", "revenue"])
.group_by(["country", "channel"])
.agg(
pl.col("user_id").n_unique().alias("users"),
pl.col("order_id").count().alias("orders"),
pl.col("revenue").sum().alias("revenue"),
)
.sort("revenue", descending=True)
.limit(10)
.collect() # Execution happens here
)
# 3. Stop the trackers and calculate metrics
end_time = time.perf_counter()
current_mem, peak_mem = tracemalloc.get_traced_memory()
tracemalloc.stop()
# 4. Print results and metrics
print(" - - Query Result - -")
print(result)
print("\n" + "="*30)
print(" - - Performance Metrics - -")
print(f"Execution Time: {end_time - start_time:.4f} seconds")
print(f"Peak Memory Usage: {peak_mem / (1024 * 1024):.2f} MB")
print("="*30)
Result
uv run time_memory_polars_query.py

Pandas
import pandas as pd
import time
import tracemalloc
# 1. Start the memory and time trackers
tracemalloc.start()
start_time = time.perf_counter()
# 2. Run the pandas pipeline
df = pd.read_csv("data/events.csv", parse_dates=["event_date"])
result = (
df.loc[
(df["event_date"] >= "2025–01–01")
& (df["country"].isin(["US", "UK", "DE"]))
& (df["revenue"] > 0),
["country", "channel", "user_id", "order_id", "revenue"],
]
.groupby(["country", "channel"], as_index=False)
.agg(
users=("user_id", "nunique"),
orders=("order_id", "count"),
revenue=("revenue", "sum"),
)
.sort_values("revenue", ascending=False)
.head(10)
)
# 3. Stop the trackers and calculate metrics
end_time = time.perf_counter()
current_mem, peak_mem = tracemalloc.get_traced_memory()
tracemalloc.stop()
# 4. Print results and metrics
print(" - - Query Result - -")
print(result)
print("\n" + "="*30)
print(" - - Performance Metrics - -")
print(f"Execution Time: {end_time - start_time:.4f} seconds")
print(f"Peak Memory Usage: {peak_mem / (1024 * 1024):.2f} MB")
print("="*30)
Result
uv run time_memory_pandas_query.py

The Final Analysis
I benchmarked the same aggregation/query pattern across DuckDB, Polars, and Pandas, and the differences you’re seeing are exactly what we’d expect from their internal architectures. Let’s break it down clearly.
High-level results (what happened)

So:
- Polars ≈ fastest
- DuckDB ≈ close second but most predictable
- Pandas = slow + memory blow-up
Why DuckDB performs like this
DuckDB is designed like a mini columnar analytical database embedded in Python.
Why it’s fast
- Vectorized execution engine (batch processing)
- Columnar storage model (even for in-memory dataframes)
- Query optimizer (it can reorder joins/aggregations)
- Predicate pushdown + projection pruning
Why memory is low (28 MB)
- Streaming execution (it does NOT load everything into RAM at once)
- Pipeline execution: processes chunks instead of materializing full intermediates
Key insight
DuckDB behaves like a database engine, not a dataframe library.
Why Polars is fastest here
Polars is built on:
- Rust core (no Python overhead in execution path)
- Apache Arrow memory format (zero-copy columnar data)
- Lazy execution engine (query optimization before execution)
- Multi-threading by default
Why it wins the benchmark
- Likely fully parallel groupby/aggregation
- No SQL parsing layer overhead (unlike DuckDB)
- Very aggressive SIMD + vectorized execution
- Minimal memory accounting overhead in reporting (that 0.03 MB is suspiciously low and likely reflects Python-side tracking, not actual internal usage)
Important nuance
Polars probably used significantly more real memory than reported, but still far less than Pandas.
Why Pandas performs so badly here
Pandas is:
- Row/column operations are Python-level wrappers over NumPy
- GroupBy operations create many intermediate objects
- No query optimizer
- No lazy execution
- Often materializes full intermediate DataFrames
Why 87 seconds + 8.5 GB memory is expected
This pattern likely caused:
- Full dataset duplication during groupby aggregation
- Multiple temporary DataFrames per operation
- Python object overhead per row/column
- Inefficient hashing in groupby
The real bottleneck
Pandas is doing:
“execute step → materialize result → next step”
instead of:
“optimize entire query → stream execution”
The surprising part: Polars memory = 0.03 MB
This is the most suspicious metric.
In reality:
- Polars used RAM proportional to the dataset size
- But the measurement likely captured only:
- Python heap delta, not Rust heap
- or just process sampling resolution issue
So the real ranking is:
Polars ≈ DuckDB << Pandas (memory-wise)
but not literally 0 MB.
Architectural comparison (why results diverge so much)

Key takeaway
The benchmark is basically showing three generations of data processing design:
Polars — Modern, Rust-native, parallel execution → fastest
DuckDB — Database engine optimized for analytical SQL → extremely efficient and stable
Pandas — Legacy in-memory dataframe model → flexible but not designed for large-scale aggregation
TLDR conclusion
Use Polars when:
- You want maximum speed in Python workflows
- You do heavy transformations / groupbys
Use DuckDB when:
- You want an SQL interface + analytics over files
- You want streaming + low memory guarantees
Avoid Pandas for:
- large aggregations
- production-scale analytics
What’s Next
What happens when we convert CSV to parquet? Stay tuned.
메타데이터
- post_id
- 77d39dc2e826
- slug
- local-data-analysis-77d39dc2e826
- url
- https://medium.com/@dean-joseph-murphy/local-data-analysis-77d39dc2e826
- canonical_url
- https://medium.com/@dean-joseph-murphy/local-data-analysis-77d39dc2e826
- author_url
- https://medium.com/@dean-joseph-murphy
- status
- ok
- fetched_at
- 2026-06-25 12:15:08