20 Million Children. One Dataset. Here’s What I Found.
Breaking down global immunization coverage using WHO/UNICEF WUENIC 2024 data. The gaps, the trends, and what the numbers actually mean.
20 Million Children. One Dataset. Here’s What I Found.
Breaking down global immunization coverage using WHO/UNICEF WUENIC 2024 data. The gaps, the trends, and what the numbers actually mean.
Global immunization coverage sounds like a solved problem. Vaccines exist. Programmes exist. Funding exists. And yet in 2024, nearly 20 million children worldwide still did not complete their DTP3 vaccination. That is the most basic benchmark WHO and UNICEF use to measure whether a child is fully immunized. I wanted to understand where exactly those 20 million children are, which vaccines are failing the most, and whether things are actually getting better or worse. So I pulled the latest WHO/UNICEF WUENIC 2024 dataset. 44 years of vaccination records across 167 countries and 16 vaccine types. And I started digging.
First, the data
The dataset I used is called WUENIC, which stands for WHO and UNICEF Estimates of National Immunization Coverage. It is updated every year and it is the most authoritative source of vaccination data in the world. Each sheet in the file covers one vaccine type, with coverage percentages for every country going back to 1980. Before I did any analysis, I ran a full audit of all 16 vaccine sheets to check data quality. Some sheets had over 90% missing values, meaning most countries simply do not report data for those vaccines yet. I only used sheets where missing data was below 15% for the core analysis, and I clearly flagged the two WHO priority vaccines I included despite higher missing values. That decision alone separates serious analysis from just running code on whatever data you find.
The problem
WHO sets a 90% coverage target for a reason. Below that threshold, communities lose what is called herd immunity. That is the point where enough people are vaccinated that even the unvaccinated are protected because the disease cannot spread easily. When coverage drops below 90%, outbreaks become possible. When it drops to 72% like in West and Central Africa, outbreaks become likely. We have seen this play out with measles in recent years. The question is not whether low coverage causes outbreaks. It does. The question is why coverage stays low despite decades of programmes and billions in funding.
What I found
Here is what stood out. Global DTP3 coverage in 2024 is 85%. That sounds close to the WHO 90% target but 5 out of 7 UNICEF regions are still below it. West and Central Africa is the furthest away at 72%, and it also has the highest absolute burden with 5.7 million unvaccinated children. Europe and Central Asia are the only regions comfortably above target. South Asia has made remarkable progress over 44 years but still has not crossed 90%. And one finding that does not show up in headlines: the post-COVID dip. Coverage dropped visibly after 2019 as health systems pivoted to pandemic response and routine immunization services were disrupted globally. Some regions recovered faster than others.
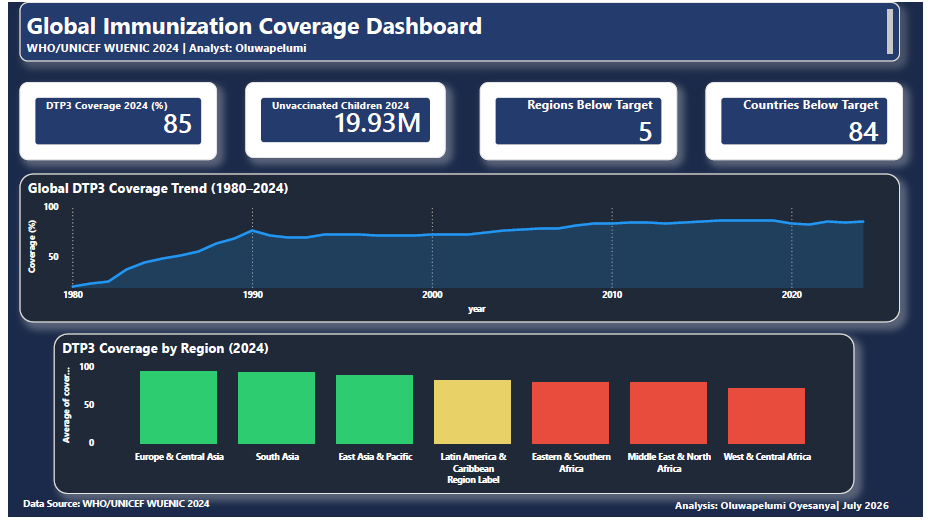
Global Overview: DTP3 coverage sits at 85% globally in 2024, with 5 out of 7 regions still below the WHO 90% target and nearly 20 million children unvaccinated.
Where the biggest gaps are
When you break the numbers down by region, the picture gets sharper. West and Central Africa sits at 72% DTP3 coverage in 2024. That is 18 percentage points below the WHO target. Eastern and Southern Africa is at 79%. Middle East and North Africa is also at 79%. Three regions in the red. Europe and Central Asia leads at 94%, followed by South Asia which has made significant progress over the past two decades. But here is the number that hit me the hardest. West and Central Africa does not just have the lowest coverage rate. It also has the highest absolute number of unvaccinated children at 5.7 million. That combination of low percentage and high population makes it the single most urgent region for intervention. A region can have low coverage but small population and the absolute burden stays manageable. West and Central Africa does not have that luxury.

Regional Deep Dive: West and Central Africa carries the highest unvaccinated burden at 5.7 million children, while Europe and Central Asia lead with 94% DTP3 coverage
The vaccines nobody is talking about
DTP3 gets all the attention because it is the global benchmark. But when you look across all the vaccine types in the dataset, a different story emerges. Newer vaccines like the Hepatitis B vaccine and the Measles second dose are lagging significantly behind the older programs. BCG for tuberculosis and the first DTP dose both sit above 88% globally. But Measles second dose coverage is at 74% globally. That gap between the first and second measles dose is important because it means millions of children started the vaccination schedule but never finished it. They are partially protected but not fully. And partial protection for measles is not enough because measles is one of the most contagious diseases on earth.

Country Level Analysis: Sudan records the lowest DTP3 coverage at 39%, while countries like Grenada and Jordan showed the most improvement post-COVID between 2020 and 2024.
What happened after COVID
One of the most visible patterns in the data is the dip that starts around 2019 and 2020. Global DTP3 coverage dropped from 86% in 2019 to 81% in 2021. That might sound small but in absolute terms it means millions of additional children missed their vaccines during those two years. Health workers were redeployed. Clinics were closed. Parents were afraid to bring their children to health facilities. The good news is that most regions have started recovering. But West and Central Africa has not fully bounced back yet, which partly explains why it carries such a heavy unvaccinated burden in 2024.
What should actually change
Based on what the data shows, three things stand out. First, the dropout problem needs more attention than the access problem. The gap between DTP1 and DTP3 tells us that many children are reaching health facilities for the first dose but not coming back for the second and third. That is a follow-up and community engagement failure, not an access failure. Second, post-COVID recovery efforts need to be concentrated specifically in West and Central Africa which has not bounced back at the same pace as other regions. Third, newer vaccines like Hepatitis B and Measles second dose need dedicated scale-up strategies because they are being treated as secondary to the flagship programs when they carry significant disease burden on their own.
So what now?
The data tells us where the problem is. West and Central Africa. Newer vaccines. Post-COVID recovery gaps. Countries like Sudan sitting at 39% coverage in 2024. But data alone does not fix anything. The real work happens when analysts, programme managers, field teams and governments sit in the same room and agree on what the numbers mean and what to do next. This project was my attempt to make that conversation easier by making the data more visible and more honest. If you work in global health, public health policy, or immunization programmes and this analysis is useful to you, I would love to connect.
Full code, cleaned dataset and Power BI dashboard available on GitHub: [https://github.com/oluwapelumioyesanya/global-immunization-analysis]
Tools used: Python, Pandas, Matplotlib, Seaborn, Power BI Data source: WHO/UNICEF WUENIC 2024 Analyst: Oluwapelumi Abigael Oyesanya
메타데이터
- post_id
- 7b2c6ffe6316
- slug
- 20-million-children-one-dataset-heres-what-i-found-7b2c6ffe6316
- url
- https://medium.com/@oluwapelumioyesanya/20-million-children-one-dataset-heres-what-i-found-7b2c6ffe6316
- canonical_url
- https://medium.com/@oluwapelumioyesanya/20-million-children-one-dataset-heres-what-i-found-7b2c6ffe6316
- author_url
- https://medium.com/@oluwapelumioyesanya
- status
- ok
- fetched_at
- 2026-08-16 17:27:32