Why Your Queries Are Slow
How Execution Plans Will Fix Them
Why Your Queries Are Slow
How Execution Plans Will Fix Them
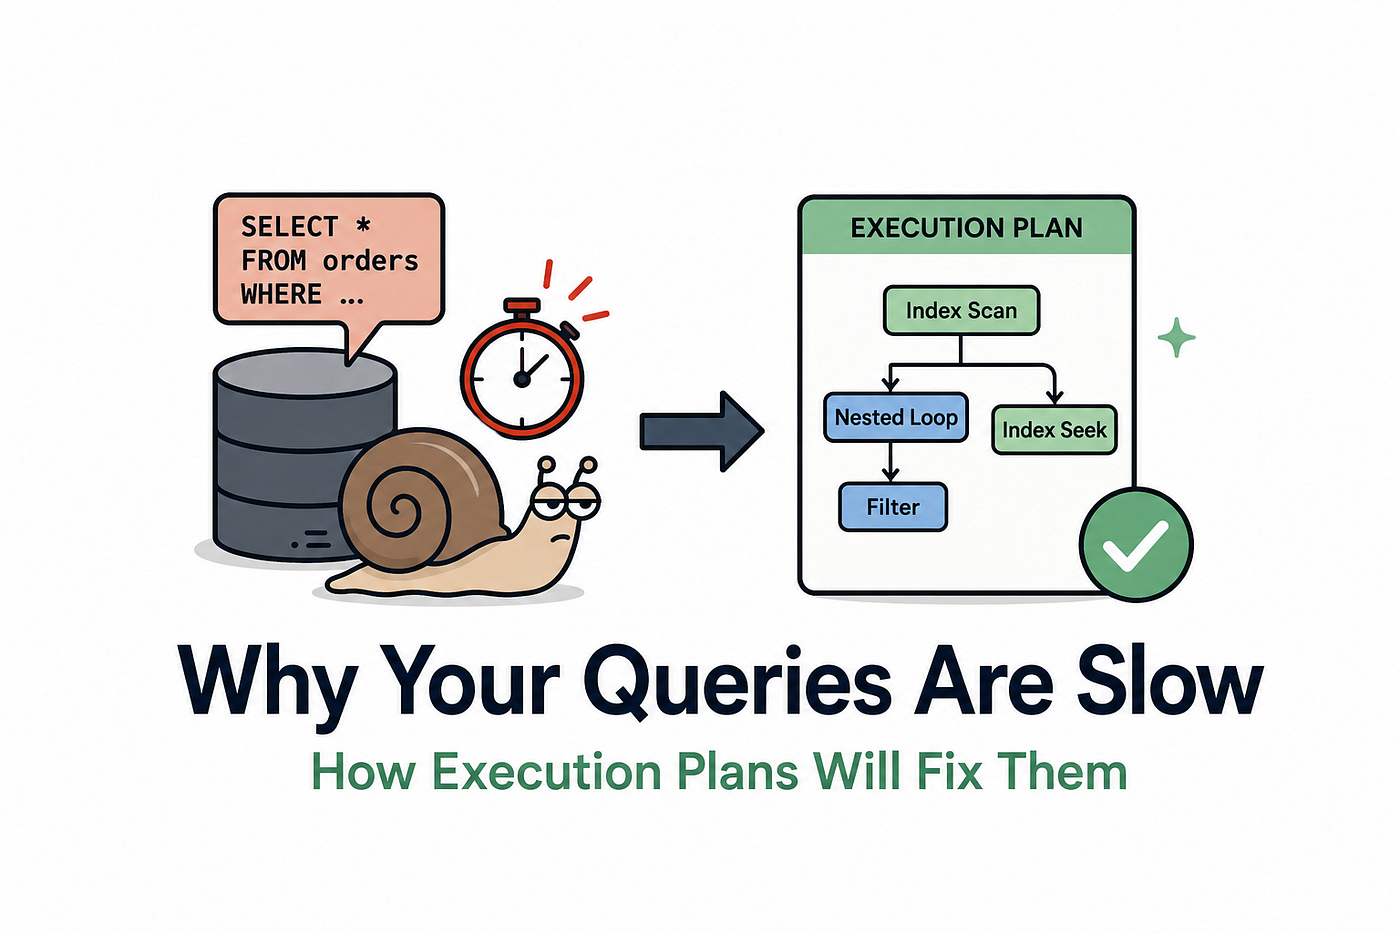
Why Your Queries Are Slow — How Execution Plans Will Fix Them
A practical, step-by-step playbook for reading EXPLAIN output, killing bottlenecks, and tuning queries that actually scale.
Your query ran in 0.3s on staging. In production, it takes 14 seconds. You add an index. It gets slower. You rewrite the JOIN. Still slow. You start praying to the database gods.
If this sounds familiar, you’re not alone. Most developers tune queries by guessing. They add indexes, throw FORCE INDEX hints around, or rewrite logic until something sticks. It’s exhausting, unpredictable, and rarely fixes the root cause.
The truth? Your database already knows exactly why the query is slow. It just needs you to read the receipt.
That receipt is the Execution Plan.
In this guide, I’ll show you how to read execution plans without a computer science degree, spot the exact node dragging your query down, and apply proven tuning techniques that actually move the needle. No fluff. No theory without practice. Just a repeatable workflow you can use on PostgreSQL, MySQL, SQL Server, or Oracle.
What is an Execution Plan, Really?
Think of an execution plan like a GPS route. When you type a query, the database optimizer doesn’t just run it line-by-line. It:
- Parses your SQL
- Evaluates available indexes, statistics, and hardware
- Generates multiple possible routes
- Picks the cheapest one (based on estimated I/O, CPU, and memory)
- Executes it
The execution plan is that chosen route, written out as a tree of operations. Each node represents a step: scan a table, filter rows, join two datasets, sort results, etc.
Crucial note: EXPLAIN shows the planned route. EXPLAIN ANALYZE (or equivalent) shows the actual route, including real execution times and row counts. Always use the latter when tuning.
The 4 Metrics That Actually Matter
Execution plans can look overwhelming. Ignore 80% of the noise. Focus on these four:
[embed]
You don’t need to memorize every operator. You just need to spot the heaviest node and ask: Why is it doing this?
How to Read a Plan (Without Losing Your Mind)
Execution plans are read from the inside out (or bottom-up, depending on your tool). The innermost nodes execute first, and their results feed upward.
Here’s a simplified PostgreSQL example:
EXPLAIN ANALYZE
SELECT o.order_id, c.name
FROM orders o
JOIN customers c ON o.customer_id = c.id
WHERE o.status = 'pending' AND c.region = 'EU';

Query Plan
------------------------------------------------------------------
Hash Join  (cost=45.20..892.10 rows=120 width=64) (actual time=12.4..14.1 rows=98 loops=1)
  Hash Cond: (o.customer_id = c.id)
  ->  Seq Scan on orders o  (cost=0.00..312.50 rows=2400 width=32) (actual time=1.2..8.7 rows=2410)
        Filter: (status = 'pending')
        Rows Removed by Filter: 147800
  ->  Hash  (cost=32.10..32.10 rows=125 width=32) (actual time=0.8..0.8 rows=118 loops=1)
        ->  Index Scan using idx_customers_region on customers c  (cost=0.15..32.10 rows=125) (actual time=0.2..0.6 rows=118)
              Index Cond: (region = 'EU')
How to dissect it:
- Start at the bottom:
Index Scanoncustomers→ fast, uses index, returns 118 rows. - Move up:
Hash Joincombines orders + customers. Cost is moderate. - Look at
orders:Seq ScanwithRows Removed by Filter: 147,800. Bingo. - The optimizer expected 2,400 pending orders. It scanned the whole table, filtered 147k rows in memory, and paid the price.
Fix? Add an index on orders(status), or better yet, a composite index on (status, customer_id) if this query runs often.
5 Silent Query Killers (And How to Fix Them)
1. Outdated Statistics → Bad Estimates → Terrible Plans
The optimizer guesses how many rows a filter will return based on table statistics. If stats are stale, it picks the wrong join order or access method. Fix: Run ANALYZE (Postgres/MySQL), UPDATE STATISTICS (SQL Server), or enable auto-stats. Schedule it after bulk loads.
2. Implicit Type Conversion Kills Indexes
WHERE user_id = 12345 -- user_id is VARCHAR, but you pass an INTThe DB casts every row to compare. Indexes become useless.
Fix: Match data types in your code and schema. Never rely on implicit conversion.
3. SELECT * on Wide Tables
Pulling 50 columns when you need 2 increases I/O, memory grants, and spill-to-disk risk.
Fix: Request only what you need. Use covering indexes for frequent read patterns.
4. Function Wrappers on Indexed Columns
WHERE LOWER(email) = 'user@example.com'Functions force full scans. Even with an index on email.
Fix: Store pre-computed values, use generated/computed columns, or leverage functional indexes (if supported).
5. N+1 Queries Disguised as ORM Behavior
Your ORM runs 1 query, then loops and runs 100 more. The execution plan looks fine because each query is fast. The aggregate isn’t.
Fix: Use eager loading (JOIN, INCLUDE, WITH), batch queries, or materialize results.
The 4-Step Tuning Workflow
- Baseline → Measure real-world impact: latency, CPU, I/O, lock waits. Don’t tune what isn’t broken.
- Capture the Plan → Use
EXPLAIN ANALYZE, SQL Server Query Store, MySQL Performance Schema, or Oracle SQL Monitor. - Find the Heavy Node → Look for high cost/time, massive row mismatches, or sequential scans on large tables.
- Apply & Verify → Fix the root cause (index, rewrite, update stats, partition). Re-run the exact query. If it’s not faster, you fixed the wrong thing.
Never deploy a tuning change without comparing before/after plans and metrics. Theory lies. Execution doesn’t.
Modern Tooling & The AI Myth
In 2026, databases are smarter. Cloud providers auto-tune indexes, recommend partitions, and even rewrite queries. AI assistants can suggest fixes in seconds.
But here’s the reality: AI doesn’t understand your data distribution, business logic, or concurrency patterns. It gives you guesses. Execution plans give you ground truth.
Use tools like:
pg_stat_statements+pg_hint_plan(PostgreSQL)- Query Store + Automatic Tuning (SQL Server)
- Performance Schema +
EXPLAIN(MySQL) - SQL Monitor + AWR (Oracle)
Pair them with a disciplined review process, and you’ll outperform any black-box optimizer.
The Takeaway
Slow queries aren’t a mystery. They’re a math problem with a visible answer. Execution plans are that answer, written in plain text.
Next time a query drags:
- Don’t add an index blindly.
- Don’t rewrite logic hoping for the best.
- Grab the plan. Read it from the inside out. Find the heavy node. Fix the root cause. Verify.
Tuning isn’t about being a database wizard. It’s about reading the receipts.
What’s the slowest query you’ve ever tuned? Drop the before/after plan in the comments — I’ll review it.
메타데이터
- post_id
- 7bbd0f7bbf07
- slug
- why-your-queries-are-slow-7bbd0f7bbf07
- url
- https://medium.com/webmaster-nexus/why-your-queries-are-slow-7bbd0f7bbf07
- canonical_url
- https://medium.com/webmaster-nexus/why-your-queries-are-slow-7bbd0f7bbf07
- author_url
- https://medium.com/@nunacode
- status
- ok
- fetched_at
- 2026-06-13 07:35:29