What 3,142 GDPR Fines Actually Tell Us
Article 2 of 8 — Can We Price GDPR Risk?
What 3,142 GDPR Fines Actually Tell Us
Article 2 of 8 — Can We Price GDPR Risk?
In Article 1, I argued that GDPR liability is an actuarial problem that has not yet been addressed in a transparent and publicly modelled way. That claim needs evidence. This article addresses the first of the four structural problems outlined in Article 1: the severity distribution.
I downloaded the complete CMS Law GDPR Enforcement Tracker database — every fine issued under GDPR from May 2018 through April 2026. 3,142 decisions. 2,823 with a recorded fine amount greater than zero. Approximately €6.07 billion in total penalties.
What follows is not a legal analysis. It is a statistical examination of what this data looks like when you treat it as a loss distribution — the way an actuary would before deciding whether something is insurable.
The short answer: this distribution is extreme, even by insurance standards.
Methodological Note
This analysis uses the CMS Law GDPR Enforcement Tracker as downloaded in April 2026. The tracker lists 3,142 decisions; our scraper successfully parsed 2,854 of these.
Cases with a fine of zero, undisclosed amounts, or range-only disclosures are excluded from the severity analysis, leaving 2,823 observations. Where a single decision cites multiple violations, the total fine amount is used as a single data point.
These figures differ from DLA Piper’s reported €7.1 billion aggregate, which includes fines under related regimes (e.g. ePrivacy Directive) and uses a slightly different cut-off date. For internal consistency, this series uses the CMS dataset throughout.
The dataset includes a small number of UK fines under the UK GDPR, which CMS tracks alongside EU decisions.
The Numbers That Matter
The total fines sum to approximately €6.07 billion across 2,823 cases with recorded amounts. But the aggregate tells you almost nothing useful. What matters is how this total is distributed.
The median fine is €8,000. The mean is €2.1 million. That ratio — mean to median — is roughly 269:1.
For comparison, in a normal distribution this ratio would be close to 1:1. In typical property insurance loss data, you might see ratios of 5:1 or 10:1. A ratio of 269:1 means the distribution is dominated by its tail to a degree that is unusual even among heavy-tailed insurance lines. In practical terms, this means the expected loss is dominated almost entirely by the top 0.1% of observations — a property that has direct consequences for how any pricing model must be structured.
This asymmetry is not caused by data entry errors or a handful of missing values. Even after excluding undisclosed amounts and zero-fine decisions, the distribution remains overwhelmingly dominated by a very small number of ultra-large cases.
The percentile breakdown makes this concrete:
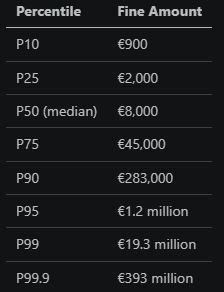
The jump from P95 to P99 is a factor of 16. The jump from P99 to P99.9 is a factor of 20. This is classic heavy-tail behavior — each step further into the tail produces disproportionately larger values.
For an insurer, this means that any layer that attaches above, say, €1 million is almost entirely driven by a handful of cases. Below that threshold, you are effectively writing a different product — one that looks more like a high-frequency, low-severity line.

Concentration: Where the Money Actually Is
The Gini coefficient, computed on the 2,823 non-zero fines, is approximately 0.986 — an extraordinary level of concentration even by catastrophe-risk standards. For context, the Gini for global income inequality is around 0.70.
In practical terms:
- The single largest fine (Meta, €1.2 billion) accounts for 19.8% of all GDPR fines ever issued
- The top 5 fines account for 47.3% of the total
- The top 10 account for 69.4%
- The top 50 — just 1.8% of all cases — account for 92.8% of the total fine amount
Meanwhile, 94.4% of cases (2,664 out of 2,823) involve fines below €1 million. Collectively, they account for €130 million — just 2.1% of the total. The median fine within this group is €6,000.

This has a direct consequence for insurance pricing. If you price based on the median or even the mean, you will dramatically underestimate your exposure to tail events. If you price based on the tail, your premium will be unaffordable for the 94% of companies that will only ever face small fines. This is the fundamental pricing dilemma that makes GDPR liability structurally difficult to insure.
The Rank-Size Relationship
When we plot fine amount against rank on a log-log scale, the result is approximately linear. This is often associated with power-law or Pareto-like behaviour. The visual linearity does not prove a power law, but it strongly suggests that the upper tail decays more slowly than a lognormal — a distinction that matters enormously for setting reinsurance attachment points.

Visually, the upper tail appears substantially heavier than what a standard lognormal specification would predict. Whether GDPR fines follow a strict power law, a truncated Pareto, or some other heavy-tailed specification is an empirical question I address formally in Article 6.
For a reinsurer, the implication is straightforward: the €1.2 billion Meta fine should not be treated as an outlier to be trimmed from analysis. If the tail is indeed heavier than lognormal — a hypothesis I test formally in Article 6 — then fines of this magnitude are a structural feature of the distribution, not an aberration. If the upper tail continues to behave this way, billion-euro fines may become a recurring feature of the GDPR landscape rather than isolated anomalies.
Enforcement Over Time
The CMS data spans roughly eight years. The pattern is not one of steady growth but of acceleration followed by what appears to be maturation.

Case volume ramped up from near zero in 2018 to over 500 decisions per year by 2022, then declined somewhat. But the total fine amounts tell a different story. The peak year was 2023, with nearly €2 billion in fines — driven primarily by the €1.2 billion Meta decision. 2025 exceeded €1 billion again, driven by TikTok’s €530 million fine.
To put this in perspective: both 2022 and 2023 produced exactly seven fines above €10 million. The frequency of large enforcement actions was effectively unchanged. What changed was the severity of the largest cases. In 2023, three decisions alone — Meta’s €1.2 billion transfer case, Meta’s €390 million consent decision, and TikTok’s €345 million children’s data case — accounted for approximately €1.9 billion, or 93% of the year’s total fines. Excluding those three cases, the remaining 516 decisions in 2023 sum to roughly €152 million — below the 2022 level. The year-over-year shift was therefore not driven by more enforcement activity. It was driven by a small number of extreme-severity outcomes.
This divergence between case count and total fine amount is itself informative. The evidence points less to an increase in enforcement frequency than to an escalation in the severity of the largest cases. DPAs appear to be shifting from high-volume, low-severity enforcement to a more targeted approach — fewer cases, but larger penalties against major controllers.
From an actuarial perspective, this is a severity trend, not a frequency trend. If it continues, the tail of the distribution will grow heavier over time, not lighter.
The Country Problem
Perhaps the most striking feature of the data is how differently GDPR is enforced across jurisdictions — despite being a single regulation.

Spain leads overwhelmingly by case count but ranks well below the top by total fine amount. It enforces frequently but at relatively modest severity.
Ireland, with fewer than 40 cases, accounts for roughly €4 billion — about two-thirds of all fines ever issued — because Ireland hosts the European headquarters of Meta, Google, Apple, TikTok, and other major tech companies, and the Irish DPC acts as lead supervisory authority under the GDPR’s One-Stop Shop mechanism.
In practice, a pan-European limit structure may function less like geographic diversification and more like concentrated exposure to whichever supervisory authority happens to regulate the policyholder’s data processing.
For an insurer trying to build a cross-border pricing model, this heterogeneity is a fundamental problem. A company headquartered in Ireland faces a completely different risk profile than one headquartered in Spain, even if both are subject to the same regulation. The same GDPR violation could produce a €10,000 fine in Romania or a €100 million fine in Ireland, depending on which DPA handles the case.
This is not a minor modeling inconvenience. It means that any frequency-severity model that treats “Europe” as a single jurisdiction will produce severely distorted results. Country-specific calibration is not optional — it is a prerequisite.
Violation Types and Their Severity
Not all GDPR violations are created equal. The data reveals clear patterns in which types of violations attract the largest penalties.

The most common violation type — “Insufficient legal basis for data processing” — also carries the highest total fine amount. This category includes consent violations, which are the core of cases against big tech companies.
“Insufficient technical and organisational measures to ensure information security” is the category most directly relevant to cyber insurance. These are the cases that arise from actual data breaches — inadequate encryption, missing access controls, failure to patch known vulnerabilities.
This distinction matters for insurance product design. A pure cyber insurance policy focused on breach response already partially covers the security-related violation category. Security-related violations (primarily Article 32, insufficient technical and organisational measures) account for 19% of cases but only 15% of total fine amounts (€930 million). By contrast, legal basis and general principles violations account for 55% of cases and 78% of total fine amounts (€4.7 billion) — yet these exposures largely sit outside the scope of standard cyber cover.
The majority of GDPR financial exposure is not driven by security failures. It is driven by how companies collect, process, and justify their use of personal data. That is a fundamentally different underwriting problem. In other words, the majority of GDPR financial exposure arises from how data is processed, not from how it is breached — a liability surface that behaves more like regulatory risk than cyber risk.
What This Means for Insurance
Let me state the actuarial implications directly.
Severity is extreme and tail-driven. The Gini of 0.986 and the mean/median ratio of 269:1 place GDPR fines among the most concentrated loss distributions in any insurance line. Standard pricing approaches based on expected loss will fail because the expected loss is dominated by rare, extreme events.
Frequency is jurisdiction-dependent. Any model that does not separate countries will be miscalibrated. The Spain problem (high frequency, low severity) and the Ireland problem (low frequency, extreme severity) require fundamentally different modeling approaches.
Observed severity is increasing over time. The trend toward fewer but larger fines means that historical loss experience may understate future severity. A reserving model calibrated on 2019–2022 data will not capture the regime shift visible in 2023–2025.
Most of the risk is not breach-related. The largest fines arise from consent violations and general processing principles, not from security incidents. Current cyber insurance products, which focus on breach response, miss the majority of the financial exposure.
None of these problems are unsolvable. But they are problems that the insurance industry has not yet seriously attempted to solve. The data exists. The patterns are clear. What is missing is the framework to translate these patterns into a pricing model.
If this article was about how bad a single loss can be, Article 3 is about how often regulators pull the trigger — and why that answer depends almost entirely on where you sit.
Data source: CMS Law GDPR Enforcement Tracker (n = 3,142 decisions, May 2018 — April 2026). Analysis code and methodology are available on request.
Next: Article 3 — The Enforcement Landscape: How Europe Actually Enforces GDPR
About the Author
SukHee Lee is an analytics engineer specializing in insurance and data engineering, with experience in the (re)insurance sector. Holds a Master’s degree in Actuarial Science from Université Paris Diderot (ISIFAR). This series is an independent research project based entirely on publicly available data.
GitHub: github.com/SHLee5864
메타데이터
- post_id
- 7bf0ea6e861e
- slug
- what-3-142-gdpr-fines-actually-tell-us-7bf0ea6e861e
- url
- https://medium.com/@lsh5864/what-3-142-gdpr-fines-actually-tell-us-7bf0ea6e861e
- canonical_url
- https://medium.com/@lsh5864/what-3-142-gdpr-fines-actually-tell-us-7bf0ea6e861e
- author_url
- https://medium.com/@lsh5864
- status
- ok
- fetched_at
- 2026-06-23 19:38:28