Amazon CloudWatch: Enhancing Business Success Through Effective Monitoring
Amazon CloudWatch is a cloud-based monitoring and observability service offered by Amazon Web Services (AWS). It allows users to collect…
Amazon CloudWatch: Enhancing Business Success Through Effective Monitoring
Amazon CloudWatch is a cloud-based monitoring and observability service offered by Amazon Web Services (AWS). It allows users to collect and track metrics, collect and monitor log files, and set alarms.
CloudWatch enables AWS customers to gain insights into the performance and operational health of their AWS resources and applications. It can be used to monitor various AWS services and resources, including EC2 instances, RDS databases, Lambda functions, and more. Users can create custom dashboards to visualize metrics and set up alarms to receive notifications when certain thresholds are breached, helping them proactively manage their AWS infrastructure.
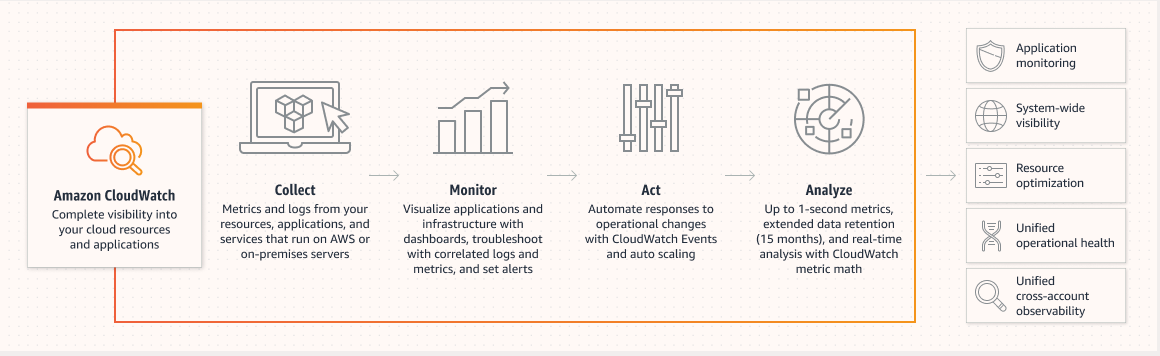
CloudWatch
Monitor
Cross-account observability across multiple AWS accounts
CloudWatch’s cross-account observability feature allows you to effectively monitor and resolve issues in applications that extend across multiple accounts within a specific region. You can perform various actions, such as searching for log groups spread across multiple accounts from a centralized interface, executing cross-account Logs Insights queries, and establishing Contributor Insights rules across accounts to identify the top contributors generating log entries. Additionally, you have the capability to visualize metrics originating from multiple accounts within a consolidated view. You can also create alarms that assess metrics from different accounts, enabling you to receive notifications about anomalies and emerging trends.
With Cross-account observability in CloudWatch, you can access an interactive map displaying your cross-account applications via ServiceLens. This map allows for one-step drill downs to pertinent metrics, logs, and traces, facilitating a comprehensive operational perspective. Importantly, this feature streamlines the process without necessitating additional data pipelines, which ultimately saves you time, energy, and resources in managing your infrastructure and applications.
Unified operational view with dashboards
Amazon CloudWatch dashboards empower you to generate reusable graphs and present a consolidated perspective of your cloud resources and applications. Within these dashboards, you have the capability to create graphs for metrics and log data, all within a single interface. This approach allows you to rapidly gain context, moving seamlessly from issue diagnosis to root cause analysis. For instance, you can visualize essential metrics like CPU utilization and memory while comparing them to capacity metrics. Furthermore, you can establish correlations between specific metric log patterns and configure alarms to notify you of performance and operational concerns. This comprehensive functionality provides you with a system-wide view of operational health and the agility to promptly address problems, consequently reducing Mean Time To Resolution (MTTR).
Composite alarms
Using Amazon CloudWatch composite alarms, you have the capability to merge multiple alarms, resulting in a reduction of alarm notifications and associated noise. When a problem impacts numerous resources within an application, you’ll receive a solitary alarm notification encompassing the entire application, rather than separate notifications for each affected resource. This streamlined approach allows you to concentrate your efforts on pinpointing the root cause of operational challenges, ultimately minimizing application downtime. You can effectively convey an overarching state for a collection of resources, whether it’s an application, an AWS Region, or an Availability Zone.
High-resolution alarms
Amazon CloudWatch alarms empower you to establish metric thresholds and initiate actions accordingly. You have the flexibility to configure high-resolution alarms, select percentiles as your chosen statistic, and define actions or opt to disregard them when necessary. For instance, you can establish alarms based on Amazon EC2 metrics, configure notifications, and execute various actions to identify and deactivate instances that are either unused or underutilized. This real-time alerting system for metrics and events enables you to proactively reduce downtime and mitigate potential disruptions to your business operations.
Logs and metrics correlation
Applications and infrastructure resources produce substantial volumes of operational and monitoring data through logs and metrics. Beyond providing a unified platform for accessing and visualizing these datasets, Amazon CloudWatch simplifies the process of establishing correlations between them. This facilitates a swift transition from issue diagnosis to a deeper understanding of the underlying causes. For instance, you can associate a log pattern, such as an error, with a specific metric and configure alarms to promptly notify you of performance and operational concerns.
Application Insights
Amazon CloudWatch Application Insights streamlines the process of establishing observability for your enterprise applications, offering a seamless path to gain insight into their overall health. This service assists in the identification and configuration of essential metrics and logs spanning your application resources and technology stack, encompassing components like databases, web servers (IIS), application servers, operating systems, load balancers, and message queues. Continuously, it monitors this telemetry data to identify and correlate anomalies and errors, providing timely notifications regarding any application issues.
To facilitate troubleshooting, it generates automated dashboards for identified problems, incorporating correlated metric anomalies and log errors. These dashboards also offer supplementary insights to guide you toward potential root causes. This functionality empowers you to swiftly take remedial actions, ensuring the well-being of your applications and the uninterrupted experience of end-users.
Container monitoring insights
Container Insights offers pre-configured dashboards within the CloudWatch console. These dashboards provide concise overviews of compute performance, error occurrences, and alarm statuses organized by cluster, pod/task, and service. In the case of Amazon EKS and Kubernetes (k8s), additional dashboards are accessible for nodes/EC2 instances and namespaces.
Each of these dashboards provides a summary of the active pods/tasks or containers, presenting data on CPU and memory utilization within the specified time frame. Moreover, you have the capability to delve deeper into application logs, AWS X-Ray traces, and performance events in a contextual manner. This deeper exploration is driven by the chosen time window and the specific pod/task or container you’ve selected.
Internet Monitor
The Internet Monitor offers insight into how internet-related issues impact the performance and accessibility of your AWS-hosted applications for end-users. This capability significantly reduces the time required to diagnose these problems, cutting down the resolution time from days to just minutes. You can analyze measurements over various timeframes and geographic levels, swiftly visualize the effects of these issues, and take corrective actions to enhance the user experience. This may involve transitioning to different AWS services or rerouting traffic through alternative AWS Regions.
In cases where the problem stems from the AWS network itself, you’ll automatically receive notifications through the AWS Health Dashboard, which provides details on the steps AWS is taking to address the issue. Internet Monitor provides data that can be integrated into CloudWatch metrics and CloudWatch Logs, enabling seamless support for health-related information related to specific geographies and networks pertinent to your application. Additionally, Internet Monitor sends health events to Amazon EventBridge, facilitating the setup of notifications.
To monitor your application effectively, Internet Monitor observes activities within Amazon Virtual Private Clouds (VPCs), Amazon CloudFront distributions, and Amazon WorkSpaces directories.
Lambda monitoring insights
Lambda Insights offers pre-configured dashboards within the CloudWatch console. These dashboards provide concise overviews of compute performance and error occurrences. Within each dashboard, you’ll find a list of metrics relevant to the selected time frame, and you can seamlessly delve deeper into application logs, AWS X-Ray traces, and performance events, with the context determined by both the chosen time frame and the specific Lambda function you’ve selected.
Anomaly Detection
Amazon CloudWatch Anomaly Detection employs machine-learning (ML) algorithms to consistently evaluate metric data, pinpointing unusual patterns. It permits the creation of alarms that dynamically adapt their thresholds in response to inherent metric patterns, such as those influenced by time of day, day of the week, seasonal variations, or shifting trends. Additionally, you can incorporate anomaly detection bands when visualizing metrics on dashboards. This feature equips you to effectively oversee, identify, and address unexpected fluctuations within your metric data.
ServiceLens
You can utilize Amazon CloudWatch ServiceLens to gain a consolidated view and perform an in-depth analysis of your applications’ health, performance, and availability. This tool seamlessly combines CloudWatch metrics and logs with traces obtained from AWS X-Ray, offering a comprehensive perspective on your applications and their interdependencies. With ServiceLens, you can swiftly identify performance bottlenecks, pinpoint the root causes of application issues, and assess their impact on end-users.
CloudWatch ServiceLens facilitates visibility into your applications across three primary domains:
Infrastructure Monitoring: This involves utilizing metrics and logs to comprehend the underlying resources that support your applications.
Transaction Monitoring: Here, traces are employed to understand the interdependencies among your various resources.
End-User Monitoring: This utilizes canaries to monitor your endpoints and proactively notify you when there is a degradation in the end-user experience.
ServiceLens offers a Service Map, visually representing the contextual connections between all your resources. It also provides an intuitive interface that allows you to delve deeply into correlated monitoring data.
Synthetics
Amazon CloudWatch Synthetics simplifies the monitoring of application endpoints by conducting continuous tests around the clock. It promptly notifies you in case these endpoints deviate from expected behavior. These tests can be tailored to assess various aspects, such as availability, latency, transaction integrity, detection of broken or inactive links, step-by-step task completion, identification of page load errors, measurement of load latencies for UI assets, evaluation of complex wizard flows, and assessment of checkout processes within your applications.
CloudWatch Synthetics is also a valuable tool for identifying problematic application endpoints and tracing these issues back to potential underlying infrastructure problems, thereby reducing Mean Time To Resolution (MTTR). A notable feature of this service is its ability to gather canary traffic, enabling continuous verification of your customer experience, even in the absence of actual customer traffic. This proactive approach helps you uncover issues before your customers encounter them.
CloudWatch Synthetics offers support for monitoring REST APIs, URLs, and website content, allowing you to detect unauthorized alterations stemming from activities such as phishing attempts, code injection, and cross-site scripting.
RUM
Amazon CloudWatch RUM enhances your ability to monitor client-side performance in your applications and effectively reduce Mean Time To Resolution (MTTR). It facilitates the collection of real-time client-side data related to web application performance, allowing for the rapid identification and troubleshooting of issues. CloudWatch RUM complements the data provided by CloudWatch Synthetics, providing you with even greater visibility into the experiences of your end-users.
You can use this tool to visualize irregularities in performance and leverage pertinent debugging data, such as error messages, stack traces, and user session information, to address performance-related problems like JavaScript errors, crashes, and latency issues. Additionally, CloudWatch RUM offers insights into various aspects of end-user impact, encompassing user counts, geographical locations, and browser usage patterns. By aggregating data on your users’ interactions with your application, it assists in making informed decisions about feature launches and prioritizing bug fixes.
Reference:
Are you interested in learning about cloud computing, cybersecurity, and programming? If so, I highly recommend that you check out my YouTube channel. I share regular videos on these topics, providing helpful tips, tutorials, and insights that will help you expand your knowledge and skills.
My videos are designed for anyone who is interested in these topics, whether you are a beginner or an experienced professional. By subscribing to my channel, you will gain access to a wealth of knowledge and insights that will help you stay up-to-date with the latest trends and best practices in cloud computing, cybersecurity, and programming.
So if you’re interested in learning more about these topics, be sure to subscribe to my channel today. Don’t forget to hit the notification bell so that you don’t miss any of my upcoming videos. I look forward to seeing you on the channel!
메타데이터
- post_id
- 7c71e0cfa241
- slug
- amazon-cloudwatch-enhancing-business-success-through-effective-monitoring-7c71e0cfa241
- url
- https://medium.com/@mraviteja9949/amazon-cloudwatch-enhancing-business-success-through-effective-monitoring-7c71e0cfa241
- canonical_url
- https://medium.com/@mraviteja9949/amazon-cloudwatch-enhancing-business-success-through-effective-monitoring-7c71e0cfa241
- author_url
- https://medium.com/@mraviteja9949
- status
- ok
- fetched_at
- 2026-07-14 05:55:09