🚀 Build a Modern Data Lake (MinIO + DuckDB + Grafana) Locally in 15 Minutes!
Ever wanted to build a modern, lightning-fast Data Lake on your own machine without burning your cloud budget? Today, we are building a…
🚀 Build a Modern Data Lake (MinIO + DuckDB + Grafana) Locally in 15 Minutes!
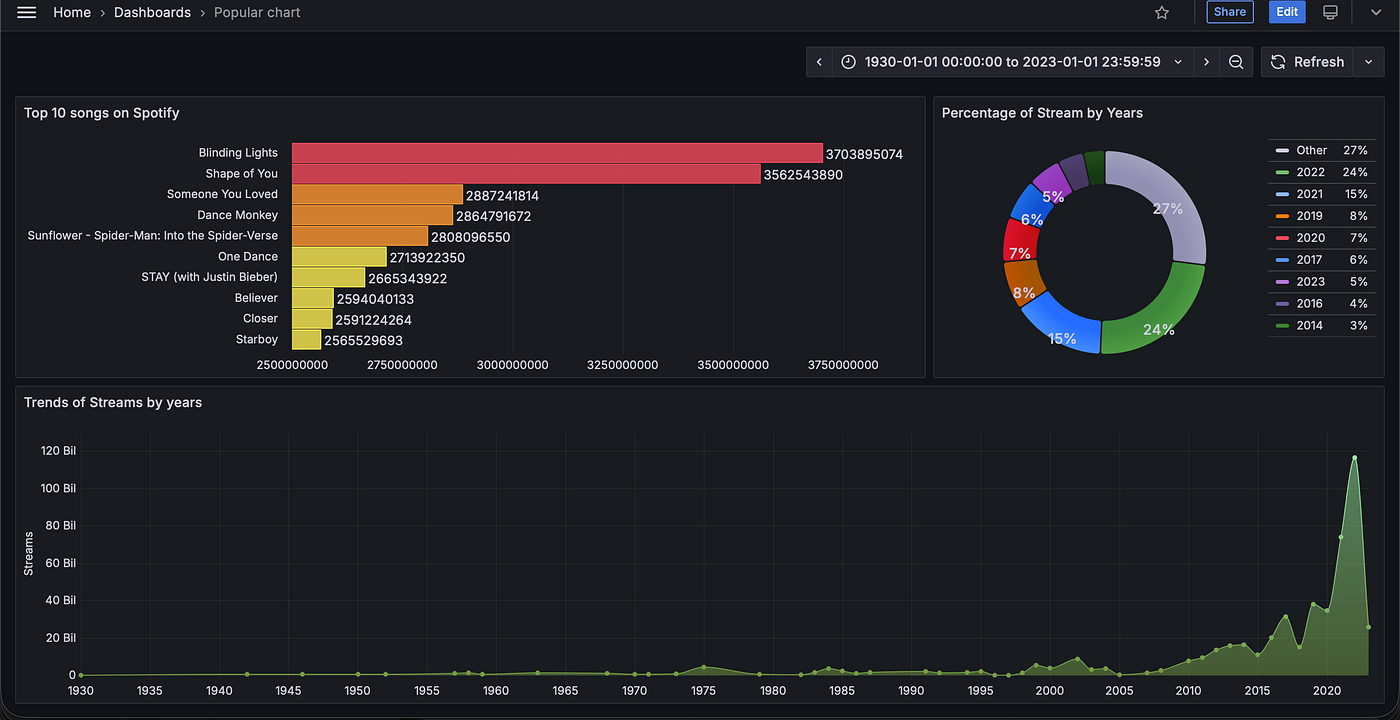
Ever wanted to build a modern, lightning-fast Data Lake on your own machine without burning your cloud budget? Today, we are building a local Data Lake stack using MinIO (Object Storage), DuckDB (Query Engine), and Grafana(Visualization).
Everything runs completely offline inside Docker — no internet connection or cloud subscription required. Let’s spin it up in 15 minutes!
🛠️ The Tech Stack
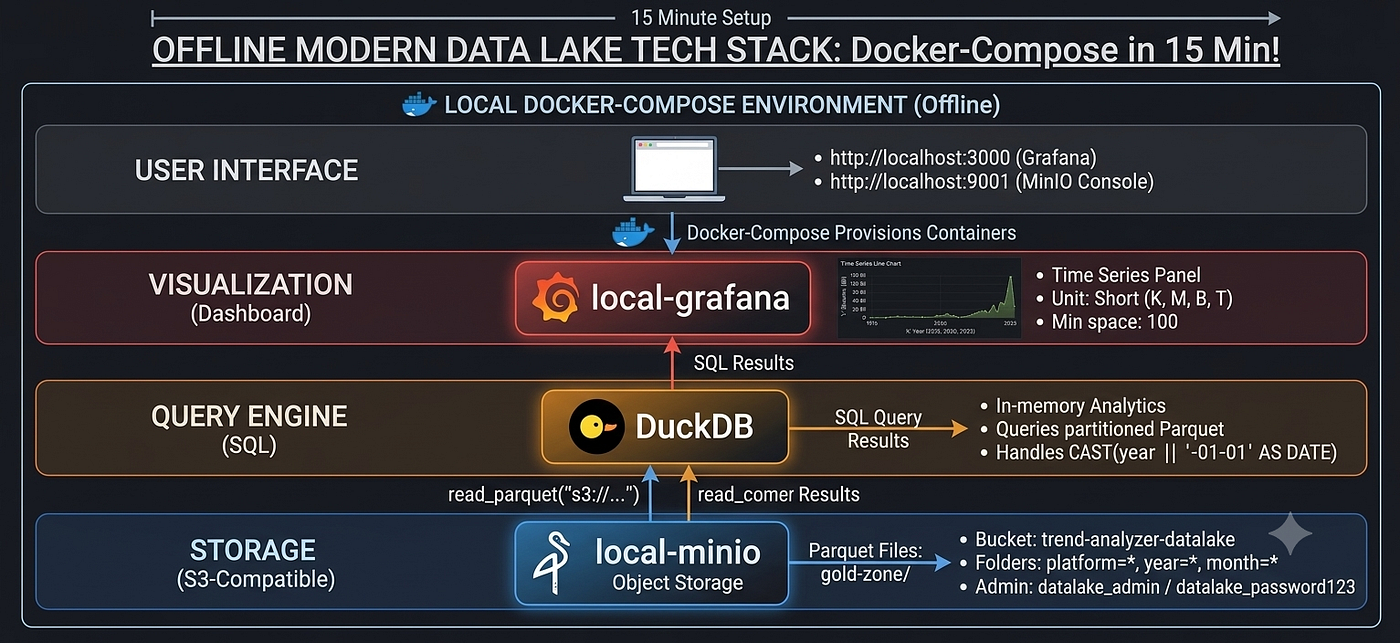
- MinIO: Our local S3-compatible cloud storage. This is where our raw Parquet files live.
- DuckDB: The Swiss Army knife of data analytics. It queries Parquet files inside MinIO instantly with pure SQL.
- Grafana: The ultimate dashboard tool to transform raw numbers into stunning charts.
⏱️ Step-by-Step Guide
Step 1: Prepare the Plugins and Spin Up the Infrastructure
Before running Docker, we need to manually download the DuckDB/MotherDuck Grafana datasource plugin from GitHub to our local machine so Grafana can load it directly from our local directory.
- Create a project folder on your machine and create a subfolder named
plugins. - Download the latest DuckDB plugin zip file from the Grafana DuckDB Datasource GitHub Releases and extract its contents into your newly created
plugins/folder. - Your project directory structure should look like this:
my-local-datalake/
├── docker-compose.yml
└── plugins/
└── duckdb-datasource/ <-- (Extracted plugin files go here)- Drop this updated
docker-compose.ymlfile into the root folder (my-local-datalake/). This setup mounts your localpluginsdirectory straight into Grafana's container, allowing it to boot up with the DuckDB plugin fully installed out-of-the-box:
services:
  minio:
    image: minio/minio:latest
    container_name: local-datalake
    ports:
      - "9000:9000"
      - "9001:9001"
    environment:
      MINIO_ROOT_USER: datalake_admin
      MINIO_ROOT_PASSWORD: datalake_password123
    volumes:
      - minio_data:/data
    command: server /data --console-address ":9001"
    networks:
        - datalake-net

  grafana:
    image: grafana/grafana:11.4.0-ubuntu
    container_name: grafana-analytics
    ports:
      - "3000:3000"
    environment:
      - GF_SECURITY_ADMIN_USER=admin
      - GF_SECURITY_ADMIN_PASSWORD=admin1234
      - GF_PLUGINS_ALLOW_LOADING_UNSIGNED_PLUGINS=motherduck-duckdb-datasource
    volumes:
      - ./plugins/motherduck-duckdb-datasource:/var/lib/grafana/plugins/motherduck-duckdb-datasource
      - grafana-storage:/var/lib/grafana
    networks:
      - datalake-net
    depends_on:
      - minio

networks:
  datalake-net:
    driver: bridge

volumes:
  minio_data:
  grafana-storage:
Run docker compose up -d in your terminal. Grafana will start up, automatically detect the local DuckDB plugin folder, and be ready for your configurations instantly!
… or you can use short cut here
Step 2: Push Your Data to the Gold Zone
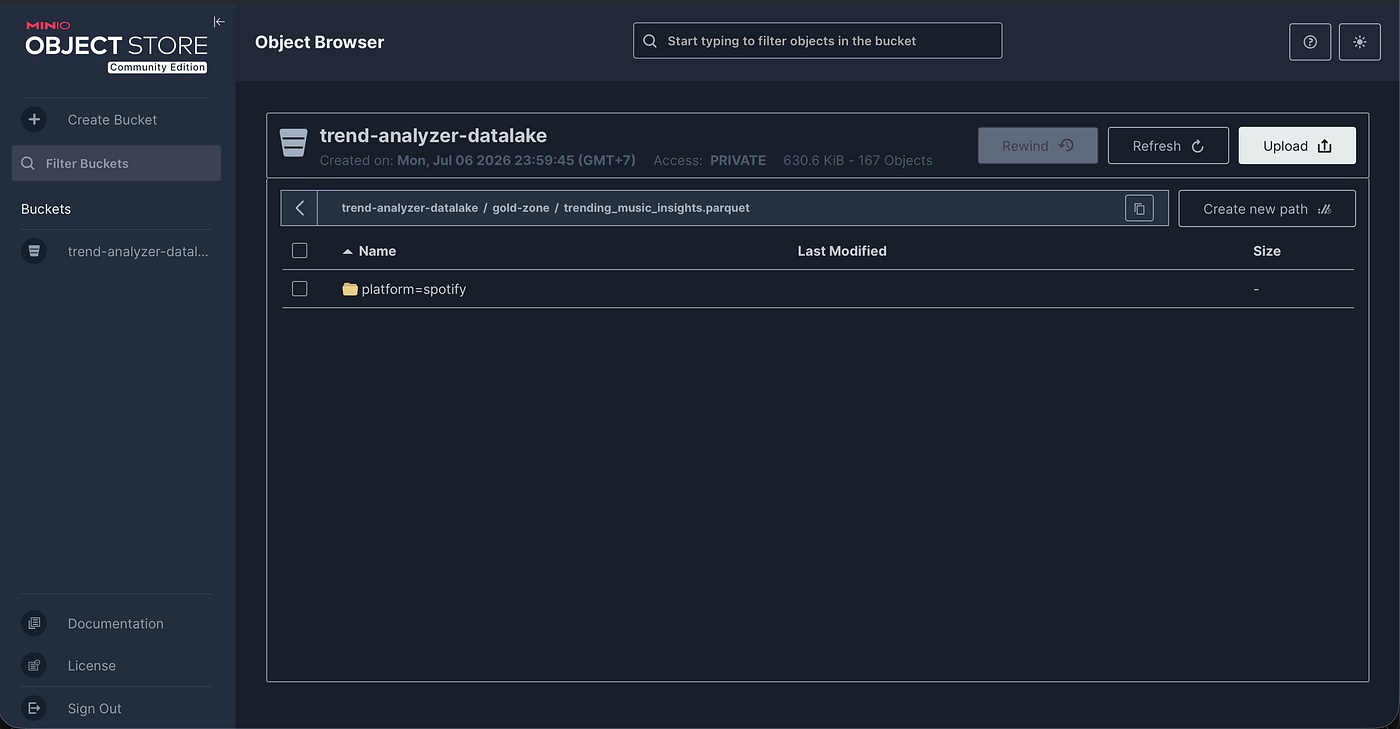
- Open your browser and go to the MinIO Console at
http://localhost:9001(Log in withdatalake_admin/datalake_password123). - Create a bucket named
trend-analyzer-datalake. - Create a folder structure like a real Data Engineer:
gold-zone/platform=spotify/year=2023/month=01/. - Upload your Parquet files here.
Step 3: Connect DuckDB to MinIO (The Secret Sauce)
Open your Grafana at http://localhost:3000 (Login: admin/admin1234), install the DuckDB/MotherDuck data source plugin, and use this SQL script to mount your local S3 bucket directly into DuckDB's memory (Connections > Data sources > motherduck-duckdb-datasource > Init SQL):
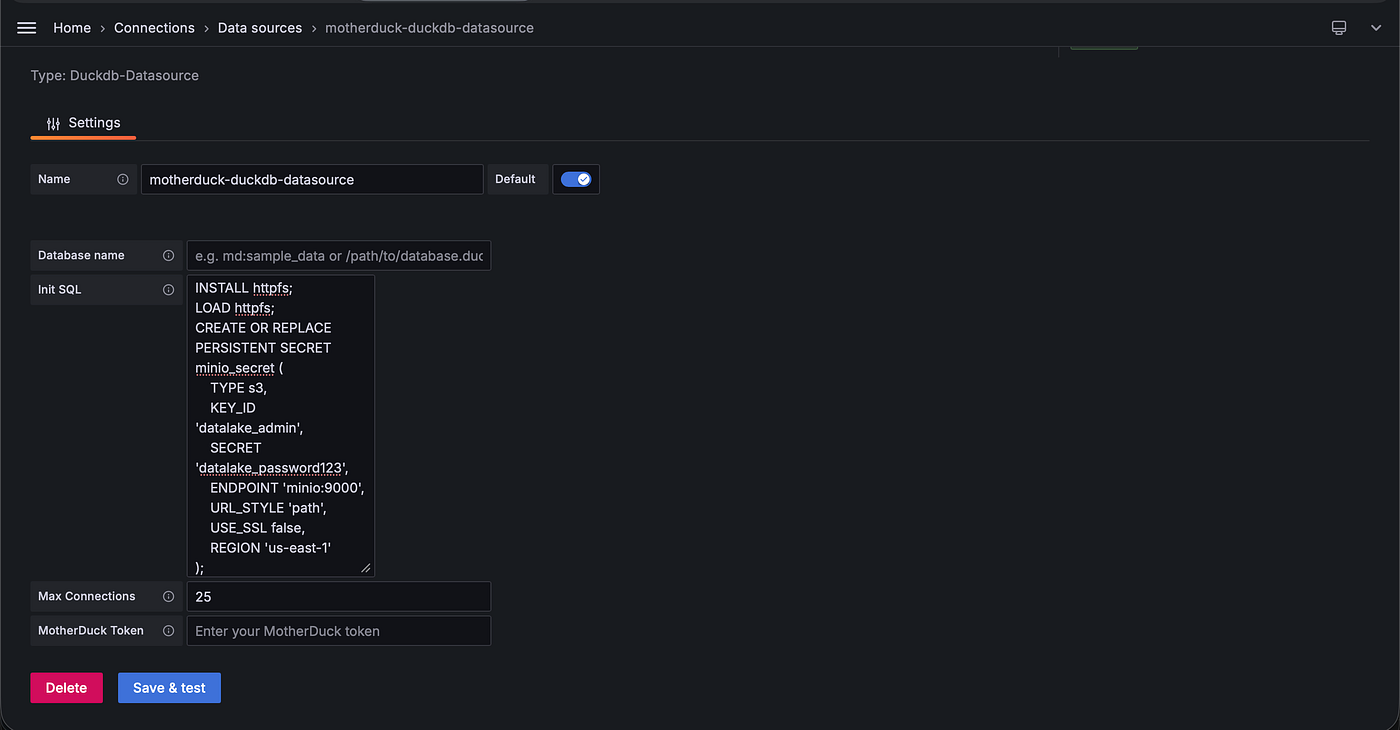
INSTALL httpfs;
LOAD httpfs;
CREATE OR REPLACE PERSISTENT SECRET minio_secret (
    TYPE s3,
    KEY_ID 'datalake_admin',
    SECRET 'datalake_password123',
    ENDPOINT 'minio:9000',
    URL_STYLE 'path',
    USE_SSL false,
    REGION 'us-east-1'
);
and then click Save & Test
Step 4: Write Your First Analytics Query
Now, Create the Dashboard: Click the “+” icon in the top right corner and select Dashboard, then click the Add visualization button. and let’s aggregate billions of streams across partitions. Notice how we **CAST** the integer year into a proper DATE type so Grafana doesn't break when rendering timelines:
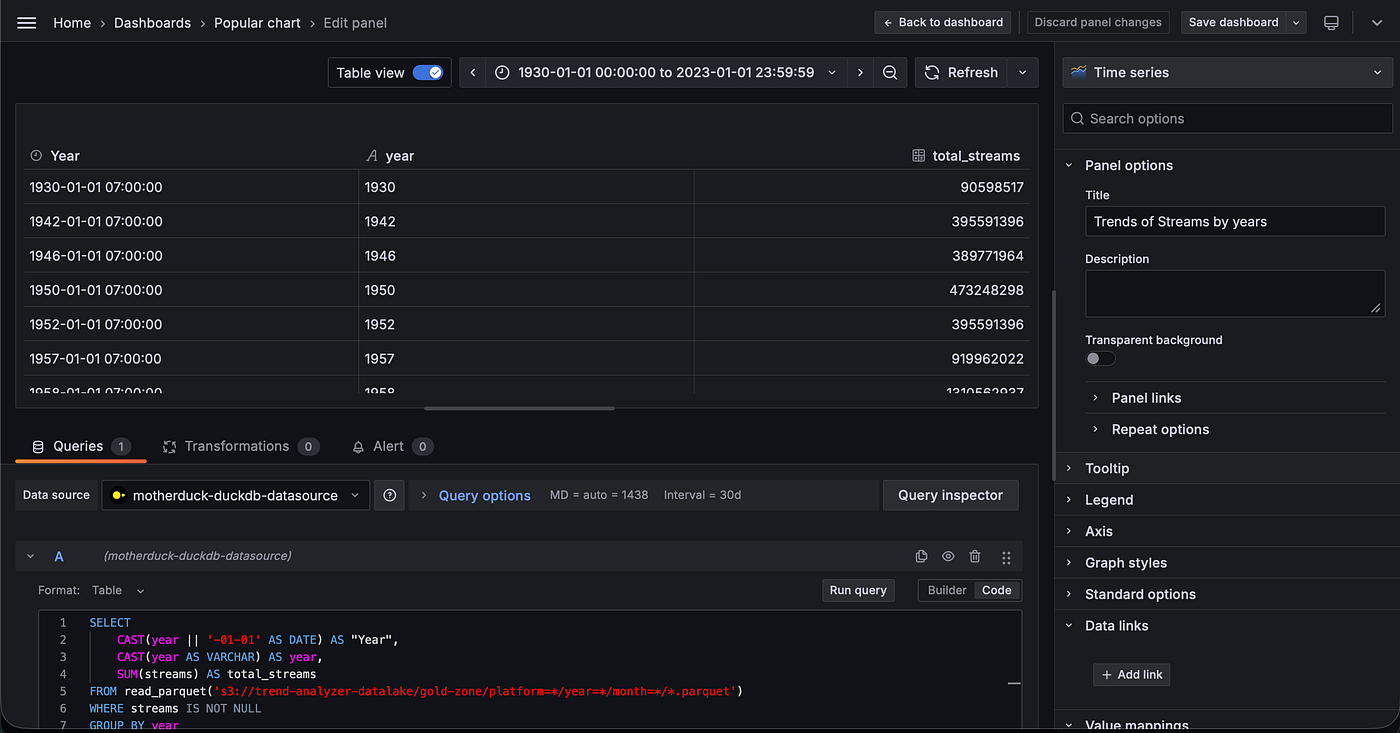
Don’t for get to tick on Table view
SELECT
    CAST(year || '-01-01' AS DATE) AS "Year",
    CAST(year AS VARCHAR) AS year,
    SUM(streams) AS total_streams
FROM read_parquet('s3://trend-analyzer-datalake/gold-zone/platform=*/year=*/month=*/*.parquet')
WHERE streams IS NOT NULL
GROUP BY year
ORDER BY year ASC;
Step 5: Tweak Your Grafana Dashboard (Goodbye Ugly Charts!)
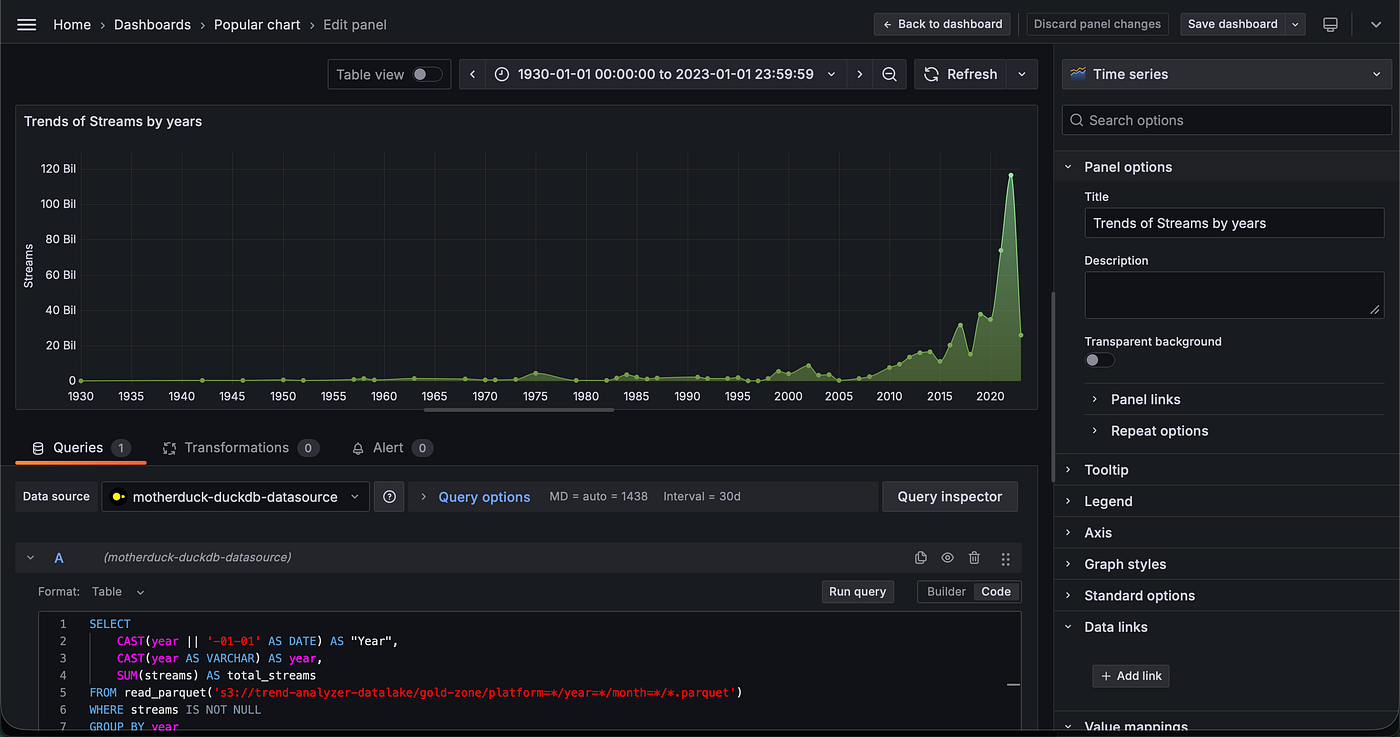
To make your chart look production-ready, apply these settings in the right-side panel:
- Format as: Change from
TabletoTime seriesat the bottom of the query editor. - Chart Type: Select
Time series(top right corner) to get a beautiful continuous line chart. - Clean Axis Y Units: Go to
Standard options➔Unit➔ SelectShort. This instantly squashes long zeros into readable metrics like 116 Bil and 258 Bil. - Reduce Axis Y Clutter: Under
Axis➔ IncreaseMin spaceto80or100to let your grid lines breathe!
🎯 Wrap Up
And that’s it! In just 15 minutes, you’ve built a fully functioning, enterprise-grade local Data Lake.
No complex cloud setups, no surprise AWS bills. Just raw data, fast SQL queries via DuckDB, and beautiful dashboards. Time to drop your own Parquet files in and start exploring your data!
Happy engineering! 💻🔥
DataEngineering #ModernDataStack #DuckDB #Grafana #MinIO #Docker #DataLake #Analytics #HandsOn #DevOps
메타데이터
- post_id
- 7e20bb98689a
- slug
- build-a-modern-data-lake-minio-duckdb-grafana-locally-in-15-minutes-7e20bb98689a
- url
- https://medium.com/@promos.jump/build-a-modern-data-lake-minio-duckdb-grafana-locally-in-15-minutes-7e20bb98689a
- canonical_url
- https://medium.com/@promos.jump/build-a-modern-data-lake-minio-duckdb-grafana-locally-in-15-minutes-7e20bb98689a
- author_url
- https://medium.com/@promos.jump
- status
- ok
- fetched_at
- 2026-07-13 06:23:13



