Cryptocurrency valuation — Introduction to Price to Sales ‘comps’ metric
Brief Introduction
Cryptocurrency valuation — Introduction to Price to Sales ‘comps’ metric
Blockchain Introduction
Digital assets have become a disparate asset class with brand new financial instrument-like characteristics, coins and tokens attached to each network carry unique properties each in their own way. In a modern era of cutting edge, web-based financial innovation taking place where most companies are incorporating best of the best technologies known as “FinTech”, crypto is perhaps carving their own path forward as a viable business alternative.
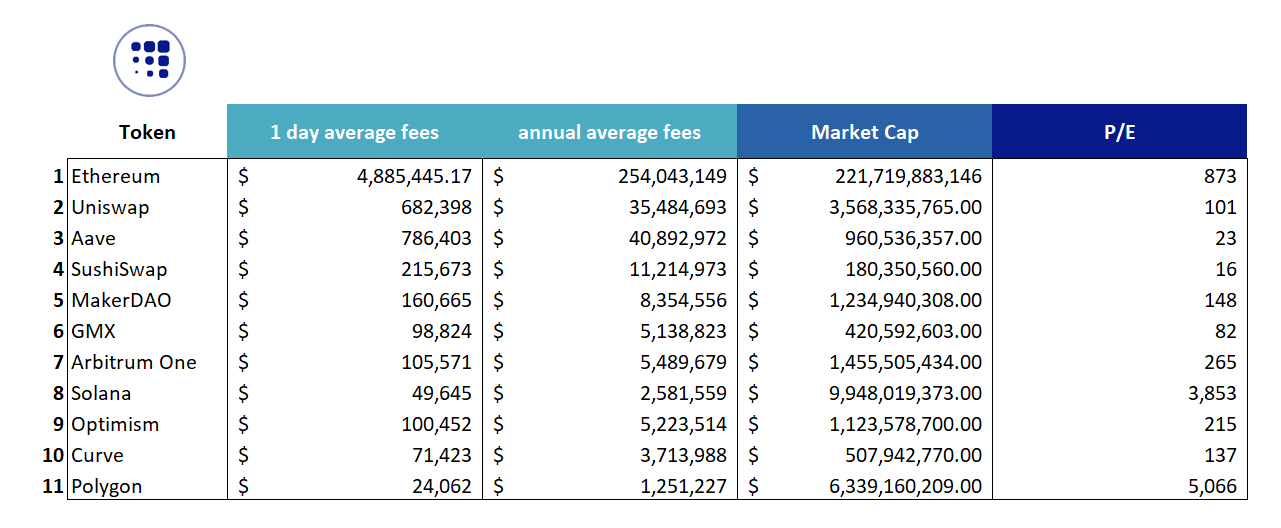
Cryptoken Board UÜ — Annual Revenue & Market Capitalization
Blockchain is both a network and a monetary rail system, which includes topics including a myriad of multi-disciplinary fields like economics, finance, software and technology— wrapped into one. Blockchain is said to be financial innovation, even perhaps leading a revolution providing many clear advantages over the legacy financial instruments.
Blockchain is seeking to develop completely parallel financial infrastructure compared to legacy banking, decades old payment networks, we are incorporating both monetary and infrastructure dynamics as one network. Crypto powers a currency blockchain systems by acting as a medium of exchange in the simple case of Bitcoin #MoE and then infrastructure smart contract platforms execution of the virtual machine that require gas fees. In this regards, blockchain enforce a network consensus which produces a common and transparent ledger.
For this reason, we’re required to think long and hard about how to best approach blockchain valuation, what methodologies are likely pertinent and which financial frameworks we can possibly use to help us arrive at what might be considered fair-value (FV). Cryptoken Board UÜ team is proposing a standardized model here -> Price To Sales ratio, including data to help us glean additional insights about valuation of digital assets.
Crypto Valuation
The Price to Sales ratio, also known as the P/S ratio, is a formula used to measure the total value that investors place on the company in comparison to the total revenue generated by the business. It is calculated by dividing the share price by the sales per share. We can use this very same methodology and apply it to cryptocurrencies, but not as a comprehensive valuation approach, but to rather to provide us with **Relative Valuation **comparables or ‘comps’. By using P/S ratio for public cryptocurrencies, we can at compare individual chains, against the back-drop of revenue generated by each network.
The chart 1 represents data aggregated for the top 11 blockchains — Ethereum, Uniswap, Aave, SushiSwap, MakerDAO, GMX Finance, Artbitrum One, Solana, Optimism, CurveDAO and Polygon. We used data provided by Crypto Fees (info) , with ‘7 day average daily fees’ for each blockchain. Furthermore, we added to chart 1 for each blockchain the market capitalization for each cryptocurrency governing the network as of September 27th, 2023. From here, we were able to compute a simple metric, dividing market capitalization by the annualized fees generated by the each blockchain. Chart 1 includes 7 days average daily fees, annualized (52) week total fees, market capitalization and the P/R (P/S) ratio. According to our analysis, the most profitable chains are Aave, SushiSwap, Uniswap and GMX finance.
The next chart 2, presents graphic representation of the Price to Sales (Revenue) metric. The chart enables us to compare each blockchain, indicating a ‘price of token comparable to one dollar of revenue earned’. We do not need to make comparisons with other financial instruments such as fin-tech stocks, however we can use P/S ratio to indicate relative profitability of the each network, in blockchain.

Cryptoken Board UÜ — Price to Sales Ratio
Looking at the P/S chart, we can see that the lowest ratios indicate highest profitability blockchain metric, reflecting its the multiple paid for 1 dollar of revenue. Aave is currently trading at 61x time sales, followed by SushiSwap 91x, Uniswap 95x and GMX Finance 112x, MakerDAO 157x and CurveDAO 203x. The other five blockchains included in this study are Artbitrum, Optimism, Ethereum and Polygon trading at 355x, 1,368x, 3,638x and 5,485x.
To briefly compare price to sales ratio of the leading blockchains to the stock market, Microsoft $MSFT is currently trading at 12x, Alphabet 6x $GOOGL, and META $META 6.5x. Blockchain is very expensive when being comparing to traditional stocks, what are you thoughts about this ?
Lastly, we’re presenting price adjusted (rolling) Price to Sales ratios for the blockchains under-coverage, keeping track of any un reliability of earnings data, and volatility in their weekly reported earnings. Chart 3 represents P/S ratio for the past 30 days, including measurables from September 27th, September 10th and August 20th. For the period of August 20th — September 20th, crypto prices have decreased slightly, and we can see that revenue reduced even more, indicating a higher Price to Sales ratio for each blockchain on average for the the trailing 30 days.

Cryptoken Board UÜ — Price to Sales Ratio (30 days)
In traditional finance, a fundamental valuation equation equals to:
Value = Price to Earning (P/E) + Present Value of Growth Opportunities (PVGO)
The first component of this equation indicates current stream of earnings per share, and the second component reflects any future growth represented by PVGO. Blockchain offers immense future earnings potential, with this article Cryptoken Board UÜ wanted to share quantitative data that can help our community understand P/S relative valuations of blockchain cryptocurrencies, even when comparing those with a conventional stocks like Google, Microsoft and Meta. For additional quesitons, feel free to connect with Cryptoken Board UÜ, and feel free to leave a comment below, would like to hear more on this topic from the community!
If you would like to make a contribution to Cryptoken Board UÜ research desk to help us continue to publish best in class reporting — via:
BTC address: 15DvCYNZ9CKYa5U4P7x9dCQYXsEw8BTb2q LTC address: LSegtjuDRyp6wVmQ2JLAkp3JWBZGt23Zqe
Contact email cryptoken_board@pm.me
Twitter https://twitter.com/cryptoken_board
Telegram https://t.me/cryptokenboard

메타데이터
- post_id
- 7eb15c0fa1c4
- slug
- cryptocurrency-valuation-introduction-to-price-to-sales-comps-metric-7eb15c0fa1c4
- url
- https://medium.com/@cryptoken_board/cryptocurrency-valuation-introduction-to-price-to-sales-comps-metric-7eb15c0fa1c4
- canonical_url
- https://medium.com/@cryptoken_board/cryptocurrency-valuation-introduction-to-price-to-sales-comps-metric-7eb15c0fa1c4
- author_url
- https://medium.com/@cryptoken_board
- status
- ok
- fetched_at
- 2026-06-09 15:37:30