S&P 500 Hits Record High as Earnings Boost Tech Sector — Market Analysis
Technical recap the market for the week of Oct 14–18, 2024. All three main indexes are up. Review weekly events. New trade ideas: PAAS, NU…
S&P 500 Hits Record High as Earnings Boost Tech Sector — Market Analysis
Technical recap the market for the week of Oct 14–18, 2024. All three main indexes are up. Review weekly events. New trade ideas: PAAS, NU, and PTON
Economic data sources: investor.com | Edward Jones | MarketWatch

Summary
Last week, the market continued its bullish trend, and there was no change to the outlook. The rally was fueled by a series of positive earnings reports, particularly from tech giants. We also had a light week in terms of earth-shattering economic data.

All indexes are in a confirmed uptrend
Key Takeaways:
- The S&P 500 index reached an all-time closing high, rising 0.9% for the week.
- The Dow Jones Industrial Average showed steady growth, gaining 1.0% for the week.
- Russell 2000 (small cap) remains rangebound. — This proves that the majority of investors continue to put money into trusted mega-cap companies rather than smaller ones.
- Netflix’s strong earnings report boosted the tech sector and overall market sentiment. — Ad tier subscription is proving to be a money maker.
- Communication services and real estate were the top-performing sectors.
- The energy sector lagged behind, closing as the only sector in the red.
- This week and next are the heart of earnings season. A key earnings report to watch this week is Tesla’s.
- Trade ideas: PAAS, NU, and PTON
- Stocks should be in your watchlist: NVDA, ARM, TSM, and PAY
Market Movers: Netflix Earnings Boosted Tech Sector
Last week’s market rally was driven by several key events that shaped investor sentiment and market dynamics.
1. Netflix Earnings Surprised Wall Street
- Netflix delivered a stellar earnings report that exceeded analysts’ expectations.
- The streaming giant’s shares surged, propelling the communication services sector to the top of the performance charts.
- This positive surprise set an optimistic tone for the broader tech sector, contributing to the Nasdaq’s performance.
- Netflix gamble with ad tier subscription and it paid off. — The company earn more with ad tier than premium tier subscription.
2. Cooling Inflation Data Supported Market Optimism
- Import prices data released last week furthered the cooling inflation thesis.
- The price of imported goods fell 0.3% last month, surpassing expectations of a 0.2% decline.
- This data point bolstered the narrative of easing inflationary pressures, a key consideration for future Federal Reserve policy decisions. — Despite concerns about a potential recession, the U.S. economy continued to show resilience.
Market Analysis
Recent S&P 500 Performance
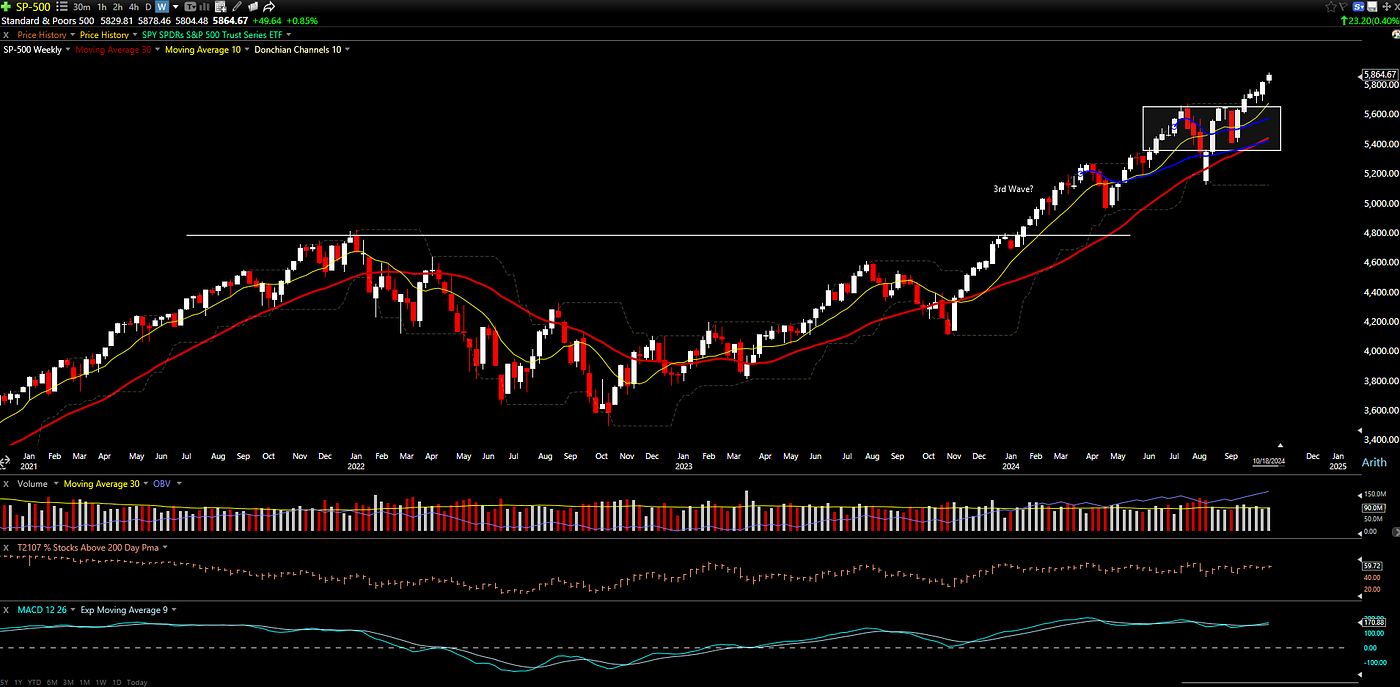
S&P500 has made all-time highs for five consecutive weeks
Performance Metrics:
- Weekly Performance: 0.85%
- Year-to-Date Performance: 22.95%
Technical Indicators:
- The index has made all-time highs for five consecutive weeks.
- Short and long-term moving averages look healthy.
- Price is above both 10 and 30-week moving averages.
Volume:
- Trading volume remained consistent, with on-balance volume continuing an upward trend.
Market Breadth:
- Percentage of companies above 200 SMA: 59.72%
- This indicates that the majority of Fortune 500 companies are maintaining positive momentum, not just mega-caps.
Point of Concern:
- There are signs of MACD divergence emerging. While the price is going up, the MACD trend is slowly moving down. — This means the trend is losing momentum.
- There is no reason to panic or change our bullish outlook. However, we need to keep an eye on this development.
Comparison with Other Major Indices
Nasdaq
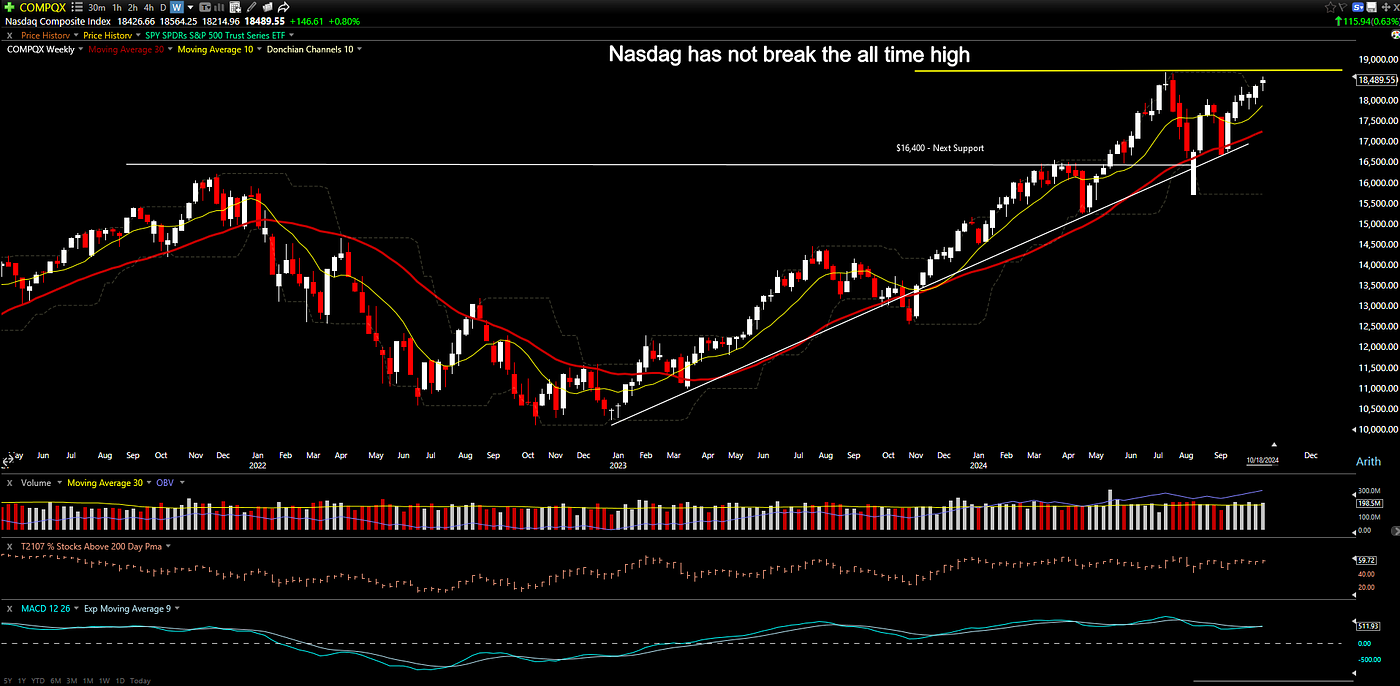
Nasdaq is testing all time high resistance from below
Performance Metrics:
- Weekly Performance: 0.80%
- Year-to-Date Performance: 23.17%
Technical Indicators:
- The index remains above both short-term and long-term momentum/moving averages.
- The index is retesting the all-time high from below.
- At this moment, we will wait to see if it breaks the resistance at ~$18,671.
Dow Jones Industrial Average

Dow Jones Industrial Average is making five consecutive all time highs
Performance Metrics:
- Weekly Performance: 0.91%
- Year-to-Date Performance: 14.82%
Technical Indicators:
- The Dow Jones is following the S&P 500.
- Both the 10-week and 30-week moving averages are sloping upward, confirming the bullish trend.
- Volume and On-Balance Volume are trending up.
- The bullish trend remains healthy.
Russel 2000

Russell 2000 (small cap) continue to be in a consolidation
Performance Metrics:
- Weekly Performance: 1.98%
- Year-to-Date Performance: 12.28%
Technical Indicators:
- While the Russell is above both short- and longer-term moving averages, the index remains rangebound.
- Unfortunately, moving averages are not very helpful when a stock is staying flat.
- We will have to wait and see when the index breaks out to the upside or downside and make a judgment call from there. — Right now, the price action is quite random.
Market Sector Rotation: Weekly and YTD Return
A Quick Takeaway:
- Communication services and real estate emerged as winners for the week. — Netflix boosted the outlook of its sector and tech as a whole. — Real estate is expected to be a beneficiary of the Federal Reserve’s stance on interest rates.
- The biggest loser is energy: — This underperformance was likely due to fluctuating oil prices and concerns about global demand.
Performance sorted by YTD return.
Outperforming Sectors
- Utilities: 3.38% | YTD: 29.40%
- Financial Services: 2.41% | YTD: 26.63%
- Communication Services: 0.89% | YTD: 25.56%
- Industrial: 0.60% | YTD: 22.18%
- Technology: 0.03% | YTD: 19.97%
- Consumer Staple: 0.73% | YTD: 14.17%
Underperforming Sectors
- Basic Material: 1.83% | YTD: 14.13%
- Healthcare: -0.51% | YTD: 12.28%
- Real Estate: 3.02% | YTD: 11.68%
- Consumer Discretionary: 1.49% | YTD: 11.58%
- Energy: -2.63% | YTD: 7.75%
Key Economic Events to Watch This Week
We are light to key economic events this week as well.
- TSLA Earning — Date: 23Oct24 — Importance: High. — Both SPX and Nasdaq index have a high exposure to Tesla.
- S&P Global Flash U.S. Services and Manufacturing PMI (Thursday) — Date: 24Oct24 — These Purchasing Managers’ Index (PMI) readings offer a snapshot of economic conditions in the services and manufacturing sectors. — Expectations: Both indices are expected to remain in expansion territory, albeit with potential slight moderation from September figures.
- Weekly Jobless Claims (Thursday) — Date: 24Oct24 — As always, the weekly initial jobless claims will be closely monitored. — Expectations: Economists anticipate claims to remain at levels consistent with a tight labor market.
Buy Recommendation
Pan American Silver (PAAS) — Buy
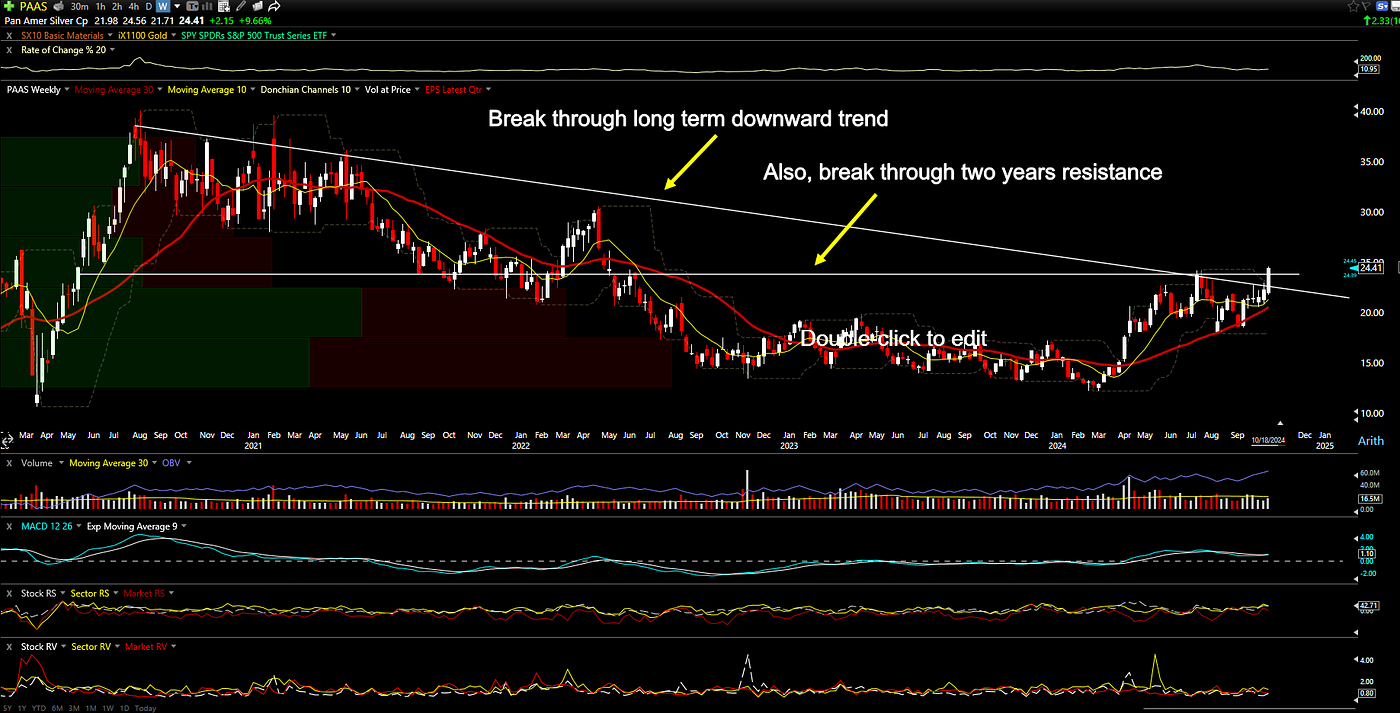
PAAS breaks above the downward trend for the first time in the last five years
Who are they?
- Pan American Silver is a Canadian mining company primarily focused on silver and gold production, with operations across the Americas
Technical Analysis:
- PAAS broke through its 5-year downward trend.
- It also broke out of the cup and handle pattern formed since 2022.
- The stock is trading above both its 10- and 30-week moving averages.
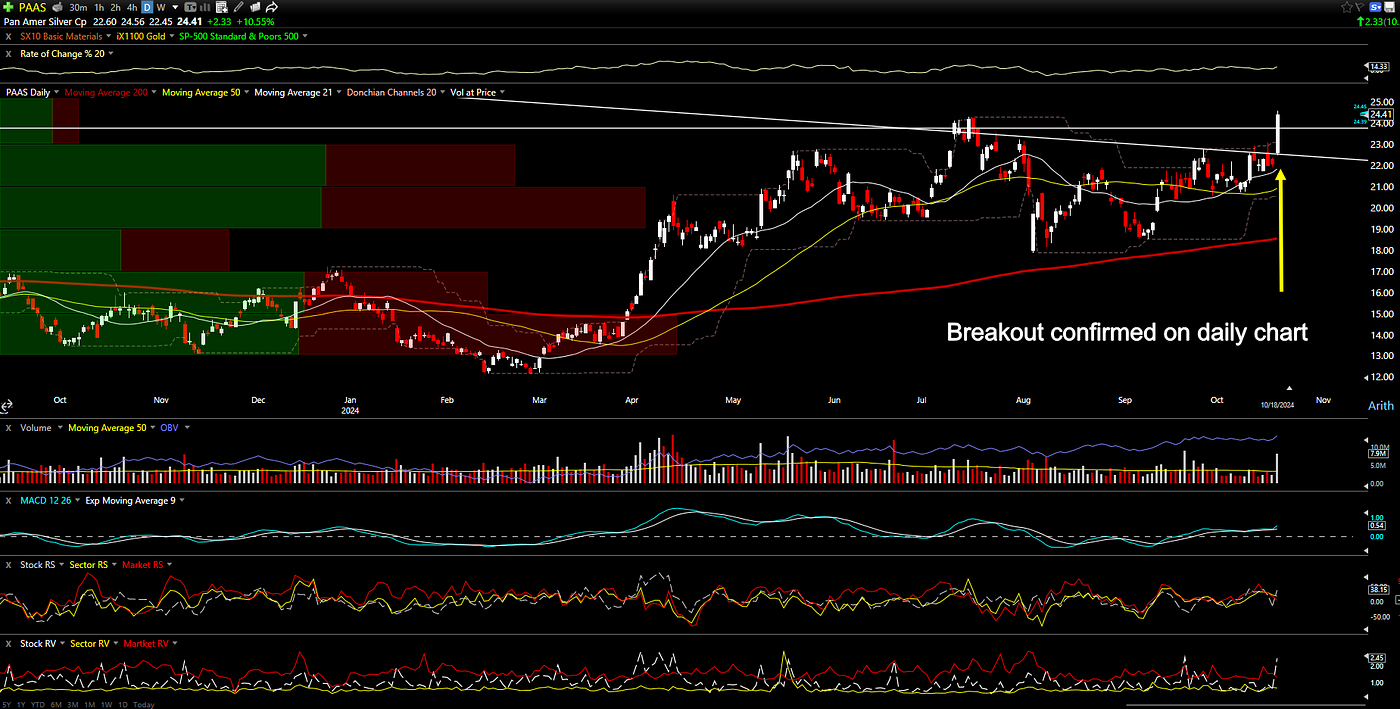
PAAS breakout on the daily chart
Daily Chart Analysis:
- The stock provided an entry signal on Friday with increased volume.
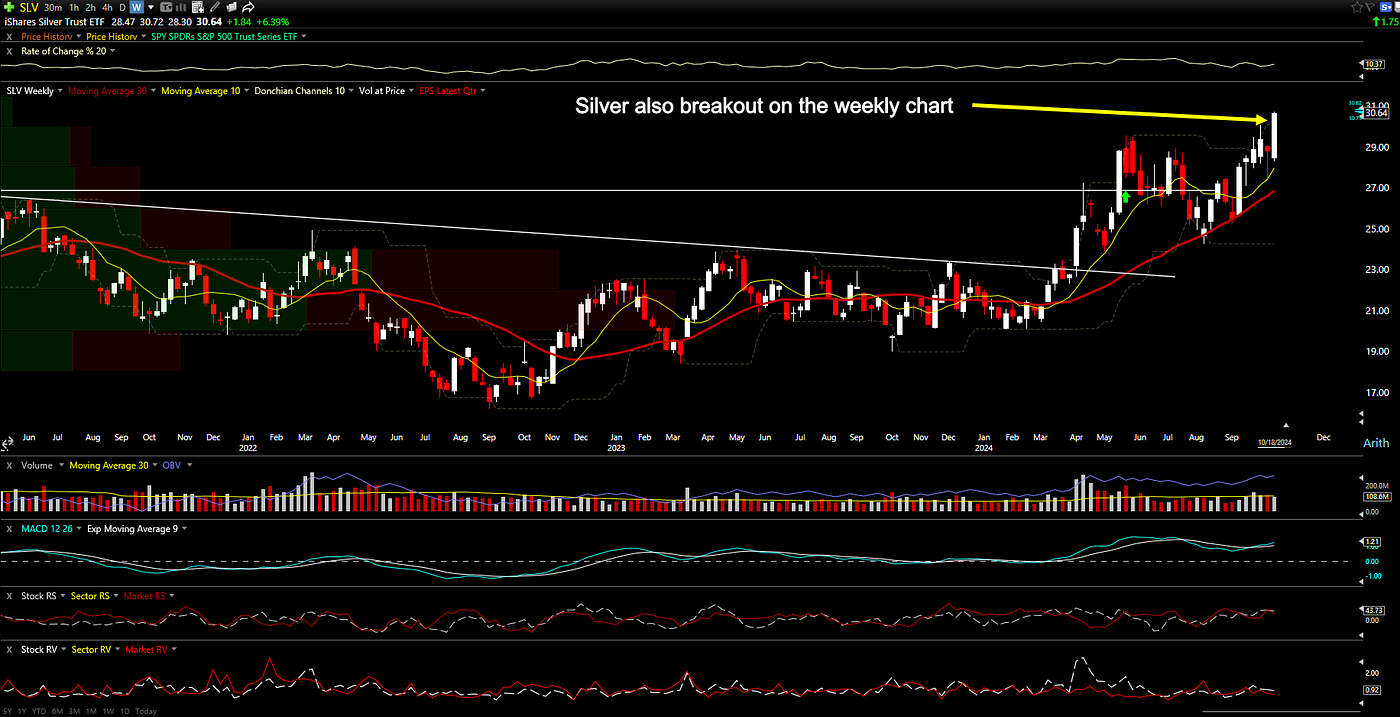
Silver breakout to a 4-year high
Why focus on PAAS:
- One of the reasons PAAS is performing the way it is, is due to the breakout in silver as a whole.
- Rather than buying silver directly, you and I can look into companies that mine it.
- By estimate, PAAS already has approximately 480 million ounces of silver.
- This means silver can be sold at any time to capitalize on the mini silver rush.
- PAAS also provides a small 1.6% dividend.
- If the stock allows us to hold the position long enough, we can have some small hedge against inflation as well.
Point of Concern:
- The next earnings report is on 05 Nov 2024.
- This is a volatile time for the stock.
- If you would like to sit on the sidelines until earnings are released, it is a very valid reason.
Trade Outline: This is what’s working for me. Please do your own risk management.
- Entry: $24.41 (or current price)
- Initial stop (depending on how aggressive you are, here are some suggestions): — The low of the breakout week: $21.71 — Below the support level at: $18.61) — 30% from the current price: $16.95
For the trade layout, we will risk 2% of the portfolio:
- Risk 2% of the portfolio (based on a $100,000 account): $2,000
- Stop loss: $16.95
- Risk per share: $24.41 — $16.95 = $7.46
- Number of shares allowed for this trade: $2,000 / $7.46 ≈ 268 shares
- Total cost for the trade: $24.41 * 268 = $6,541.88
Nu Holdings A (NU) — Buy
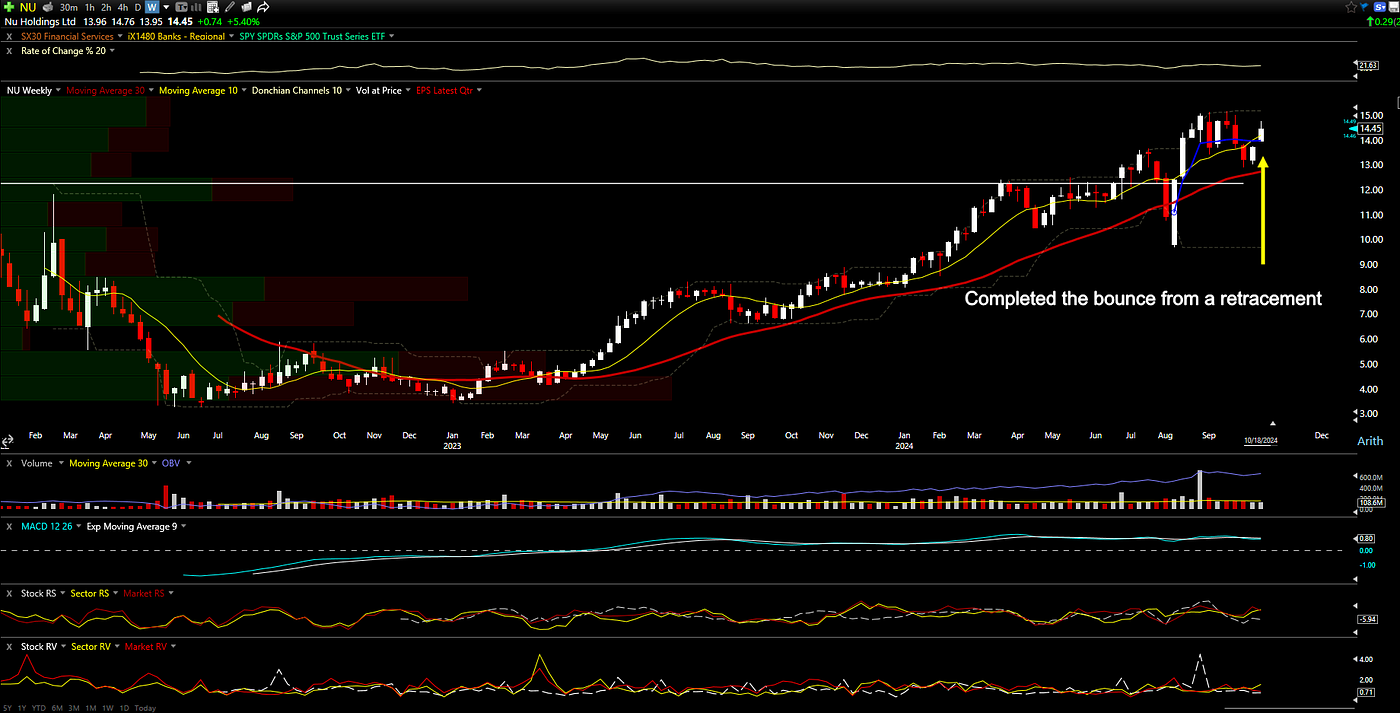
NU bounced and closed above 10-week moving average
Who are they?
- Nu Holdings Ltd. (NU) is a digital banking and financial technology company that provides a range of financial services primarily in Latin America.
Technical Analysis:
- The stock broke out above its IPO price and all-time high back in August, and then retraced back to the support zone.
- As of last week, the stock bounced above the short-term moving average.
- NU is now giving us a second entry signal.
Point of Concern:
- Earnings are scheduled for November 13, 2024, which is about three weeks from now.
If you’d like to explore this trade idea, please follow the calculations above to determine position sizing and stop loss.
Peloton Interactive (PTON) — Buy
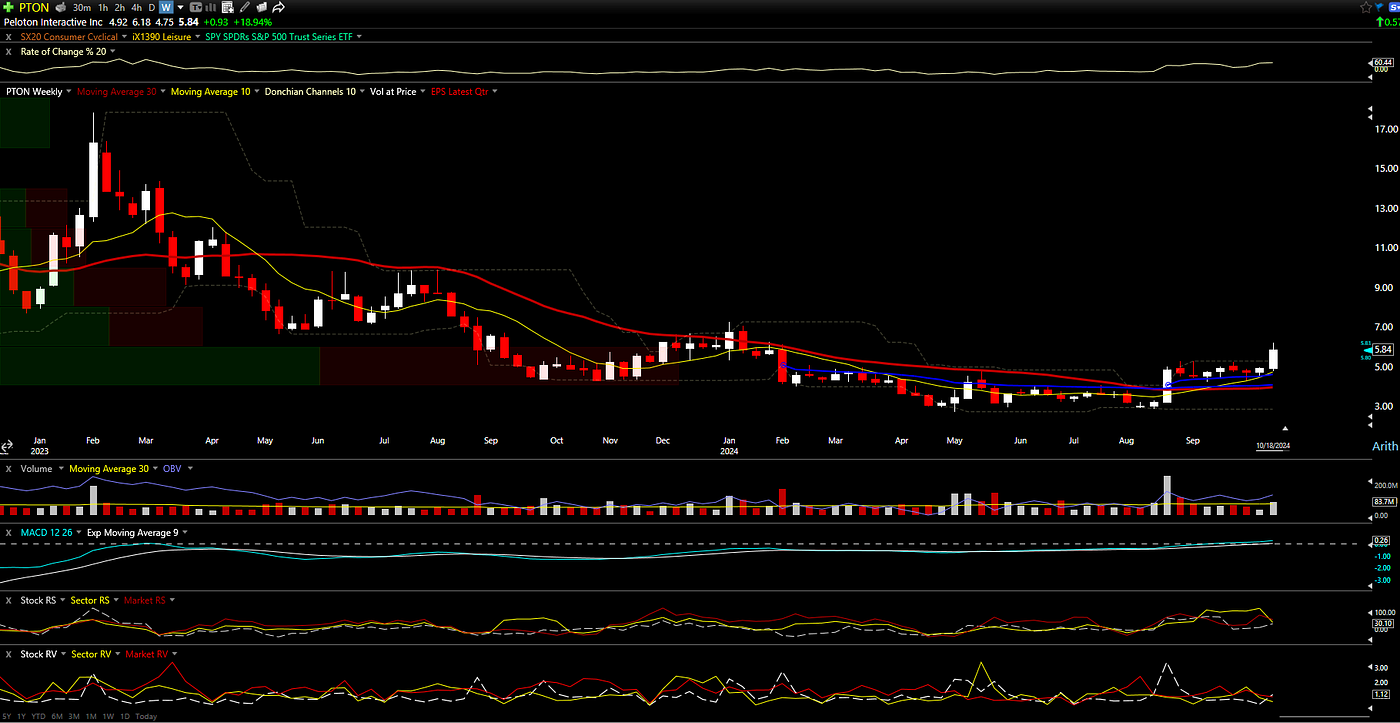
PTON breaks above short and long term moving averages
Who are they?
- Peloton Interactive, Inc. (PTON) is a company that operates an integrated fitness platform in North America and internationally.
Technical Analysis:
- This is a high-risk, high-reward trade.
- The stock has been pushed down to $5.84 from a high of approximately $170.00.
- The chart suggests that the stock is bottoming out.
- The price has pushed above critical moving averages.
Point of Concern:
- Earnings are scheduled for October 31, 2024.
Quick Trading Outline:
- Entry: $5.85 (current price)
- Initial stop loss: $4.09
- Trailing stop loss: 30%
Watchlist
Here are some stocks worth keeping on your radar:
NVIDIA (NVDA)
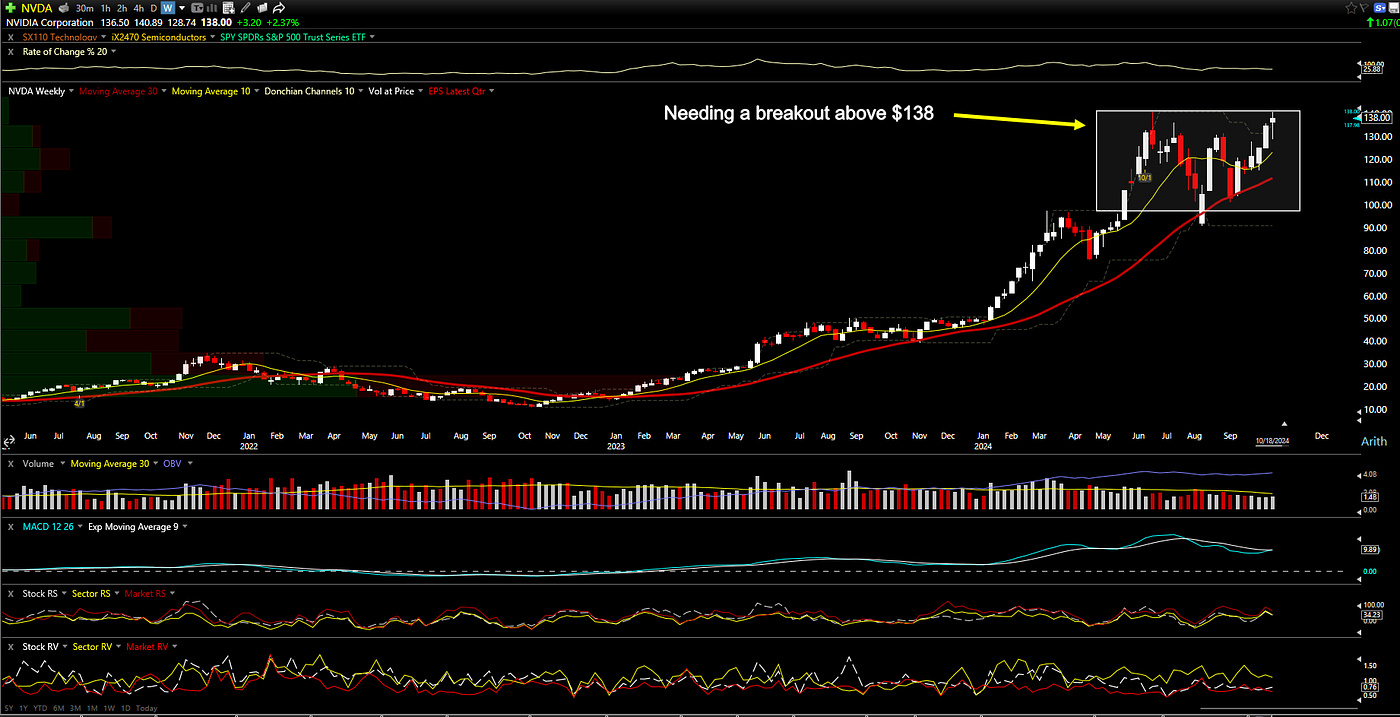
NVDA — Pending for a breakout above $138
Arm Holdings ADR (ARM)

ARM — Pending for a closed above the recent high
Paymentus Holdings (PAY)
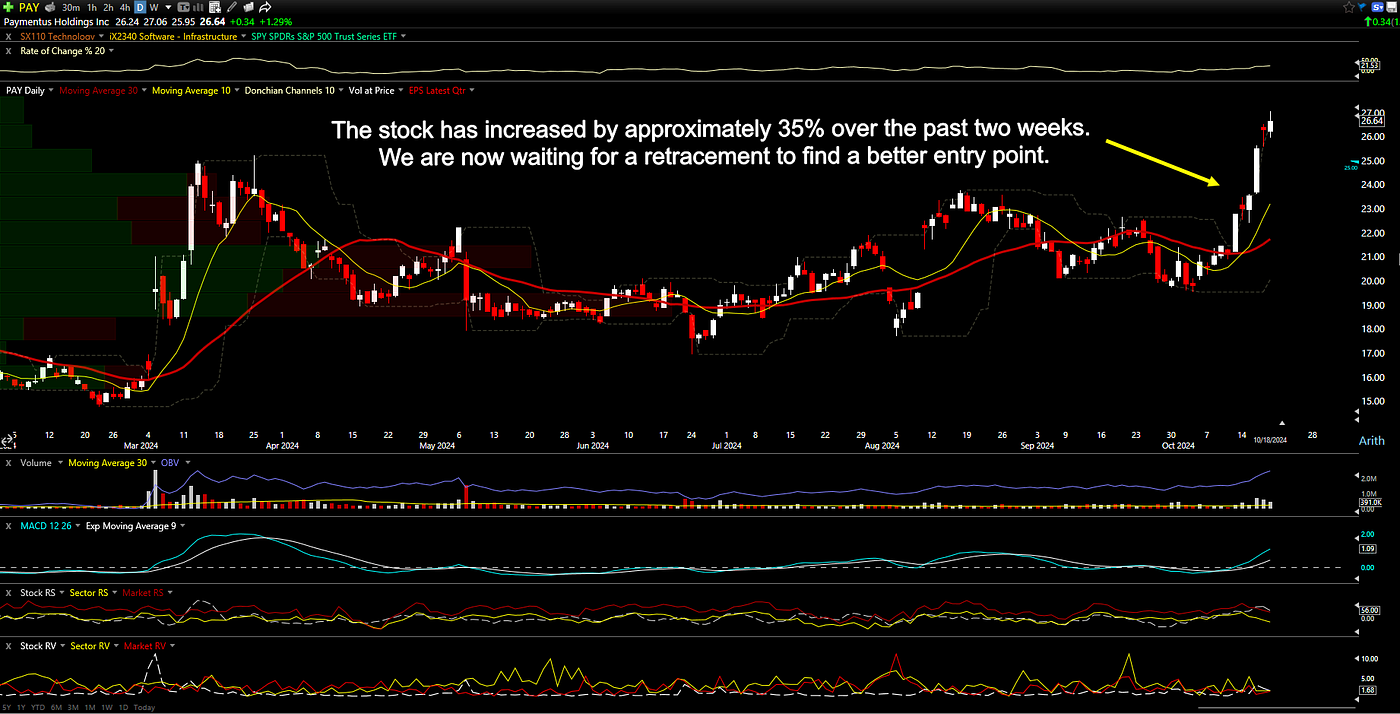
PAY is overbought on the daily chart — Pending retracement for the 2nd entry
Conclusion
Last week’s stock market performance painted a picture of resilience and optimism, driven by strong corporate earnings and favorable economic data. The S&P 500’s record-breaking close and the Nasdaq’s impressive gains highlighted the market’s bullish sentiment.
Key Takeaways:
- Earnings Momentum: Strong reports, particularly from tech giants like Netflix, boosted investor confidence.
- Sector Divergence: Communication services and real estate outperformed, while energy lagged.
- Economic Optimism: Cooling inflation data supported a more dovish Fed outlook, bolstering market sentiment.
- Index Performance: All major indices (S&P 500, Nasdaq, Dow Jones) posted weekly gains, with the S&P 500 and Nasdaq both up over 23% year-to-date.
- Looking Ahead: Upcoming earnings reports from Tesla and GE Aerospace, along with key economic indicators, will be crucial in shaping market direction.
Thank you for joining me this week. Best wishes for everything that you do. Have an enjoyable week, ladies and gents.
If you like what present here, do consider my substack: datnguyenwrite.substack.com
메타데이터
- post_id
- 7eead8f05a24
- slug
- https-datnguyenwrite-substack-com-p-stock-market-update-sp500-record-high-earnings-boost-tech-sector-7eead8f05a24
- url
- https://medium.com/@datng8/https-datnguyenwrite-substack-com-p-stock-market-update-sp500-record-high-earnings-boost-tech-sector-7eead8f05a24
- canonical_url
- https://medium.com/@datng8/https-datnguyenwrite-substack-com-p-stock-market-update-sp500-record-high-earnings-boost-tech-sector-7eead8f05a24
- author_url
- https://medium.com/@datng8
- status
- ok
- fetched_at
- 2026-07-22 11:29:09




