The Metric That Felt Like Progress Was the One Costing Me the Most
Traffic was up. Revenue per session was down. The metric that felt like progress was costing us six figures a month.
The Metric That Felt Like Progress Was the One Costing Me the Most

Image: Ammarah Ahmed / Precision Consulting
There is a particular kind of founder delusion that is hard to catch because it looks exactly like focus.
You pick a number. You put it on the dashboard. You build your week around moving it. The team knows the number. The investors get updates on the number. You feel like you are running a real business because you are tracking a real metric.
The problem, which I did not fully understand until I had spent years inside some of the largest e-commerce operations in the Middle East and Southeast Asia, is that the metric you choose to track shapes every decision you make. Choose the wrong one and you can spend years optimising for something that has almost no relationship to what you actually need to grow.
I have seen this at scale. I have done it myself. Here is what it looks like from the inside.
The number that felt important
In e-commerce, the metric that attracts the most attention is traffic. Sessions. Visitors. Monthly active users. The dashboard number that goes up when your ads are working and down when they are not.
Traffic is not a vanity metric in the pejorative sense. It is a real input. But it becomes dangerous when it becomes the primary number because it tells you nothing about what happens after someone arrives.
I spent time in a business where traffic was growing steadily. Every month, the curve went up. The team was energised. The campaigns were performing. Then someone pulled the revenue-per-session figure, which almost nobody had looked at, and the picture inverted. Revenue per session was declining. We were getting more visitors and extracting less value from each one. The traffic growth was masking a conversion problem that had been compounding for months.
The awkward part: the conversion problem was not subtle. It was sitting in the checkout funnel in plain sight. We had added steps to the checkout process to collect more customer data. Every step added was a decision point where a buyer could change their mind. The team knew this in principle. But because nobody was looking at the revenue-per-session number, the cumulative effect had not registered as a crisis. It registered as a data collection improvement.

Same store, two dashboards. Traffic growing 23% while revenue per session fell 31% over the same period. Dashboard A showed a business performing well. Dashboard B showed a business losing £72,400 every month. Image: Ammarah Ahmed / Precision Consulting
What the wrong metric does to a team
This is the part that I think gets underappreciated in conversations about metrics and measurement.
A metric is not just a number. It is a signal about what the organisation values. When traffic is the primary number, the team optimises for traffic. Ad spend goes toward reach rather than intent. Content gets produced for volume rather than quality. Features get built to bring people in rather than to help the people who are already there.
Every one of those decisions is locally rational. It moves the metric you are tracking. The problem is that none of them necessarily move revenue, and in some cases they actively work against it.
At one of the platforms I worked at, we had a metric for the number of restaurant partners listed on the app. More listings meant more choice, which we believed meant more orders. The metric went up for eighteen months. Then we ran an analysis on order completion rates by city and found that the cities with the most restaurant options had the lowest order completion rates. The choice was overwhelming buyers. Hick’s Law operates at the platform level too: more options, more paralysis, fewer decisions.
We had spent eighteen months and significant resources optimising for a metric that was negatively correlated with the outcome we wanted.
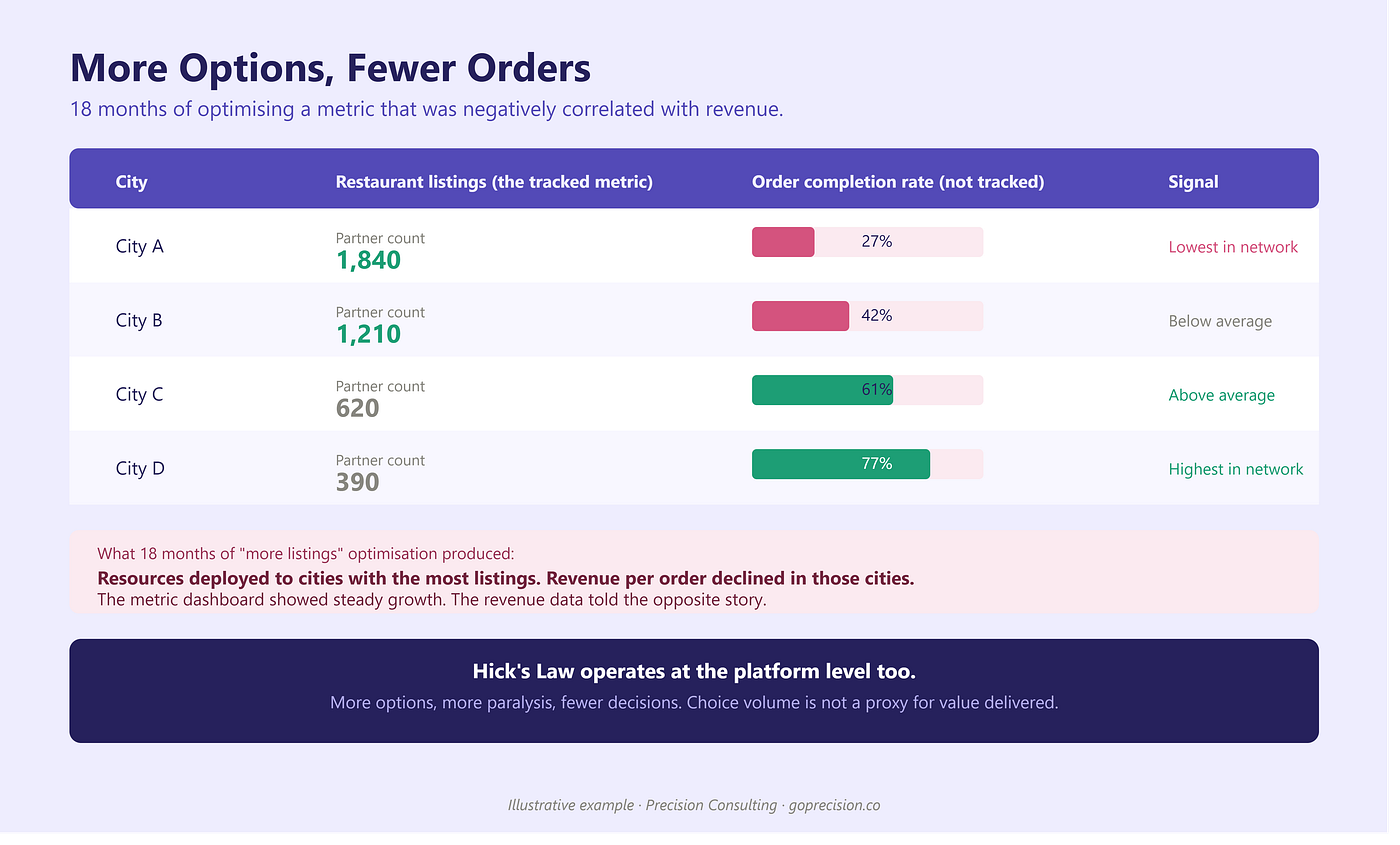
Illustrative data from a food delivery platform: cities with the most restaurant listings had the lowest order completion rates. The tracked metric grew for 18 months while the revenue signal moved in the opposite direction. Image: Ammarah Ahmed / Precision Consulting
The replacement question
The shift that actually changed how I think about this is deceptively simple. Instead of asking ‘what metric should we track?’ I started asking ‘what is the decision this metric is supposed to inform?’
Traffic informs acquisition decisions: where to spend, which channels to prioritise, whether the top of the funnel is healthy. It is the right metric for those decisions. It is the wrong metric for decisions about whether your product is working.
Revenue per session is a better metric for the latter because it collapses conversion rate and average order value into a single number. It tells you what each visitor is actually worth, not how many of them arrived. A business with 50,000 monthly sessions and a revenue per session of £3.20 understands its lever differently than a business that tracks sessions and AOV separately and has never multiplied them together.
The metric you choose should force the right question. Traffic forces the question ‘how do we get more people here?’ Revenue per session forces the question ‘how do we make the experience worth more for the people already here?’ Those are different problems with different solutions, different team priorities, and different investment decisions.
The version of this that founders get wrong most often
I run a conversion optimisation consultancy now, and I work with growth-stage e-commerce founders. The version of this problem I see most often is not the dramatic case of the wrong metric hiding a declining business. It is the quieter case of the right metrics not being looked at together.
A founder knows their conversion rate. They know their AOV. They know their traffic. But they have never calculated what a 1% improvement in conversion rate is worth in annual revenue, held constant everything else. So when the engineering team says the checkout redesign will take eight weeks and the growth team says the new ad campaign can launch in two, the ad campaign wins by default. Not because the founder decided that traffic was more valuable than conversion. Because the comparison was never made in the numbers.
On a store doing £75,000 in monthly revenue, a 40% improvement in conversion rate is worth £360,000 per year. A 35% improvement in average order value on the same baseline, compounded with the conversion improvement, produces over £800,000 in annual revenue uplift. Without a single additional visitor.
These are not complicated calculations. They take about ten minutes. But most founders have never done them, because they have never been prompted to, because the metric dashboard they look at every morning does not surface the question.
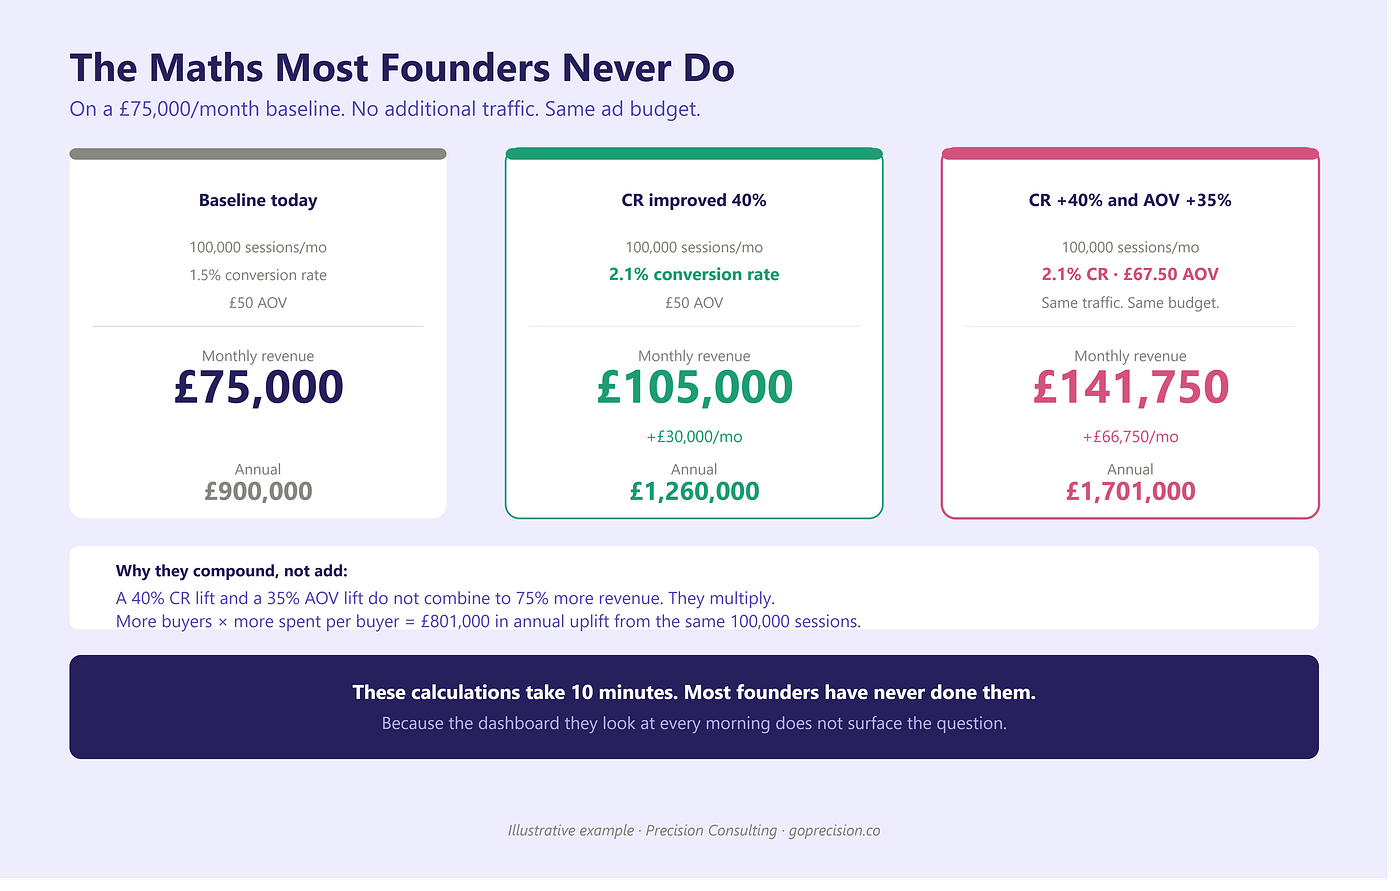
The compounding maths on a £75,000/month baseline: a 40% conversion rate improvement adds £360,000 annually. Add a 35% AOV improvement and the combined uplift exceeds £800,000 per year — from the same 100,000 monthly sessions. Image: Ammarah Ahmed / Precision Consulting
What I would do differently
If I were building the measurement framework from scratch, I would start with one question: what does it look like when the business is healthy? Then I would work backward to find the smallest number of metrics that together answer that question, and I would resist adding any metric that does not directly inform a decision I am making in the next 90 days.
For most e-commerce businesses, that is: revenue per session (product working), contribution margin per order (unit economics sound), repeat purchase rate (customers coming back), and checkout completion rate (no obvious friction). Everything else is a supporting metric that you pull when one of those four moves in the wrong direction.
The dashboard should prompt questions, not provide comfort. If you look at it every morning and feel reassured, it is probably showing you the number that is easiest to move rather than the number that matters most.
I do not think this is a metrics problem, fundamentally. It is an incentive problem. The metric that gets tracked is usually the metric that someone is compensated to move, or the metric that is easiest to show in a board deck, or the metric that went up last month when everything else felt uncertain.
Founders are not less analytical than operators. They are just operating with fewer resources, more pressure, and a natural tendency to reach for the number that confirms the business is moving. That is a human response to an uncertain situation, not a failure of rigour.
The rigour comes in building the habit of asking, once a quarter at minimum: is this still the right number? Is it telling me what I think it is telling me? And is there a number I am not looking at that would change the decisions I am making?
Usually there is.
Ammarah Ahmed is the founder of Precision Consulting (goprecision.co), a CRO and UX consultancy for growth-stage e-commerce brands. She spent over a decade leading growth and product teams at Delivery Hero, Foodpanda, Talabat, and Daraz across MENA and Southeast Asia.
메타데이터
- post_id
- 81433853b8f4
- slug
- the-metric-that-felt-like-progress-was-the-one-costing-me-the-most-81433853b8f4
- url
- https://ehandbook.com/the-metric-that-felt-like-progress-was-the-one-costing-me-the-most-81433853b8f4
- canonical_url
- https://ehandbook.com/the-metric-that-felt-like-progress-was-the-one-costing-me-the-most-81433853b8f4
- author_url
- https://medium.com/@ammarah_ahmed
- status
- ok
- fetched_at
- 2026-07-17 02:05:58