TEVA Stock — Technical & AI Analysis (Live Data)1. Company SnapshotTeva Pharmaceutical Industries
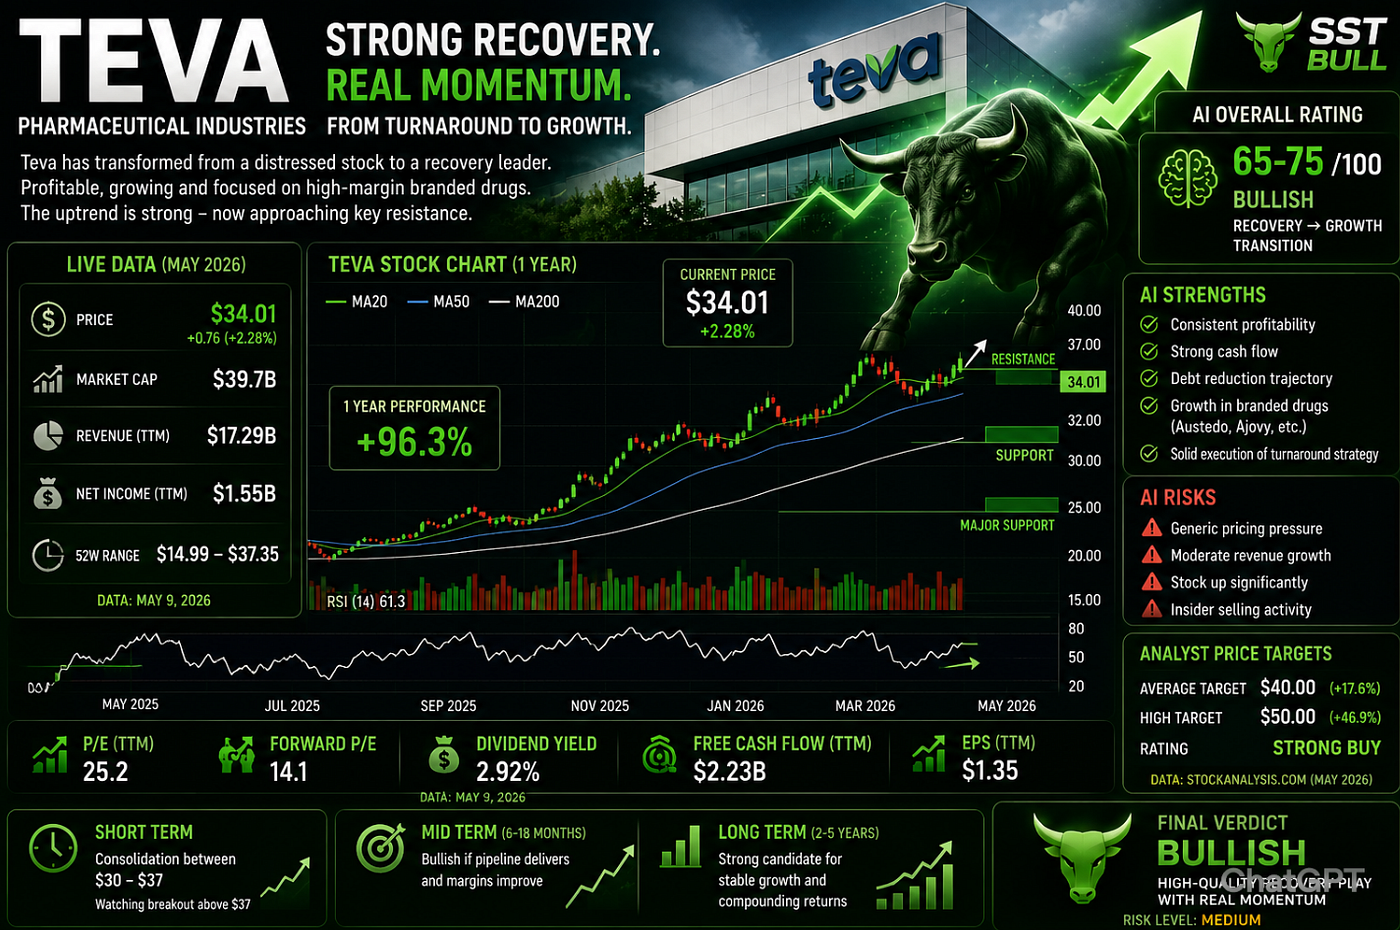
Current price: ~$34
TEVA Stock — Technical & AI Analysis (Live Data)1. Company SnapshotTeva Pharmaceutical Industries
- Current price: ~$34
- Market cap: ~$39.7B
- Revenue (TTM): ~$17.3B
- Net income: ~$1.5B (profitable)
- 52-week range: $14.99 — $37.35
Key shift: TEVA has moved from a distressed stock → strong recovery leader
- Technical Analysis (Current Structure)Trend
- Long-term trend: Strong bullish reversal
- 1-year performance: massive recovery (near doubling)
- Current position: near multi-year highs
This is no longer a turnaround setup — it’s an active uptrend
Key Levels
- Support: $30 — $32
- Major support: $25
- Resistance: $37 — $40
A breakout above $37 = continuation Rejection = short-term pullback likely
Momentum
- Momentum: Strong but slightly extended
- Volume: rising during bullish moves
- Structure: higher highs + higher lows
Interpretation:TEVA is in a confirmed uptrend, but approaching resistance
- AI-Based AnalysisAI Score (Composite)
- Rating: 65–75 / 100 → Bullish
- Category: Recovery → Growth transition
AI Bull Signals
- Consistent profitability (rare in pharma turnarounds)
- Strong cash flow
- Debt reduction trend
- Shift toward high-margin branded drugs
Example:
- Branded drugs like Austedo and Ajovy are driving growth
AI Risk Signals
- Generic drug pricing pressure
- Growth still moderate vs biotech disruptors
- Stock already ran significantly (valuation expansion)
AI ConclusionTEVA is no longer “cheap turnaround” — it is now a quality compounder with momentum
- Fundamental + AI Hybrid InsightBull Case
- Pipeline expansion and new drug approvals
- Transition from generics → branded pharma
- Strong execution of “pivot to growth” strategy
Market is rewarding:
- stability
- execution
- predictable earnings
Bear Case
- Revenue growth still modest
- Generics business under pressure
- Some insider selling observed (not uncommon)
- Analyst vs AI View
- Analysts: Strong Buy
- Avg price target: ~$40 (+18%)
- High target: ~$50 (+46%)
Alignment:
- Both AI and analysts are now bullish
- Valuation Perspective
- P/E: ~25 (reasonable for pharma recovery)
- Forward P/E: ~14 (growth expected)
Interpretation: Market is pricing in continued improvement, not hype
- Final VerdictShort-Term (0–6 months)
- Likely: consolidation between $30–$37
- Needs breakout for continuation
Mid-Term (6–18 months)
- Bullish if:
- pipeline delivers
- margins keep improving
Long-Term (2–5 years)
- Strong candidate for:
- stable growth + compounding returns
Investment ConclusionOverall Rating
- Technical: ✅ Bullish
- AI Model: ✅ Bullish
- Risk Level: ⚠️ Medium
Final stance: TEVA has successfully transitioned from a turnaround stock into a high-quality recovery play with real momentum. The easy gains may already be behind, but the trend remains strong as long as execution continues. www.swingstocktraders.com
메타데이터
- post_id
- 8151cf94db2c
- slug
- teva-stock-technical-ai-analysis-live-data-1-company-snapshotteva-pharmaceutical-industries-8151cf94db2c
- url
- https://medium.com/@winstmaken/teva-stock-technical-ai-analysis-live-data-1-company-snapshotteva-pharmaceutical-industries-8151cf94db2c
- canonical_url
- https://medium.com/@winstmaken/teva-stock-technical-ai-analysis-live-data-1-company-snapshotteva-pharmaceutical-industries-8151cf94db2c
- author_url
- https://medium.com/@winstmaken
- status
- ok
- fetched_at
- 2026-06-09 15:37:30