Your SOC Has a Secret Weapon. Almost Nobody Uses It.
Microsoft Sentinel’s UEBA changed a lot in 2025–2026. Here’s what’s new, why it matters and how it can improve your workflow explained…
Your SOC Has a Secret Weapon. Almost Nobody Uses It.
Microsoft Sentinel’s UEBA changed a lot in 2025–2026. Here’s what’s new, why it matters and how it can improve your workflow explained simply for all levels.
Imagine you manage a bank.
One of your employees- Sarah, comes in every day at 9 AM. She makes coffee, opens about 12 accounts, takes lunch, closes some accounts and leaves at 5pm. Same routine, every day for years.
Then one day she shows up at 2am. In 20 minutes, she opens 800+ accounts and sends money to a bank you have never worked with.
You do not need a rule or alert to tell you something is wrong. You just need to know what “normal” looks like for Sarah.
That is UEBA in simple terms.
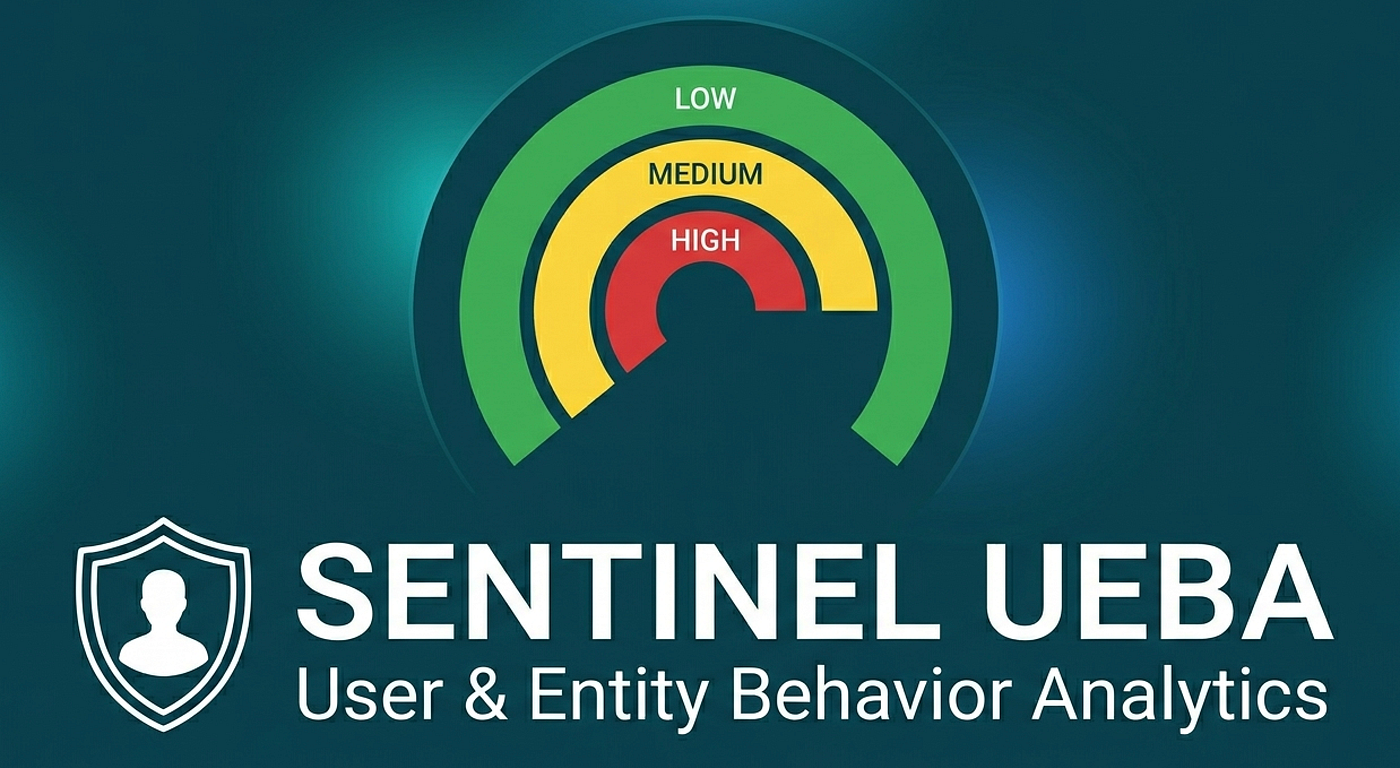
Microsoft Sentinel UEBA tracks how users, devices and IPs usually behave. It learns their normal patterns over time and flags anything that looks unusual.
Most analysts already know this. But many still ignore UEBA signals and go straight to raw logs. That is exactly the gap this is meant to highlight.
What just changed and why now matters
If your understanding of UEBA is from a couple of years ago, it’s already outdated. A lot has changed in 2025–2026 and some of it really matters for day-to-day work.
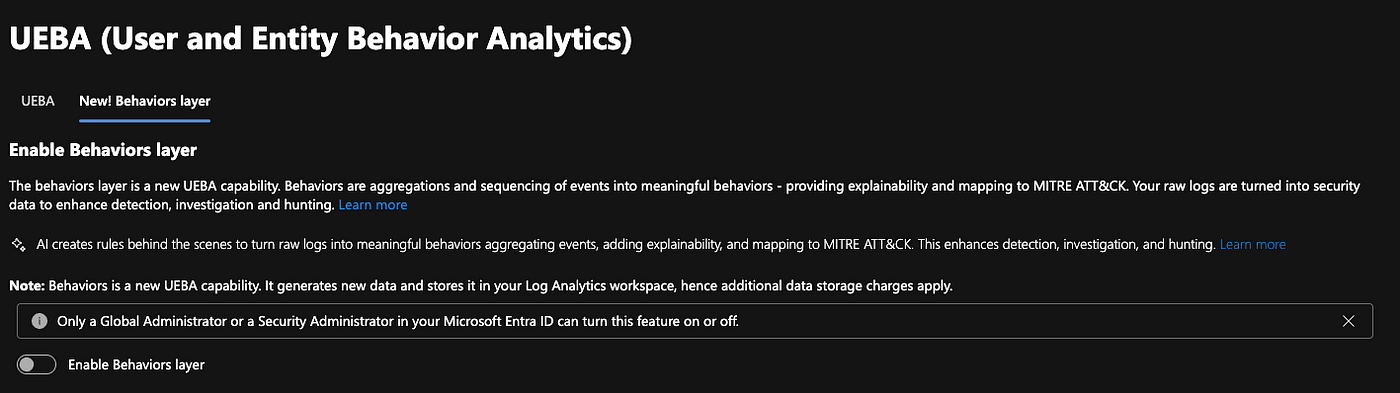
The biggest shift is the new Behaviors layer. Earlier, UEBA mostly gave you scores and anomaly alerts. Now it can read raw logs and turn them into clear sentences like: “this user accessed 47 secrets in one hour.” It also maps this activity to MITRE ATT&CK. So instead of digging through noisy logs, you get a straightforward story of what actually happened. These are not alerts just clean, readable activity summaries.
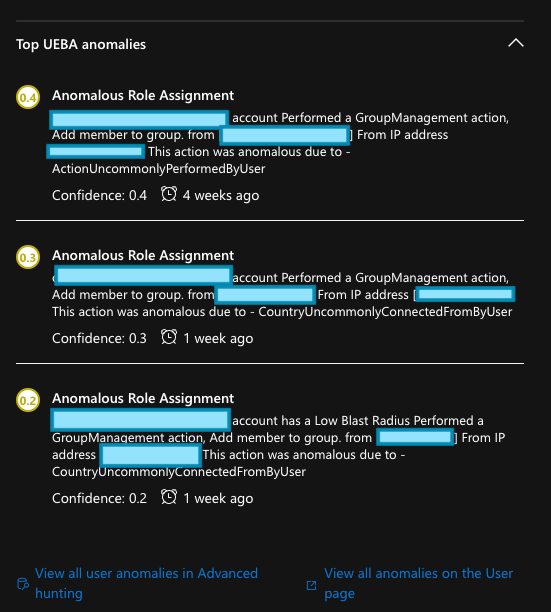
UEBA now monitors GCP in a much more complete way, similar to how it already works with Entra ID.
For Okta users, Okta V2 support is now included. UEBA detections work with the newer OktaV2 logs, so teams using the updated connector still get proper anomaly detection.
Another small but useful change: settings are now in one place. UEBA and Behaviors are grouped together in the Sentinel settings, instead of being scattered around.
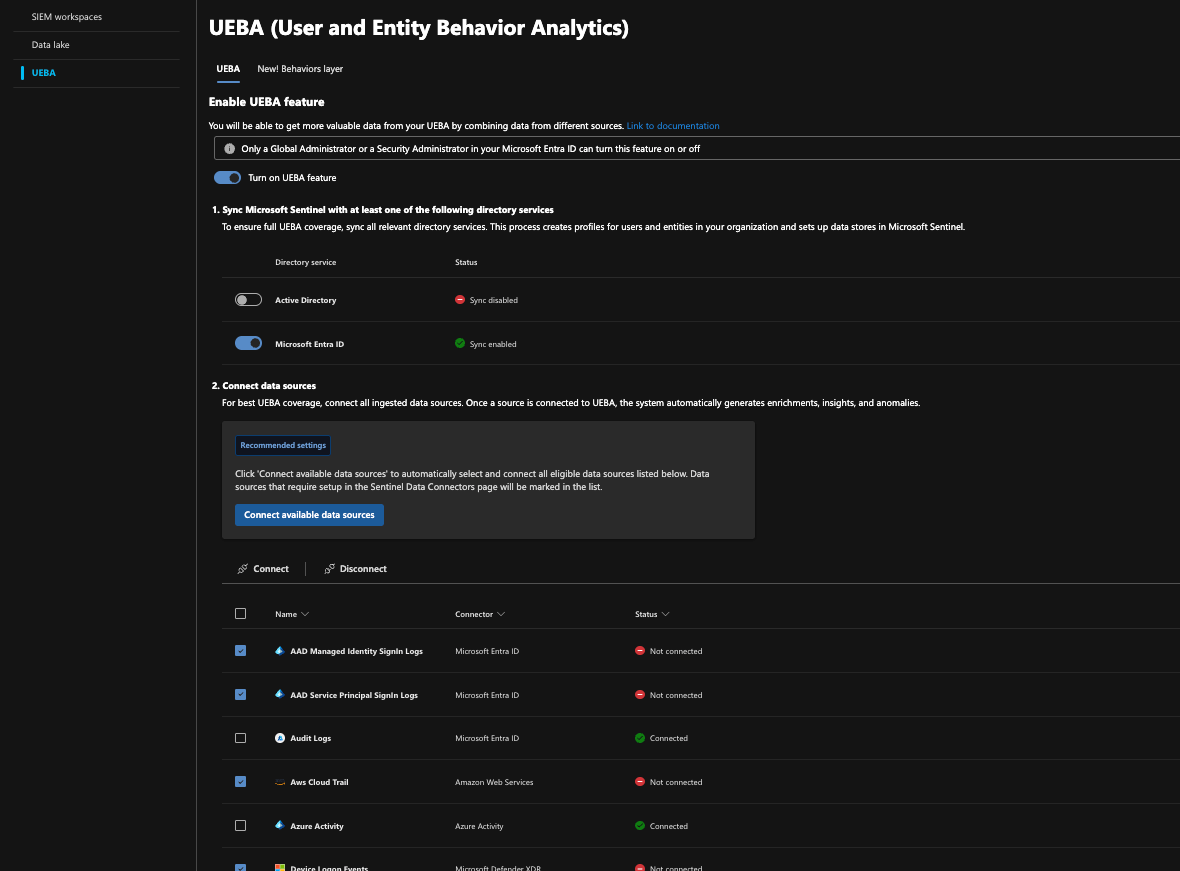
Now let’s look at some practical use cases you can use every day in investigations.
Use case1- Read the story before you read the logs
An alert fires. Possible credential theft. You open the incident, see it is tied to an AWS account and start querying. You pull AWSCloudTrail, get 200 rows back and spend the next 20 minutes piecing together what happened.
Now imagine the same incident with the Behaviors Layer turned on.
You open the incident and, before writing a single query, you already have a plain-English summary of the activity. That means you can understand the incident much faster and decide what to investigate next without starting from raw logs.
BehaviorInfo
| join kind=inner BehaviorEntities on BehaviorId
| where TimeGenerated >= ago(1d)
| where EntityType == "User"
| where AccountUpn == "sara@example.com"
| project TimeGenerated, ActionType, Description, Categories,BehaviorId,AttackTechniques
One important caveat: the Behaviors Layer currently covers AWS CloudTrail, GCP Audit Logs, CyberArk, and Palo Alto Threats. If the incident is only using Microsoft-native tables, you will not see Behaviors Layer summaries for those sources yet.
Use case2- Stop using one score. Use both.
Most analysts see the InvestigationPriority score on an entity page, label it high or low and move on. But UEBA actually gives you two different signals and using only one is misleading.
Think of InvestigationPriority like a smoke alarm. It reacts fast when something unusual happens, like a user signing in from a new country for the first time. It is loud, immediate and event-driven.
Think of AnomalyScore like a doctor watching long-term health trends. It picks up slow, subtle changes over time — things like behavior drifting for days or weeks that no single event would flag on its own.
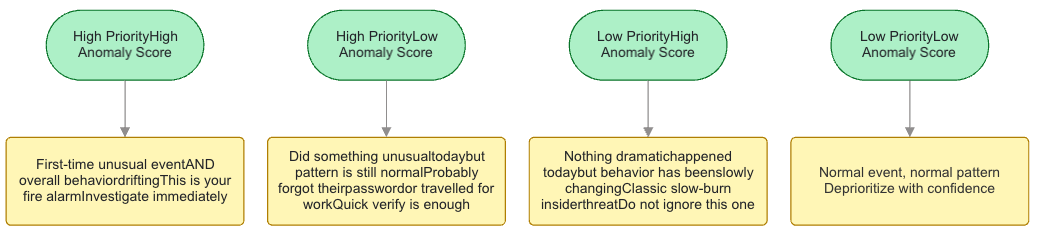
The query to pull both scores side by side:
let highAnomalies =
    Anomalies
    | where TimeGenerated > ago(7d)
    | where Score > 0.8
    | project
        UserPrincipalName,
        AnomalyScore = Score,
        AnomalyTime = TimeGenerated;
let ueba = BehaviorAnalytics
    | where TimeGenerated > ago(7d)
    | summarize
        MaxPriority = max(InvestigationPriority),
        TotalEvents = count()
        by UserPrincipalName;
ueba
| join kind=inner highAnomalies on UserPrincipalName
| summarize
    MaxPriority = max(MaxPriority),
    MaxAnomalyScore = max(AnomalyScore),
    AnomalyCount = count(),
    TotalEvents = any(TotalEvents)
    by UserPrincipalName
| extend ScenarioType = case(
    MaxPriority >= 5 and MaxAnomalyScore >= 0.8, "Investigate immediately",
    MaxPriority >= 5 and MaxAnomalyScore < 0.8,  "High priority - verify",
    MaxPriority < 5  and MaxAnomalyScore >= 0.8,  "Suspicious anomaly pattern",
    "Low priority"
)
That is why the combination matters. A low InvestigationPriority score does not always mean “safe.” If the AnomalyScore is high, the user’s behavior may have been changing quietly for weeks. That is exactly the kind of pattern teams miss when they look at only one number.
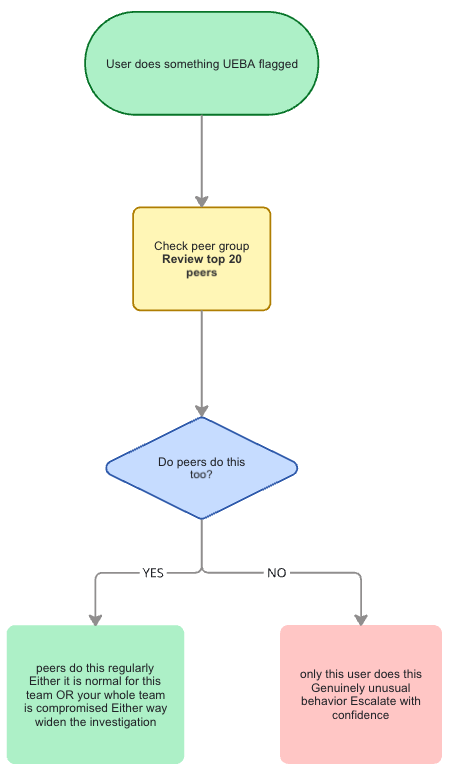
Use Case3-Ask this first: is this unusual for this person or just normal for their team?
That one question changes the whole investigation. A finance analyst downloading 2,000 files looks suspicious at first, but if everyone in finance does the same thing during month-end close, it may be normal.
// Get peer user IDs
let peers =
    UserPeerAnalytics
    | where UserId == "xxxxx-xxxxxx-xxxxxxxx-xxxxxxxxx"
    | distinct PeerUserId;
// Map peers to UPNs
let PeerUPN =
    IdentityInfo
    | where AccountObjectId in (peers)
    | project AccountUPN;
// Check their behavior
BehaviorAnalytics
| where TimeGenerated > ago(7d)
| where UserPrincipalName in (PeerUPN)
| summarize EventCount = count() by UserPrincipalName, ActivityType
UEBA helps by comparing each user to their peers. It automatically builds a peer group for them based on things like group memberships, mailing lists and shared resources, so you can see whether the activity is strange for that person or just part of the role.
If Sarah’s entire finance team shows the same “unusual” activity nobody is suspicious. If only Sarah shows it you have something.
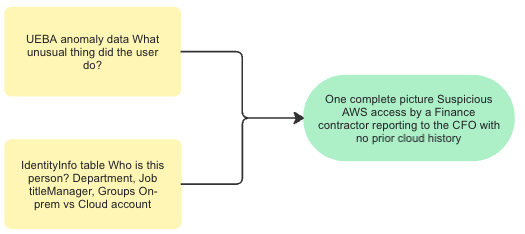
Use Case4- Add the “who is this person” layer in one query
Old workflow: look up the user in the incident, raise a ticket to IT for their department and access level, wait for a reply, then continue.
New workflow: one query.This became much easier with the unified IdentityInfo table in May 2025. Before that, UEBA data and identity data were split apart, so investigations took longer and needed more back-and-forth.
BehaviorAnalytics
| where TimeGenerated > ago(7d)
| where InvestigationPriority >= 5
| join kind=leftouter (
    IdentityInfo
    | summarize arg_max(TimeGenerated, *) by AccountUpn
) on $left.UserPrincipalName == $right.AccountUpn
| project TimeGenerated,UserPrincipalName,ActivityType,InvestigationPriority,Department,JobTitle,Manager ,IsAccountEnabled,SourceProvider,AssignedRoles
The fields that matter most are simple but powerful. Department helps you tell the difference between something odd and something expected for that role. JobTitle gives the same context, because a senior manager touching systems their team never uses is worth a closer look. Manager is useful when you need to quickly confirm whether the action was expected or authorized. SourceProvider helps spot hybrid accounts acting in cloud-only systems they have never used before. And if IsAccountEnabled is false but the account is still active, that is an immediate escalation.
Use Case5- Check what the attacker could reach from here
Here is the question that every senior analyst asks and every junior forgets: If this account is compromised, how bad is it?
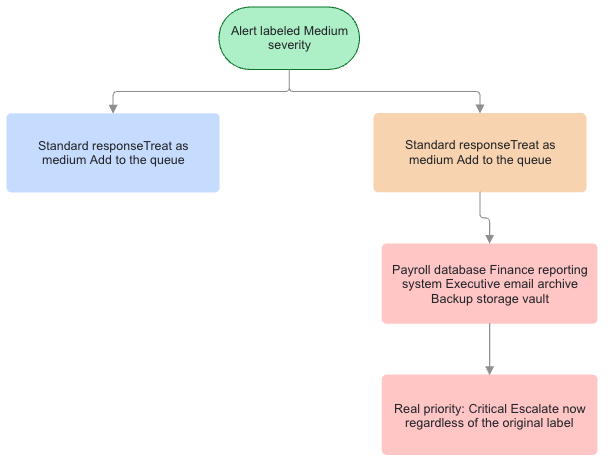
A “medium” severity alert on a regular user account is a very different situation from a “medium” severity alert on someone who accessed the payroll database, the executive email archive and the backup vault in the last 24 hours.
UEBA can show you this. Most analysts never check it.
// What systems has this user touched recently?
// Did they touch anything sensitive?You can add what you think sensitive
let sensitive = dynamic(["payroll","finance","executive","backup","vault","secret","admin","Update"]);
BehaviorAnalytics
| where TimeGenerated > ago(7d)
| where UserPrincipalName == "sara@example.com"
| where ActivityInsights has_any (sensitive)
| project TimeGenerated, ActivityType, ActionType,SourceIPAddress, DestinationIPAddress,ActivityInsights
The blast radius is what justifies your escalation to leadership. Not “the UEBA score was high.” But “this account touched the payroll system, the executive archive and backup storage in the same window as the anomaly here is the evidence.”
Use case6- Find the attack chain hiding between the alerts
Here is something nobody tells junior analysts: most real attacks do not trigger a single big alert. They trigger five small ones that nobody connects.
Attacker gets access → creates an AWS key (small alert, often auto-closed) → uses the key from a new IP (another small alert) → makes privileged API calls (third small alert) → exfiltrates data (fourth alert — now everyone notices but the damage is done).

The Behaviors Layer changes this because it stores behaviors in sequence. You can now look at what happened in order not just what triggered alerts.
// Show me all behaviors in MITRE attack order for a user
// Read the output chronologically look for a progression
BehaviorInfo
| join kind=inner BehaviorEntities on BehaviorId
| where TimeGenerated >= ago(30d)
| where EntityType == "User"
| where AccountUpn == "sara@example.com"
| where Categories has_any (
    "Initial Access", "Execution", "Persistence",
    "Privilege Escalation", "Defense Evasion",
    "Credential Access", "Discovery",
    "Lateral Movement", "Collection", "Exfiltration"
)
| project TimeGenerated, Title, Description, Categories
Read the output top to bottom, chronologically. Does the MITRE tactic change as time goes on? Initial Access → Privilege Escalation → Credential Access → Exfiltration is a complete attack chain. Seeing it laid out like this, instead of buried in four separate incidents, is the difference between catching the attack early and writing the post-mortem.
Hunt for behaviors your environment has never seen before:
// Find behavior types that appeared for the first time recently
// New behavior types = either a new attack or a new workflow worth understanding
let seen_before = BehaviorInfo
| where TimeGenerated between (ago(90d) .. ago(1d))
| distinct ActionType; //You can also check with Title
BehaviorInfo
| where TimeGenerated > ago(1d)
| where ActionType !in (seen_before)
| project TimeGenerated, Title,ActionType, Description, Categories, AttackTechniques
If a behavior type appears today that has never appeared in 90 days of history, that is one of the strongest signals you can get that something genuinely new is happening.
Use Case7- Use UEBA to make your detection rules smarter
This is especially useful for detection engineers who are tired of noisy alerts. Most rules fire on an event by itself, which means they catch a lot of harmless behavior too. Ten failed logins in five minutes may be suspicious, but it can also be an intern who forgot their password, an executive on a new device or a developer testing a script.
// Only alert on suspicious sign-ins from users
// who UEBA has already flagged as anomalous
let HighRiskUsers =
    BehaviorAnalytics
    | where TimeGenerated > ago(1d)
    | where InvestigationPriority >= 6
    | distinct UserPrincipalName;
SigninLogs
| where TimeGenerated > ago(1h)
| where ResultType == 0
| where UserPrincipalName in (HighRiskUsers)
| extend
          DeviceId   = tostring(DeviceDetail.deviceId),
          ADjoined = tostring(DeviceDetail.trustType),
          NamedLocation=tostring(parse_json(NetworkLocationDetails)[0].networkType)
| where NamedLocation !in ("trustedNamedLocation")
| where ADjoined !in ("Azure AD registered","Azure AD joined" ,"Hybrid Azure AD joined")
| project TimeGenerated, UserPrincipalName, IPAddress, Location, AppDisplayName,DeviceId
This rule does not fire on every successful login. It fires only when the login belongs to someone UEBA has already been watching. The behavioral context becomes the filter that separates signal from noise.
The complete UEBA table map
Before you start querying, it helps to understand the full UEBA picture. There are two parts: the data sources UEBA reads from and the output tables UEBA writes to.
Layer 1: data sources
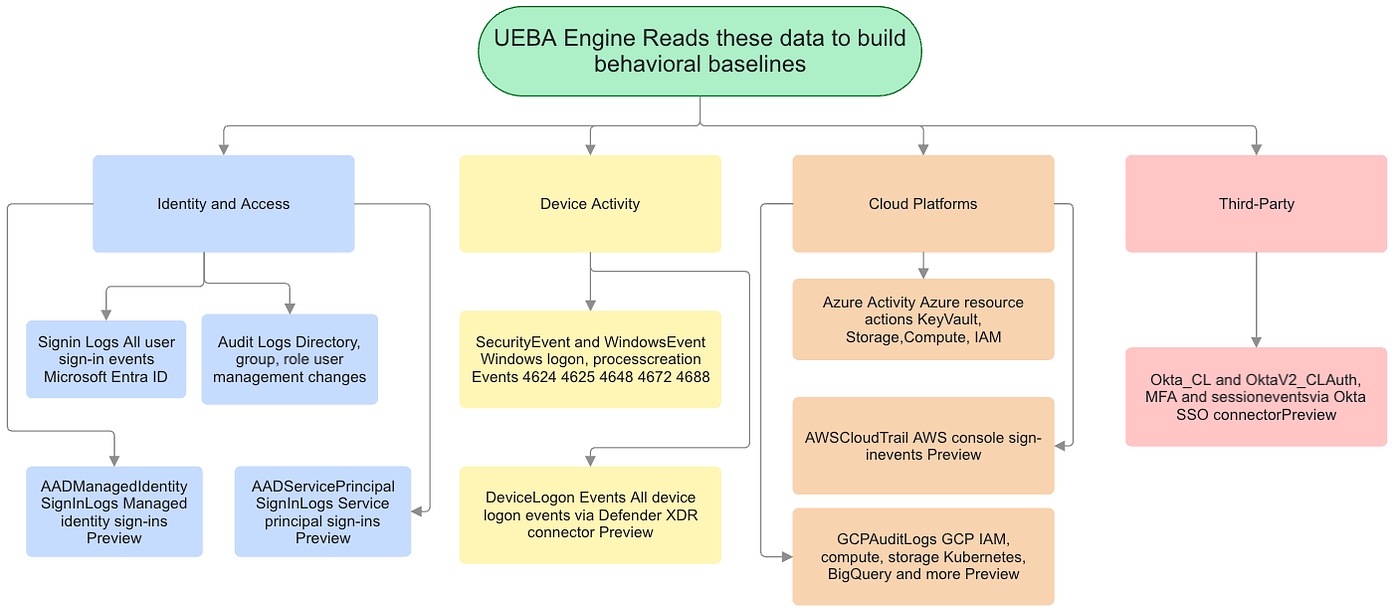
These are the tables UEBA uses to build behavioral baselines. The more of these you connect, the better the anomaly detection becomes.
What “Preview” means here: the table is supported by UEBA and works in production, but Microsoft may still adjust the schema or coverage. Safe to use — just check release notes if queries break after a Sentinel update.
Layer 2 — Output tables UEBA writes to
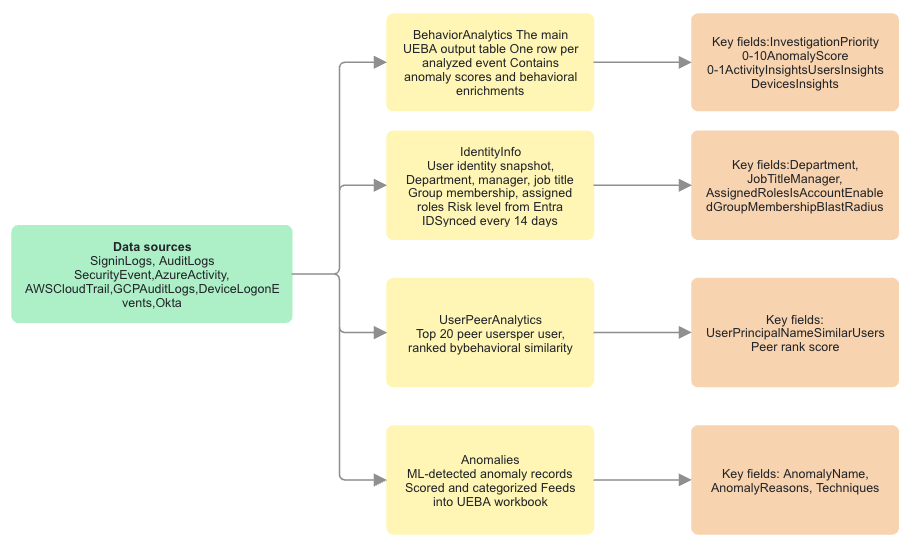
After UEBA reads from the data sources above, it writes its analysis, enrichments, and behavioral scores into these output tables. These are what your investigation queries use.
Layer 3 — The Behaviors Layer (separate system, limited sources)
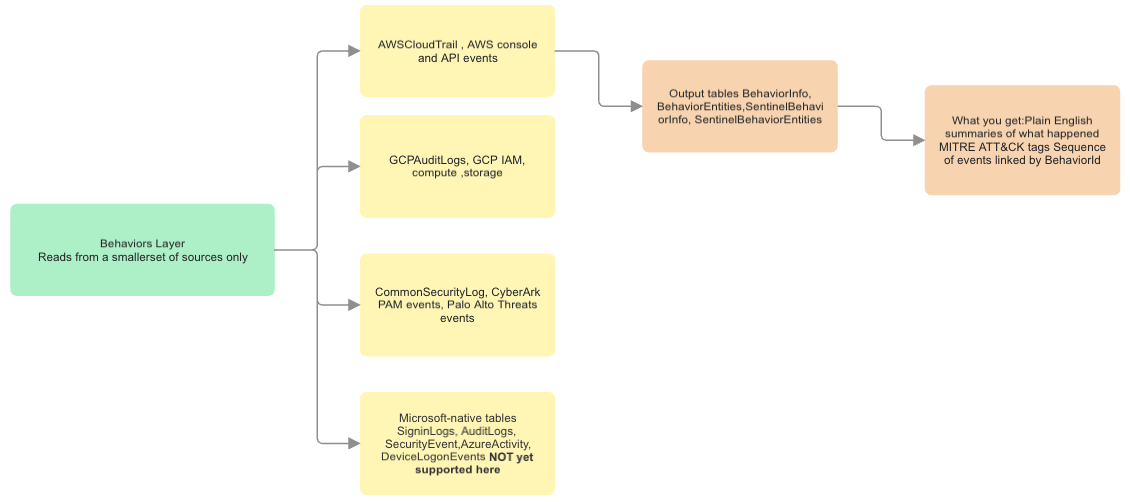
The Behaviors Layer is a separate feature from UEBA analytics. It adds a third set of tables that translate raw logs into plain English narratives.
UEBA itself is included with Sentinel at no extra cost. The Behaviors Layer creates additional log records billed at your standard ingestion rate — they add to your workspace, they do not replace raw logs.
What UEBA will not tell you
Behaviors are just observations. They tell you that something happened, not that it was an attack. And if you do not see a behavior record, that does not prove nothing happened if something feels off, always check the raw logs.
UEBA itself is broader than the Behaviors Layer. The analytics, anomaly scores, peer groups, and identity enrichments still work across the Microsoft-native sources you have connected. The limited part is the Behaviors Layer, which currently only produces plain-English narratives for AWS CloudTrail, GCP Audit Logs, CyberArk, and Palo Alto Threats. If your incident is Microsoft-only, you will not get those narrative summaries, but the rest of UEBA still applies.
There is also a warm-up period. UEBA baselines need about 14 to 21 days to settle, so a brand-new workspace will be noisy and less reliable. That is why you should avoid making high-stakes decisions from it too early.
And one more practical limit: the Behaviors Layer can currently be enabled on only one Sentinel workspace per tenant. That workspace should be the one with the widest and most useful data coverage.
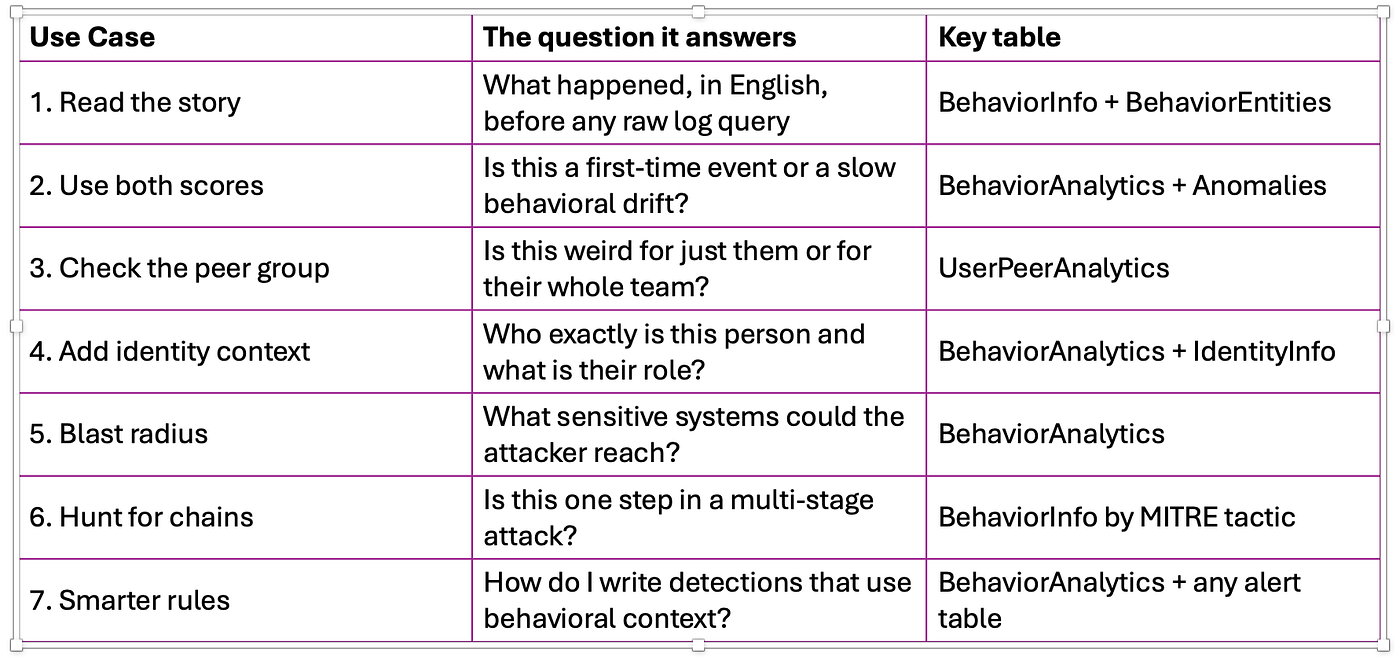
Quick reference
Closing
Go back to Sarah.
She walked into the bank at 2am and opened 847 accounts. The bank manager spotted it because he knew her normal routine. Not because he had a policy for “too many accounts opened before sunrise.” Not because an algorithm flagged her account type. Because he knew what normal looked like, and this was not it.
UEBA is that bank manager, running continuously, for every user and device in your environment while you sleep.
Most analysts have it turned on. Almost none of them use it past the first screen.
메타데이터
- post_id
- 83d09bfa4563
- slug
- your-soc-has-a-secret-weapon-almost-nobody-uses-it-83d09bfa4563
- url
- https://detect.fyi/your-soc-has-a-secret-weapon-almost-nobody-uses-it-83d09bfa4563
- canonical_url
- https://detect.fyi/your-soc-has-a-secret-weapon-almost-nobody-uses-it-83d09bfa4563
- author_url
- https://medium.com/@rohitashokgowd
- status
- ok
- fetched_at
- 2026-06-26 06:47:43