Smaller, Slower, Wrong: What Aggressive Quantization Costs On-Device Inference
On my Pixel, the most compressed model I built ran slower than the bigger one, and it thought a dog was a shower curtain
Smaller, Slower, Wrong: What Aggressive Quantization Costs On-Device Inference
On my Pixel, the most compressed model I built ran slower than the bigger one, and it thought a dog was a shower curtain
Running AI inference on an Android device, you are bound by the constraints of the phone. The size of the model, the CPU/GPU costs to run it, the heat from processing. My intuition was simple: a smaller model should be faster and cheaper to run. Quantization makes models smaller, so quantize harder and you win on every axis, right? That is the assumption I carried into an on-device benchmark, and it was wrong. When I ran the same image model at three sizes on my Android phone, the smallest version was not the fastest. It was slower than the mid-size one, and it got the answer wrong. Here is what happened and, more usefully, why.
First, the setup: Running on-device inference and model processing means no round trips to a server for analysis. All processing stays on the device. Great for privacy and no server cost, no network calls. But in doing so, it requires putting the model on the physical device. Gemini Nano now exists, but let’s say you want a specialized model to run with your APK. You’ll likely need to quantize it. You shrink the model by storing its weights at a lower precision. Typical weights exist as 32-bit floats and can be shrunk down to 8- or 4-bit ints. This lowers the size of the model, but comes with certain trade-offs.
So in this experiment (a hands-on look, not a rigorous study) I used an image classifier model, MobileNetV2, quantized it through Colab and created INT8 and INT4 models. (Both used the default post-training settings with no calibration dataset: INT8 dynamic-range, INT4 weight-only.) This shrank the model from 14.0MB (FP32) to 3.8MB (INT8) and 2.2MB (INT4). I ran all 3 models against my own benchmark app on my Pixel 10 Pro, across CPU and GPU, and logged the results. The benchmark app is on GitHub if you want to see exactly how I measured this: https://github.com/merrickcr/AIBenchmark
I timed 20 runs each and reported the median, so one slow run couldn’t skew the result. I threw away the first few warm-up runs, since the first inference after loading a model is always the slowest (more on that later). And purely out of curiosity, I read the delegate logs after each run to see what was happening and which processor actually executed the model. That last detail ended up mattering more than I expected.
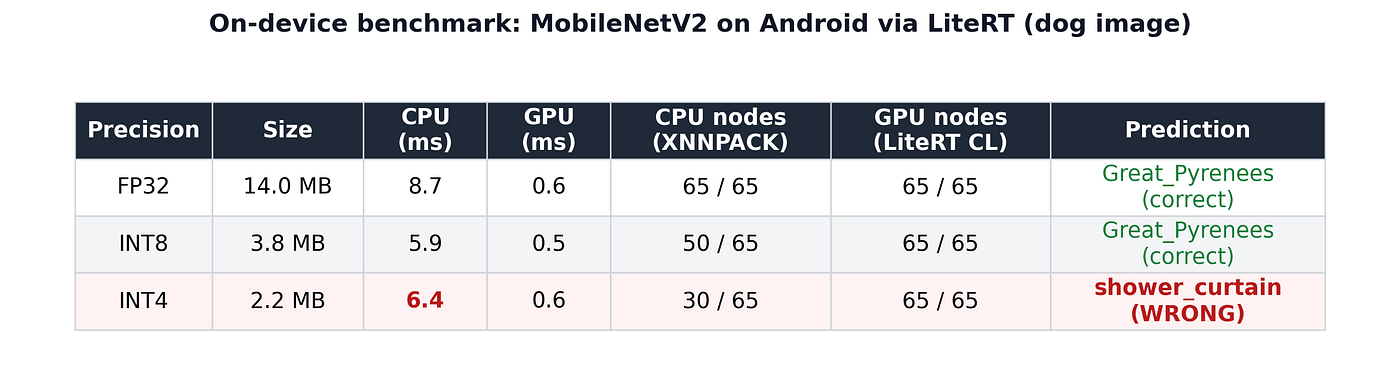
Same MobileNetV2, three precisions, on a real phone. INT4 was the smallest yet slower on CPU, and it got the prediction wrong.
I ran a photo of a dog in the woods through all three. Here is how the results trended. Notably, as the model size went down, each run got faster, that is until I used my INT4 quantized model. Not only did the INT4 model run slower, it also got the prediction wrong. But why?
Look at the CPU column first. Going from FP32 to INT8, the model got both smaller and faster, 8.7 ms down to 5.9 ms. That is the win you expect from quantization. But INT4, the smallest model, went the wrong way: 6.4 ms, slower than INT8. And since that’s the median of 20 runs, it’s a consistent gap, not one unlucky measurement. Smaller, but slower. The reason was in the delegate logs.
On CPU, LiteRT runs the model through XNNPACK, a library that is very fast at floating-point math but supports fewer quantized operations. Each run logged how many of the model’s 65 operations it could actually accelerate. 65 of 65 for FP32, 50 of 65 for INT8, and only 30 of 65 for INT4. The harder I quantized, the more operations dropped off the fast path onto slow, generic kernels.

Logs showing a drop in XNNPACK nodes with quantization to 4 bits. Warm-up speed and run speed follow
And on top of that, INT4 pays an extra cost at runtime, and to see why you need to know how the weights are stored. A CPU has no native instructions for 4-bit math, so a 4-bit weight can’t be used as-is. The weights are packed two to a byte, the top 4 bits for one and the bottom 4 for the other, so before the CPU can compute with them, each one has to be pulled out and expanded into a full-size number it can actually work with. You save space by packing them, but you pay for it by unpacking at runtime, something INT8 weights don’t need.
So INT4 loses on both counts: the fast-path drop (measured, straight from the node counts) and the unpacking overhead (inferred, since I didn’t isolate it from the fallback kernels). Either way, the smallest model on disk did the most work at runtime. The file size predicted the opposite of what actually happened, and the node counts told the real story. One caveat worth stating: this ran on LiteRT 2.1.0, and INT4 is a newer, narrower path in the tooling, so treat the INT4-was-slower result as a snapshot of today’s runtime, not a permanent hardware fact.
The GPU told a different story. Every precision ran at essentially the same speed, around 0.5 to 0.6 ms, and quantization made no difference at all. On the GPU all 65 operations were accelerated for every model, so they effectively ran in float and hit the same floor. Quantization’s speed payoff was purely a CPU thing. However, the GPU incurs a hidden cost. Before the first inference it has to build an OpenCL environment and compile the model into GPU kernels. That setup never shows up in the per-run numbers. In this run the first model to touch the GPU paid about 315 ms of setup, while the two after it paid about 150 ms each, because they reused the environment the first one built. That is the cold start, and it is why I threw away the warm-up runs.
This is why, in a real app, you don’t want the user’s first request to be the one that pays for this. The simple fix is to warm the model up at launch. Run one throwaway inference at startup so the compile happens before anyone’s waiting on it. Better yet, the GPU delegate can cache its compiled kernels to disk, so you’re not recompiling from scratch on every cold start, only the very first time the app runs.
So should you just always reach for the GPU? Not quite. There are three catches: the setup cost you just saw, whether the GPU is even available, and what else it is competing with on the device. Start with the setup. That half-millisecond only pays off after you have swallowed the 150 to 300 ms of environment and kernel compilation, so for a single, one-off inference the CPU, with almost no setup, can actually finish first. The GPU pulls ahead only once you run enough inferences to amortize that startup.
Second, the accelerator you want isn’t always there. Android is fragmented, and not every device exposes a usable GPU path. Some models even have operations the GPU delegate doesn’t support, which quietly drops part of the work back onto the CPU. XNNPACK on the CPU always runs, so it is your fallback, and on some phones the only option.
I hit this hardest with the NPU, where integer math like this is supposed to shine. Even on a Pixel 10 Pro it wouldn’t load, and the app cheerfully printed an “NPU” time of 8.6 ms, identical to the CPU, while the logs showed it had silently fallen back to XNNPACK:
NPU accelerator could not be loaded and registered: kLiteRtStatusErrorInvalidArgument
Replacing 65 out of 65 node(s) with delegate (TfLiteXNNPackDelegate)
Third, the GPU is usually busy drawing your UI: push inference onto it and you can drop frames, whereas CPU work on a background thread stays out of the render path. Put it together and the rule is simple: use the GPU for sustained, repeated inference you can warm up, and stay on the CPU for one-shot work, unreliable-GPU devices, or a busy UI. Which is exactly why the CPU’s quantization behavior, the whole first half of this piece, is the part worth getting right.
Speed was not the only casualty. The accuracy of the model dropped as well. Here my pup playing in the woods was relegated to a shower curtain. And it wasn’t just the dog. I ran a second image through as well, and INT4 got that one wrong too, while INT8 stayed correct on both. I’ll be upfront: this was only two images, so treat it as a signal, not a measured accuracy rate. But both times, it was the aggressive INT4 model, and only that one, that broke.

Definitely not a shower curtain
Without turning this into a full ML course, the gist is as follows: with 4 bits, each weight has only 16 possible values to land on, so there’s far less room to be precise. INT8 had enough room to stay accurate. INT4 didn’t, and the model started getting things wrong. I didn’t chase down exactly why this model fell apart at 4 bits (it’s model-specific, plenty of models handle it fine), but the direction was clear. Squeeze too hard and quality breaks. It’s probably both at once: four bits really is less room to be precise, and the basic settings I used made that limit bite harder than it needed to.
The real-world implication is that quantized models are great for smaller install sizes, but you need to make sure they are trained and quantized correctly for your use case. All models here used Post-Training Quantization (PTQ), which means the models were already trained when the weights were quantized. And I used the most basic PTQ settings at that. There are smarter approaches that protect accuracy far better, I just didn’t reach for them here, so the honest takeaway isn’t that four bits is hopeless, it’s that the naive path to four bits broke this particular model.
Naive INT4 PTQ managed to be smaller than INT8, slower than INT8, and less accurate than INT8, all at once. File size is the wrong thing to optimize for.
So what does this mean if you’re shipping an on-device model? INT8 PTQ is your practical default: the size reduction is significant, accuracy holds, and CPU delegation stays high. Naive INT4 PTQ was the one that broke here, at least on the handful of images I checked, so I’d verify accuracy on your own data before trusting it. Quantization-Aware Training exists for exactly this case, when the naive post-training path costs too much. But that’s a different experiment than the one I ran here. Whichever precision you choose, the delegate node count is the number that actually predicts runtime performance, not the file size.
메타데이터
- post_id
- 85e7f8f0a170
- slug
- smaller-slower-wrong-what-aggressive-quantization-costs-on-device-inference-85e7f8f0a170
- url
- https://medium.com/@merrickcr/smaller-slower-wrong-what-aggressive-quantization-costs-on-device-inference-85e7f8f0a170
- canonical_url
- https://medium.com/@merrickcr/smaller-slower-wrong-what-aggressive-quantization-costs-on-device-inference-85e7f8f0a170
- author_url
- https://medium.com/@merrickcr
- status
- ok
- fetched_at
- 2026-07-09 23:18:01




