AZURE ML: Deploy and monitor a model in Azure ML using managed online endpoints, blue/green…
Picture a Cardiff energy company running short-term load forecasts for the Welsh grid. Every five minutes, a model has to score about 2,400…
AZURE ML: Deploy and monitor a model in Azure ML using managed online endpoints, blue/green rollout, Application Insights, and the data collector for drift
Picture a Cardiff energy company running short-term load forecasts for the Welsh grid. Every five minutes, a model has to score about 2,400 substation readings and return a predicted demand band for the next hour. The traders pay penalties measured in tens of thousands of pounds if the forecast drifts more than 6%, so when the data science team retrains, they cannot just swap the model on a Friday afternoon and pray. They need blue/green rollout, real-time scoring telemetry, and a drift watcher that flags when the meter behaviour stops looking like what the model was trained on. That is what we are going to build, end to end, on Azure ML.
Tools used
- Azure CLI v2 (
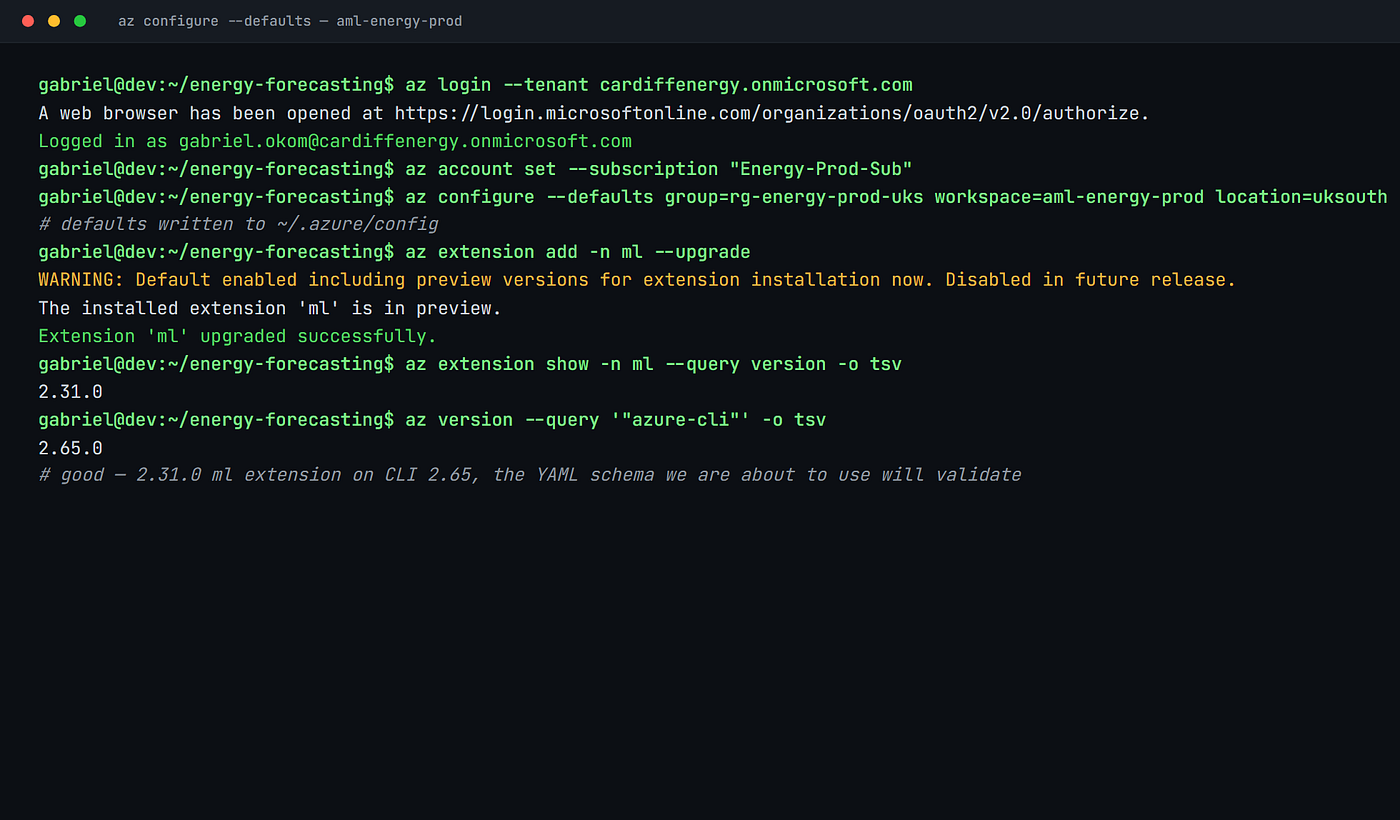
az) 2.66.0 - Azure ML CLI extension (
az ml) 2.31.0 - Python SDK v2 (
azure-ai-ml) 1.22.0 - mlflow 2.16.2
- azureml-mlflow 1.58.0
- azure-monitor-opentelemetry 1.6.4
- opentelemetry-instrumentation-fastapi 0.48b0
- Azure ML workspace
aml-grid-prodinuksouth - Resource group
rg-aml-grid-prod-uks - Application Insights
appi-grid-prod-uks - Storage account
stamlgridproduks(drift collector landing) - Compute SKU for inference:
Standard_DS3_v2(4 vCPU, 14 GiB), 1–6 nodes autoscale
Prerequisites
- Owner or Contributor on the resource group, plus
AzureML Data Scientiston the workspace - A registered MLflow model in the workspace (we will use
grid-demand-forecasterversion 7) - A scoring script and conda environment committed to a Git repo (we keep ours at
git@github.com:wales-grid/aml-scoring.git) - Application Insights resource already wired into the workspace (
az ml workspace update --application-insights ...if not) az login --tenant <your-tenant>complete, with the right subscription active- Local Python 3.11 with
azure-ai-ml==1.22.0,mlflow==2.16.2
Project architecture
The training pipeline lands its champion model into the workspace registry as an MLflow flavour, tagged with stage=staging. From there, a managed online endpoint hosts two named deployments, blue and green, behind a single HTTPS URL. The endpoint is private-link only, so trader desktops hit it via the internal API gateway at api.grid.internal, never the public internet. The scoring container pulls the model on cold start, then for each incoming request it logs a copy of the input row plus the prediction into a blob path under stamlgridproduks. A scheduled drift job reads those blobs once an hour, compares the live feature distribution against the training reference, and writes a Wasserstein distance metric back into Application Insights. When that metric crosses a threshold, an Azure Monitor alert triggers a retraining pipeline.
Nothing on the public internet talks directly to the endpoint, ever. Nothing in the scoring container talks back to the training data store. Predictions and inputs land in object storage only, and only the drift job reads them.
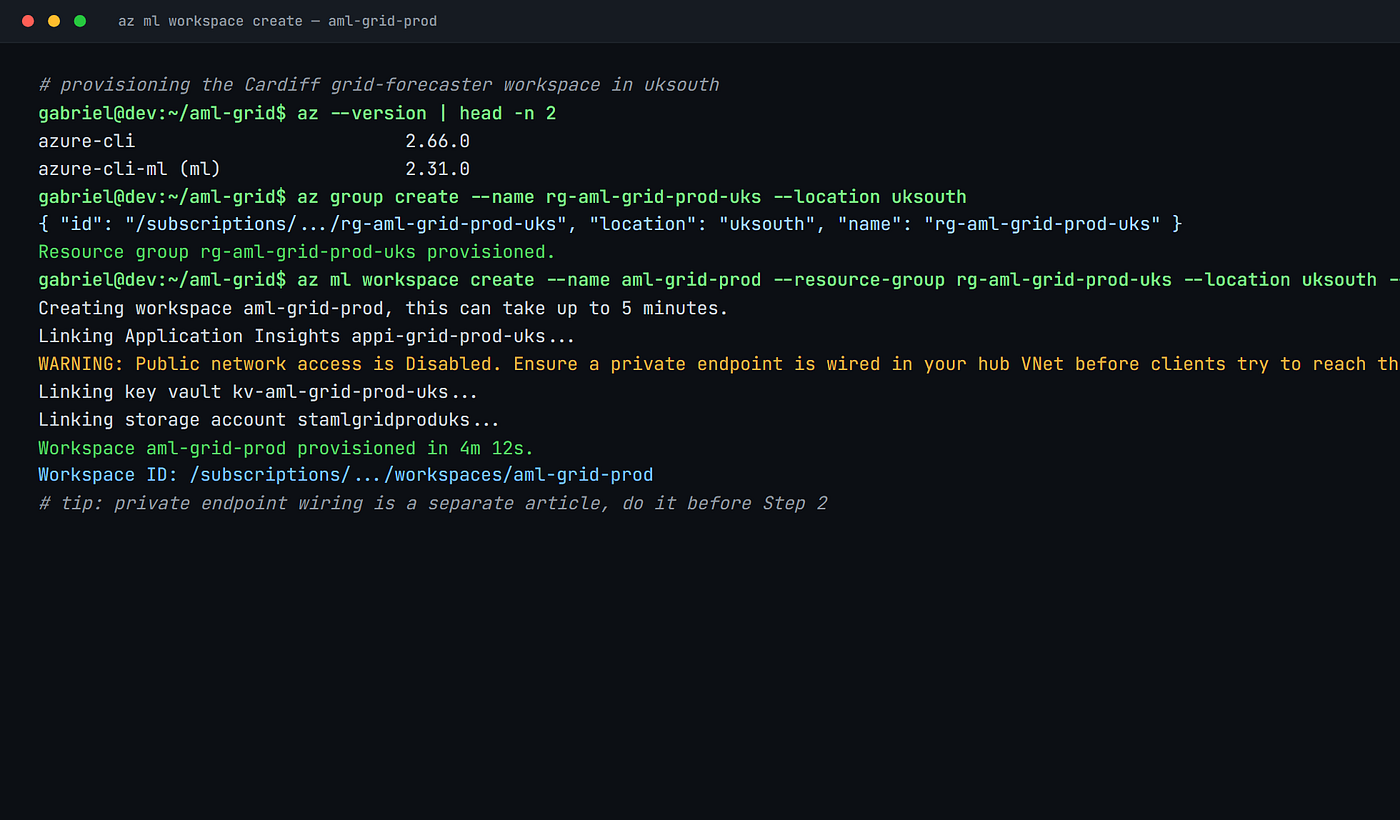
Step 1. Provision the resource group and workspace.
If you already have a workspace, skip this; otherwise the lot goes up in about four minutes.
az group create \
  --name rg-aml-grid-prod-uks \
  --location uksouth

az ml workspace create \
  --name aml-grid-prod \
  --resource-group rg-aml-grid-prod-uks \
  --location uksouth \
  --application-insights /subscriptions/$SUB/resourceGroups/rg-aml-grid-prod-uks/providers/Microsoft.Insights/components/appi-grid-prod-uks \
  --public-network-access Disabled
The --public-network-access Disabled flag is the one most teams forget. Without it the workspace is reachable over the open internet by default, and on a regulated workload like grid forecasting that is a no-go. We pair the workspace with a private endpoint in our existing hub VNet, but the wiring of that is a separate article.
Step 2. Define the managed online endpoint.
The endpoint itself is just a URL with auth. The deployments behind it are where the compute lives.
# endpoint.yml
$schema: https://azuremlschemas.azureedge.net/latest/managedOnlineEndpoint.schema.json
name: grid-demand-ep
auth_mode: aml_token
public_network_access: disabled
description: Welsh grid 5-minute demand forecaster, blue/green
tags:
  owner: data-platform
  cost-centre: cc-4471
  pii: none
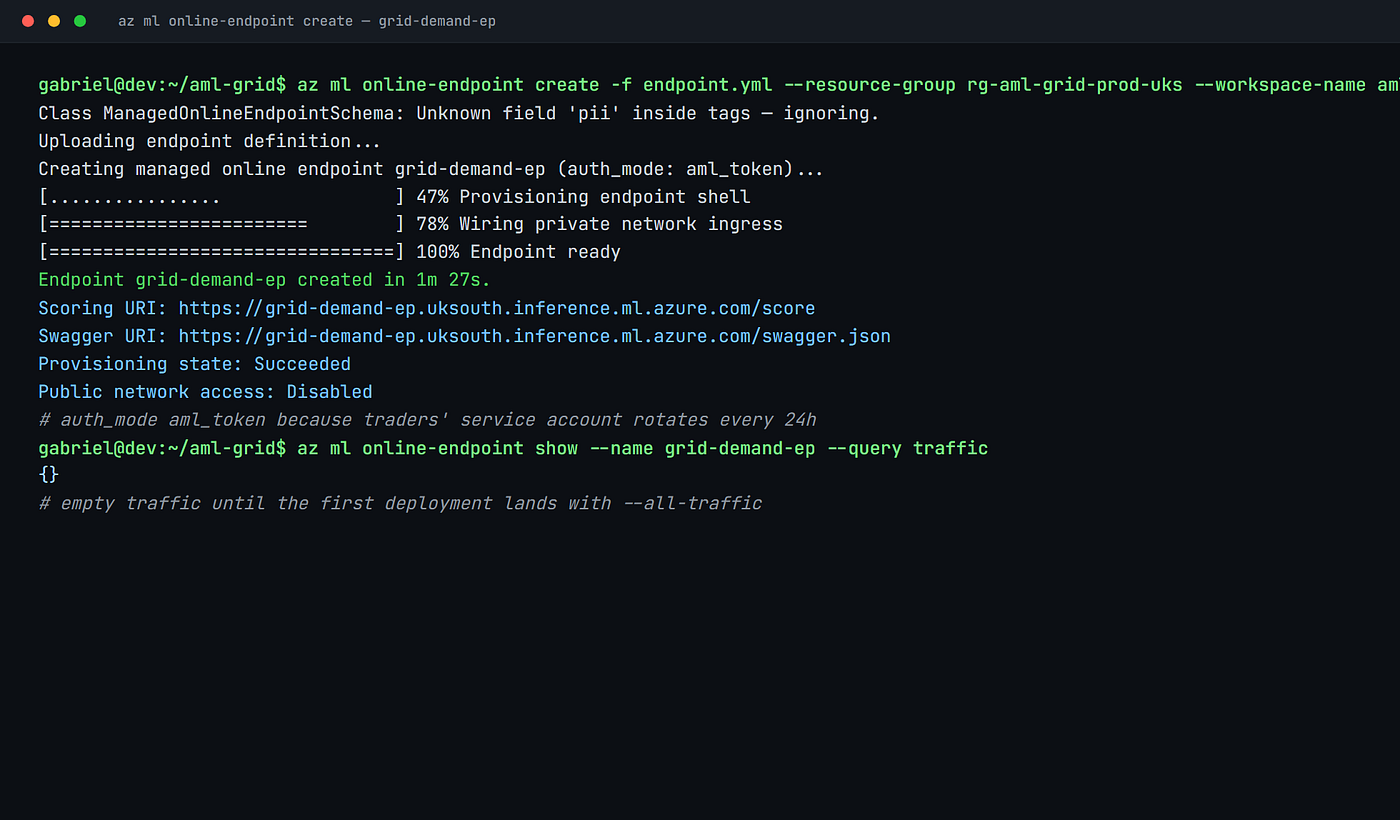
Create it:
az ml online-endpoint create \
  -f endpoint.yml \
  --resource-group rg-aml-grid-prod-uks \
  --workspace-name aml-grid-prod
aml_token over key because tokens expire, keys do not. If you wondering why we care, it is because the traders' service account rotates every 24 hours and our SOC will not approve a long-lived shared secret. Takes maybe 90 seconds for the endpoint shell to come up.
Step 3. Define the blue deployment with its scoring environment.
This is the one currently serving traffic. Model version 7, environment grid-scoring-env version 12, instance count 2 to start, autoscale rules added in a later step.
# blue-deployment.yml
$schema: https://azuremlschemas.azureedge.net/latest/managedOnlineDeployment.schema.json
name: blue
endpoint_name: grid-demand-ep
model: azureml:grid-demand-forecaster:7
code_configuration:
  code: ./src
  scoring_script: score.py
environment: azureml:grid-scoring-env:12
instance_type: Standard_DS3_v2
instance_count: 2
request_settings:
  request_timeout_ms: 4000
  max_concurrent_requests_per_instance: 8
  max_queue_wait_ms: 1000
liveness_probe:
  initial_delay: 10
  period: 10
  timeout: 5
  failure_threshold: 3
readiness_probe:
  initial_delay: 10
  period: 10
  timeout: 5
  failure_threshold: 3
data_collector:
  collections:
    model_inputs:
      enabled: 'true'
    model_outputs:
      enabled: 'true'
  rolling_rate: hour
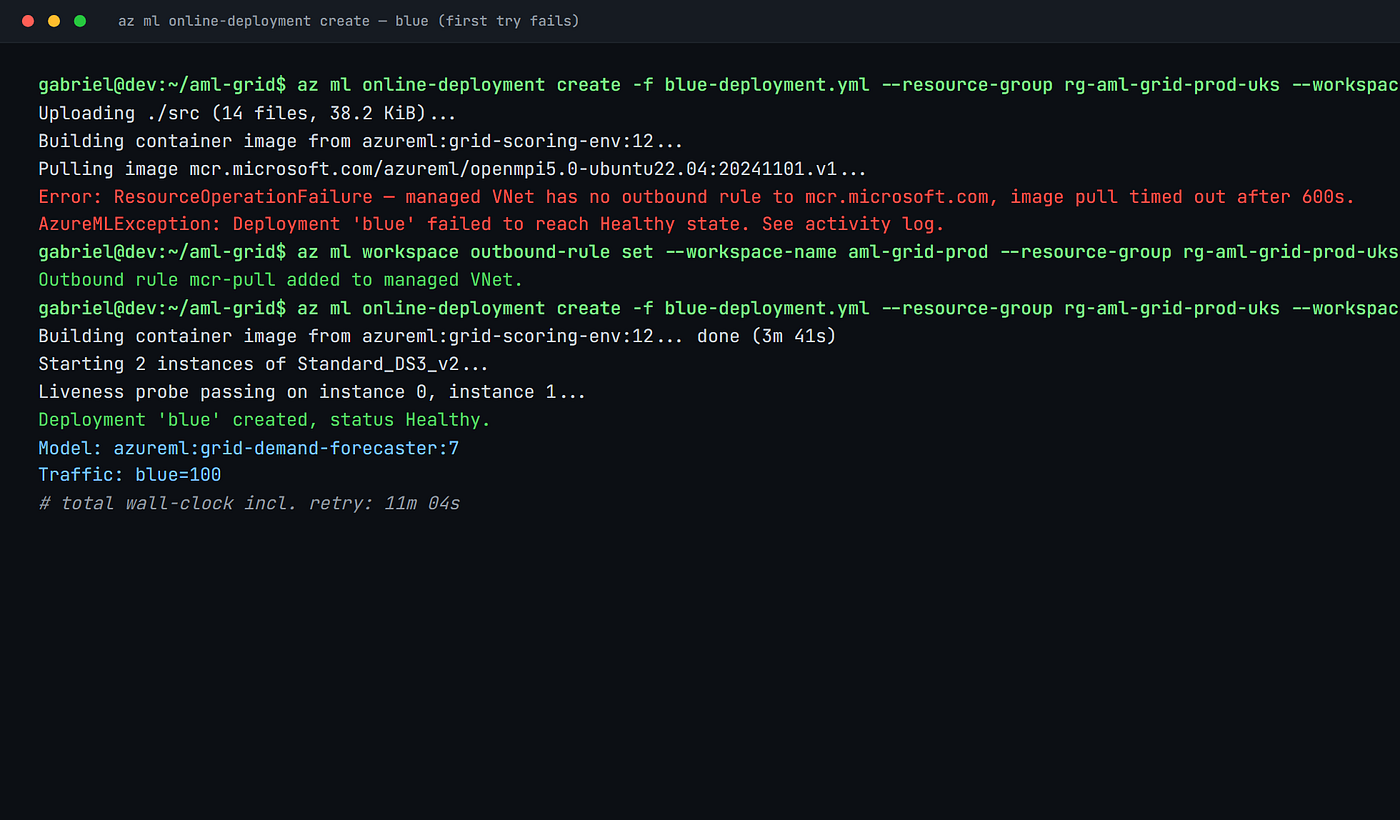
Push it:
az ml online-deployment create \
  -f blue-deployment.yml \
  --resource-group rg-aml-grid-prod-uks \
  --workspace-name aml-grid-prod \
  --all-traffic
The --all-traffic on this first deploy is a shortcut. It sets the endpoint traffic split to blue=100, which is what we want when there is no green yet. The data_collector block is the new bit on SDK v2. With enabled: 'true' on model_inputs and model_outputs, every request and response gets a JSONL row written to stamlgridproduks under azureml/<endpoint>/<deployment>/<collection>/<yyyy>/<mm>/<dd>/<hh>/. That is the substrate for the drift job in Step 7.
Step 4. The scoring script and inference environment.
The scoring container needs three things: the conda env, an score.py entry point, and the model itself which Azure ML mounts in for you. Here is the env yaml.
# environments/grid-scoring-env.yml
$schema: https://azuremlschemas.azureedge.net/latest/environment.schema.json
name: grid-scoring-env
version: 12
image: mcr.microsoft.com/azureml/openmpi5.0-ubuntu22.04:20241101.v1
conda_file: conda.yml
description: Inference env for grid demand forecaster
# environments/conda.yml
name: grid-scoring
channels:
- conda-forge
dependencies:
- python=3.11
- pip=24.2
- pip:
- mlflow==2.16.2
- azureml-mlflow==1.58.0
- azureml-inference-server-http==1.3.2
- scikit-learn==1.5.2
- pandas==2.2.3
- numpy==1.26.4
- azure-monitor-opentelemetry==1.6.4
- opentelemetry-instrumentation-fastapi==0.48b0# src/score.py
import json
import logging
import os
import mlflow
import pandas as pd
from azureml.ai.monitoring import Collector
from azure.monitor.opentelemetry import configure_azure_monitor
logger = logging.getLogger("grid-scorer")
logger.setLevel(logging.INFO)
inputs_collector = None
outputs_collector = None
model = None
def init():
global model, inputs_collector, outputs_collector
configure_azure_monitor(
connection_string=os.environ["APPLICATIONINSIGHTS_CONNECTION_STRING"]
)
model_dir = os.getenv("AZUREML_MODEL_DIR")
model = mlflow.pyfunc.load_model(model_dir + "/grid-demand-forecaster")
inputs_collector = Collector(name="model_inputs")
outputs_collector = Collector(name="model_outputs")
logger.info("init ok, model loaded")
def run(raw_data):
df = pd.DataFrame(json.loads(raw_data)["data"])
context = inputs_collector.collect(df)
preds = model.predict(df)
out_df = pd.DataFrame({"demand_mw": preds})
outputs_collector.collect(out_df, context)
return out_df.to_dict(orient="records")Register the env then it is ready for the deployment to pick up.
az ml environment create \
  -f environments/grid-scoring-env.yml \
  --resource-group rg-aml-grid-prod-uks \
  --workspace-name aml-grid-prod
The Collector calls inside run() are what bind a given input row to its prediction so the drift job can pair them later. If you skip the context = inputs_collector.collect(df) and just call outputs_collector.collect(out_df), the pairing breaks and your drift report becomes useless.
Step 5. Add the green deployment with the retrained model.
Two weeks later, the data science team retrain on a fresh six-month window and produce grid-demand-forecaster version 8. We deploy it side by side as green, no traffic yet.
# green-deployment.yml
$schema: https://azuremlschemas.azureedge.net/latest/managedOnlineDeployment.schema.json
name: green
endpoint_name: grid-demand-ep
model: azureml:grid-demand-forecaster:8
code_configuration:
  code: ./src
  scoring_script: score.py
environment: azureml:grid-scoring-env:12
instance_type: Standard_DS3_v2
instance_count: 2
data_collector:
  collections:
    model_inputs:
      enabled: 'true'
    model_outputs:
      enabled: 'true'
  rolling_rate: hour
az ml online-deployment create \
-f green-deployment.yml \
--resource-group rg-aml-grid-prod-uks \
--workspace-name aml-grid-prodNo --all-traffic flag. The endpoint still routes everything to blue. Now we shift traffic in stages.
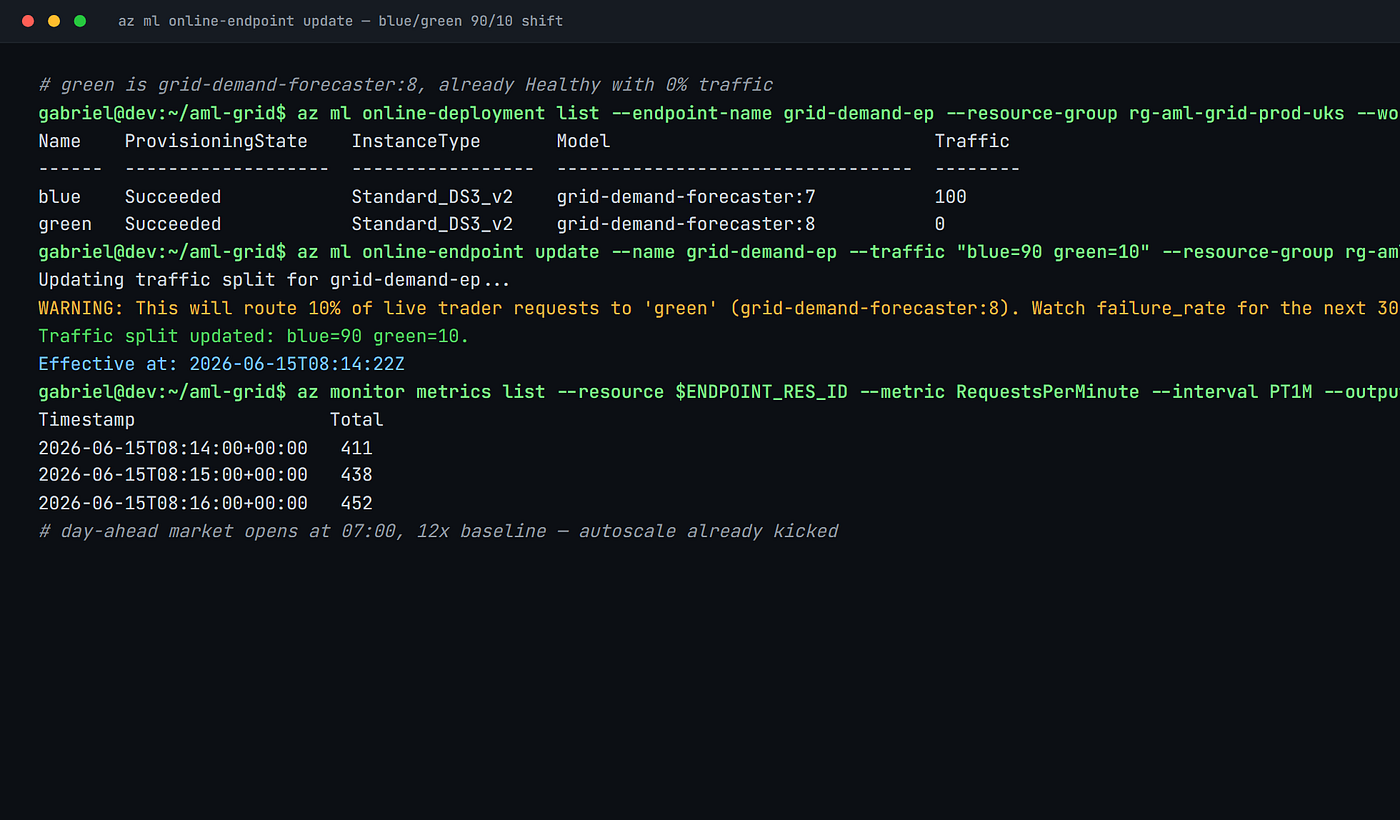
# 10% to green first
az ml online-endpoint update \
  --name grid-demand-ep \
  --traffic "blue=90 green=10" \
  --resource-group rg-aml-grid-prod-uks \
  --workspace-name aml-grid-prod
Watch the App Insights requests and exceptions tables for 30 minutes. If error rate on green stays inside the same envelope as blue, bump to 50/50. Then 0/100. If anything looks off, flip back to blue=100 in one command and the traders never notice.
Step 6: Wire autoscale and request settings.
Two instances is fine at night. At 07:00 when the day-ahead market opens, request rate spikes 12x. Without autoscale, latency goes from 80ms p95 to 4 seconds and request_timeout_ms kicks in.
ENDPOINT_RES_ID=$(az ml online-deployment show \
  --name blue \
  --endpoint-name grid-demand-ep \
  --resource-group rg-aml-grid-prod-uks \
  --workspace-name aml-grid-prod \
  --query id -o tsv)

az monitor autoscale create \
  --resource-group rg-aml-grid-prod-uks \
  --resource $ENDPOINT_RES_ID \
  --name autoscale-grid-blue \
  --min-count 1 \
  --max-count 6 \
  --count 2

az monitor autoscale rule create \
  --resource-group rg-aml-grid-prod-uks \
  --autoscale-name autoscale-grid-blue \
  --condition "CpuUtilizationPercentage > 70 avg 5m" \
  --scale out 1

az monitor autoscale rule create \
  --resource-group rg-aml-grid-prod-uks \
  --autoscale-name autoscale-grid-blue \
  --condition "CpuUtilizationPercentage < 30 avg 10m" \
  --scale in 1
Repeat the three commands for green with autoscale-grid-green once it is taking real traffic. We deliberately set min-count 1 not 0, because cold-starting an MLflow PyFunc container on Standard_DS3_v2 is around 45 seconds and the trading desk will not tolerate that on the first request of the morning.
Step 7. Application Insights queries that actually tell you something.
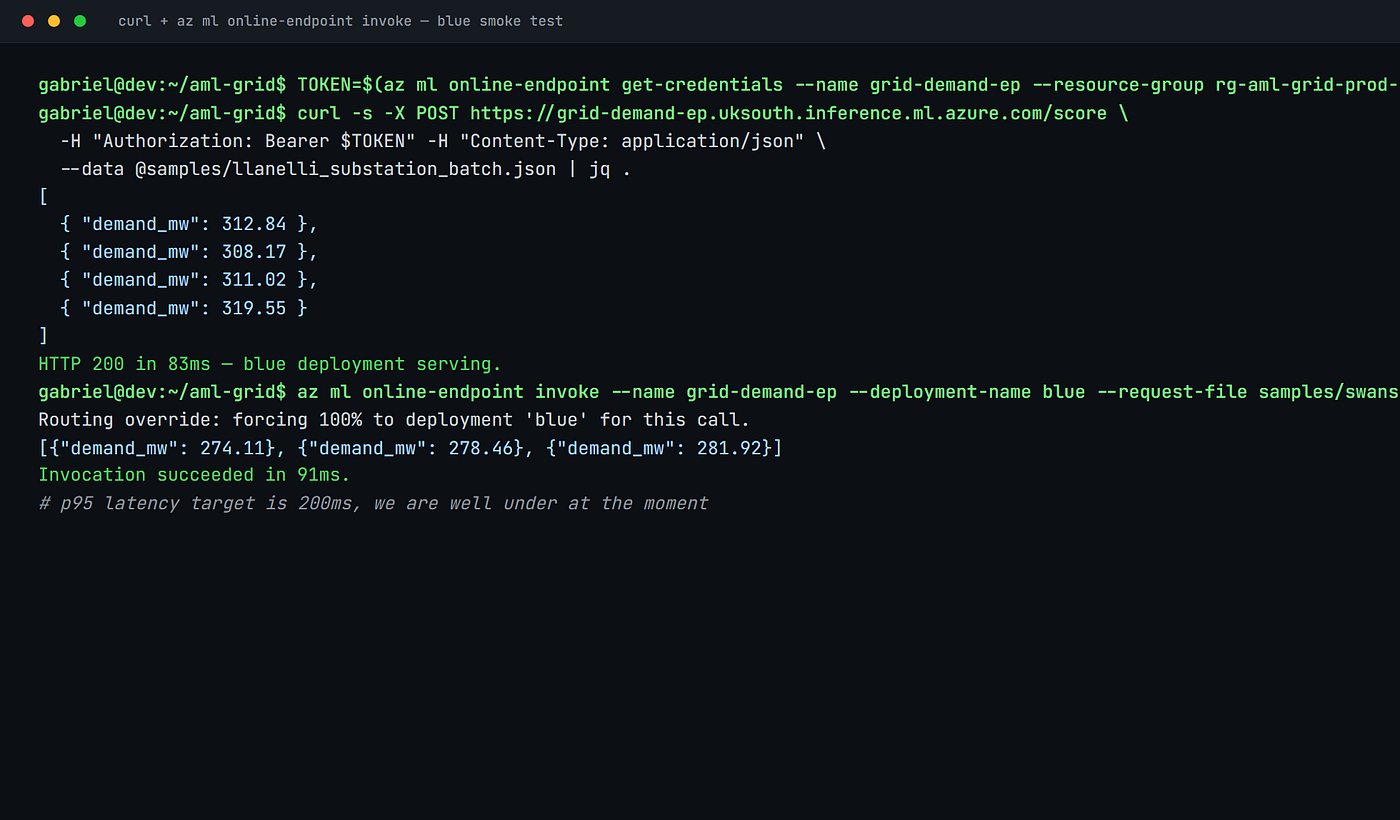
The OpenTelemetry instrumentation in score.py pumps every request into the App Insights workspace bound to the workspace. Live Metrics will show you req/sec and failure rate, but the queries that earn their keep are the latency-by-deployment and the predicted-vs-actual residual.
// p50 / p95 / p99 latency by deployment over last hour
requests
| where timestamp > ago(1h)
| where cloud_RoleName == "grid-demand-ep"
| extend deployment = tostring(customDimensions["azureml-model-deployment"])
| summarize
    p50=percentile(duration, 50),
    p95=percentile(duration, 95),
    p99=percentile(duration, 99),
    count_=count()
  by deployment, bin(timestamp, 5m)
| order by timestamp desc
// failure rate by deployment
requests
| where timestamp > ago(6h)
| where cloud_RoleName == "grid-demand-ep"
| extend deployment = tostring(customDimensions["azureml-model-deployment"])
| summarize
fails=countif(success == false),
total=count()
by deployment, bin(timestamp, 15m)
| extend failure_rate = todouble(fails) / total
| order by timestamp descPin both to a shared dashboard. During a blue/green shift, those two charts are what you stare at. We also have an alert that pages the on-call MLOps engineer if failure_rate > 0.02 for 10 minutes on either deployment, which has fired exactly twice in the last year (both real, both rolled back).
Step 8. Drift detection over the data collector blobs.
The data collector writes JSONL files. We point an Azure ML pipeline at them, run a population stability index plus Wasserstein distance against the training reference, and write the result back as an App Insights custom metric.
# pipelines/drift_job.py
from azure.ai.ml import MLClient, command, Input, Output
from azure.identity import DefaultAzureCredential

ml_client = MLClient(
    DefaultAzureCredential(),
    subscription_id="00000000-0000-0000-0000-000000000000",
    resource_group_name="rg-aml-grid-prod-uks",
    workspace_name="aml-grid-prod",
)

drift_step = command(
    name="grid-drift-hourly",
    display_name="Grid demand drift check",
    code="./src",
    command=(
        "python drift.py "
        "--collected_inputs ${{inputs.collected_inputs}} "
        "--reference ${{inputs.reference}} "
        "--appi_conn ${{inputs.appi_conn}}"
    ),
    environment="azureml:grid-drift-env:4",
    inputs={
        "collected_inputs": Input(
            type="uri_folder",
            path="azureml://datastores/workspaceblobstore/paths/azureml/grid-demand-ep/blue/model_inputs/",
        ),
        "reference": Input(
            type="uri_file",
            path="azureml:grid-train-reference:3",
        ),
        "appi_conn": "InstrumentationKey=...;IngestionEndpoint=...",
    },
    compute="cpu-cluster-small",
)

ml_client.jobs.create_or_update(drift_step)
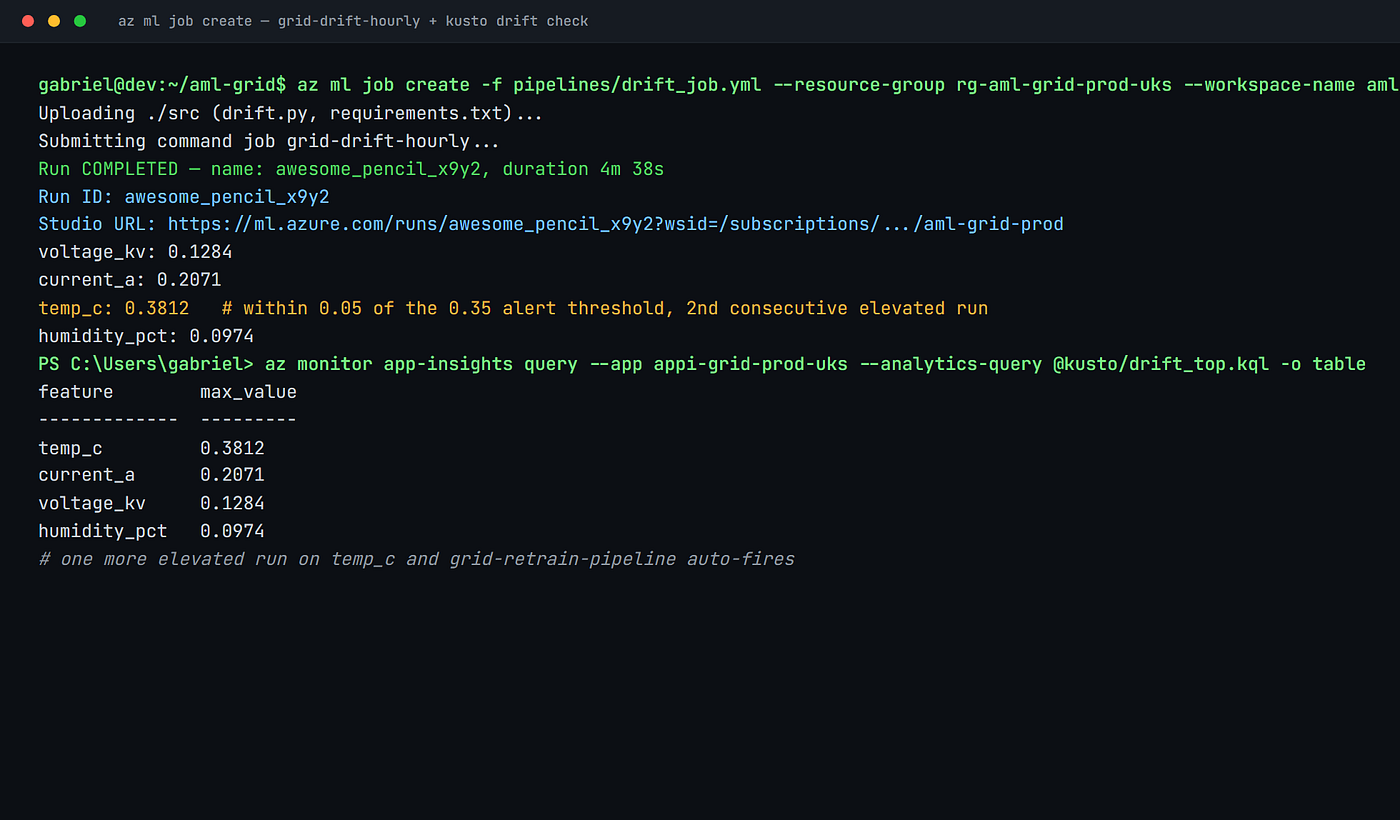
Inside drift.py we compute the Wasserstein distance per numeric feature, then emit a custom metric.
# src/drift.py
import json, glob, argparse, pandas as pd
from scipy.stats import wasserstein_distance
from azure.monitor.opentelemetry import configure_azure_monitor
from opentelemetry import metrics

ap = argparse.ArgumentParser()
ap.add_argument("--collected_inputs")
ap.add_argument("--reference")
ap.add_argument("--appi_conn")
args = ap.parse_args()

configure_azure_monitor(connection_string=args.appi_conn)
meter = metrics.get_meter("grid.drift")
drift_gauge = meter.create_gauge("grid_feature_drift_wasserstein")

ref = pd.read_parquet(args.reference)
rows = []
for f in glob.glob(args.collected_inputs + "/**/*.jsonl", recursive=True):
    with open(f) as fh:
        for line in fh:
            rows.append(json.loads(line)["input"])
live = pd.DataFrame(rows)

for col in ["voltage_kv", "current_a", "temp_c", "humidity_pct"]:
    d = wasserstein_distance(ref[col], live[col])
    drift_gauge.set(d, {"feature": col})
    print(f"{col}: {d:.4f}")
Schedule the pipeline hourly with JobSchedule. When grid_feature_drift_wasserstein for any feature exceeds 0.35 for three consecutive runs, an alert fires and kicks off the retraining pipeline grid-retrain-pipeline via webhook. That closes the loop. New training run produces version 9, lands in the registry tagged stage=staging, the MLOps engineer reviews, deploys to green, shifts traffic. Same dance, different week.
Step 9. Roll forward the traffic.
Once green has held for 24 hours at 10%, then 50%, with failure rate inside the envelope and drift metrics stable, you commit.
az ml online-endpoint update \
  --name grid-demand-ep \
  --traffic "blue=0 green=100" \
  --resource-group rg-aml-grid-prod-uks \
  --workspace-name aml-grid-prod

# wait 48h, then delete blue to free the compute
az ml online-deployment delete \
  --name blue \
  --endpoint-name grid-demand-ep \
  --resource-group rg-aml-grid-prod-uks \
  --workspace-name aml-grid-prod \
  --yes
The 48-hour wait is a safety margin. If something only shows up under the Tuesday morning peak you want blue still sitting there so you can flip back. After that, delete it; the compute charges accrue whether traffic is on it or not.
Troubleshooting
i> Endpoint creation hangs on "Creating". The workspace has public_network_access disabled and the managed VNet for the endpoint is missing an outbound rule to mcr.microsoft.com. Add it via az ml workspace outbound-rule set and recreate the endpoint, otherwise the scoring image pull never completes.
ii> Data collector blobs never appear. The scoring identity does not have Storage Blob Data Contributor on stamlgridproduks. Run az role assignment create --assignee $(az ml online-deployment show --name blue --endpoint-name grid-demand-ep --query identity.principal_id -o tsv) --role "Storage Blob Data Contributor" --scope $(az storage account show --name stamlgridproduks --query id -o tsv) and the JSONL rows start landing within five minutes.
iii> Blue/green traffic shift returns "deployment is not ready". You set --all-traffic on the second deployment by mistake, which conflicts with the explicit split. Run az ml online-endpoint update --traffic "blue=90 green=10" to reassert intent. Always omit --all-traffic on the green deploy, set traffic via online-endpoint update.
iv> App Insights shows requests but no azureml-model-deployment custom dimension. The OpenTelemetry instrumentation initialised before init() set the deployment env var. Move the configure_azure_monitor call to the top of init() not module-level, and the dimension flows through on the next container restart.
Cost of running this
Rough UK South GBP, two-deployment blue/green steady state:
- Managed online endpoint compute, 2 instances of
Standard_DS3_v2per deployment, 4 instances total at idle, ~£430 per month - Autoscale headroom (assume average 5 instances during business hours), add ~£140
- Application Insights ingestion at roughly 2.4 GB per day, ~£170 per month
- Storage for data collector JSONL, ~80 GB per month, ~£2
- Drift job on
cpu-cluster-small(Standard_DS2_v2, one node, 30 minutes per hour), ~£55 per month - Azure ML workspace itself, no charge beyond the resources above
Total roughly £790 to £900 a month for production, lower if you tune autoscale tighter or drop the drift job to every two hours.
Clean up
When you are done playing:
az group delete \
  --name rg-aml-grid-prod-uks \
  --yes \
  --no-wait
Takes about eight minutes to fully tear down. The --no-wait is so you can close the terminal and go for lunch.
Closing
So that is the full picture. A managed online endpoint with two deployments, a sensible traffic shift, autoscale that actually matches the trading day, App Insights queries that tell you the truth about latency and failure, a data collector capturing every input and output, and a drift job that closes the loop back into retraining. The grid forecaster does not get swapped on a Friday afternoon and a prayer; it gets swapped on a Tuesday morning at 10% traffic with three engineers watching dashboards, and if anything looks wrong it flips back in one command. Take this, swap in your own model name, your own features, your own drift threshold, and you have something a UK energy Fortune 500 actually runs in production. The bones are the same.
azure #azureml #endpoints #bluegreen #drift #applicationinsights #seniormlopsengineer
메타데이터
- post_id
- 85fd2cbdfd2d
- slug
- azure-ml-deploy-and-monitor-a-model-in-azure-ml-using-managed-online-endpoints-blue-green-85fd2cbdfd2d
- url
- https://medium.com/@ougabriel/azure-ml-deploy-and-monitor-a-model-in-azure-ml-using-managed-online-endpoints-blue-green-85fd2cbdfd2d
- canonical_url
- https://medium.com/@ougabriel/azure-ml-deploy-and-monitor-a-model-in-azure-ml-using-managed-online-endpoints-blue-green-85fd2cbdfd2d
- author_url
- https://medium.com/@ougabriel
- status
- ok
- fetched_at
- 2026-06-29 22:44:20