Modern Observability Stack for AI Infrastructure: OpenTelemetry, Pixie, and Phlare
Explore how OpenTelemetry, Pixie, and Grafana Phlare unify metrics, traces, and profiling to build a resilient, real-time observability…
Bringing Clarity to Complexity:
The Next-Gen Observability Trio Reshaping AI Infrastructure
Modern Observability Stack for AI Infrastructure: OpenTelemetry, Pixie, and Phlare
Explore how OpenTelemetry, Pixie, and Grafana Phlare unify metrics, traces, and profiling to build a resilient, real-time observability stack for AI-driven Kubernetes environments.

Modern AI workloads demand a robust, transparent, and scalable infrastructure. As applications evolve into distributed microservices across hybrid clouds, debugging and performance optimization have become increasingly difficult. Traditional monitoring tools no longer suffice — what we need is full-stack observability with real-time, low-latency feedback.
Enter the trio: OpenTelemetry, Pixie, and Grafana Phlare. Together, they form the foundation of a modern observability stack tailored for AI infrastructure. This blog takes you deep into their architecture, how they work in Kubernetes, and how to combine them for best results.
Understanding the Pillars of Observability
In AI infrastructure, observability isn’t just about system health — it’s about:
- Real-time telemetry: GPU metrics, model execution time, pod latency
- Service-level insights: Traces and spans across ML inference pipelines
- Resource profiling: CPU throttling, GPU utilization, memory leaks
The traditional three pillars of observability are:
- Metrics (e.g., memory, GPU %)
- Traces (e.g., where latency is introduced)
- Logs (e.g., error messages)
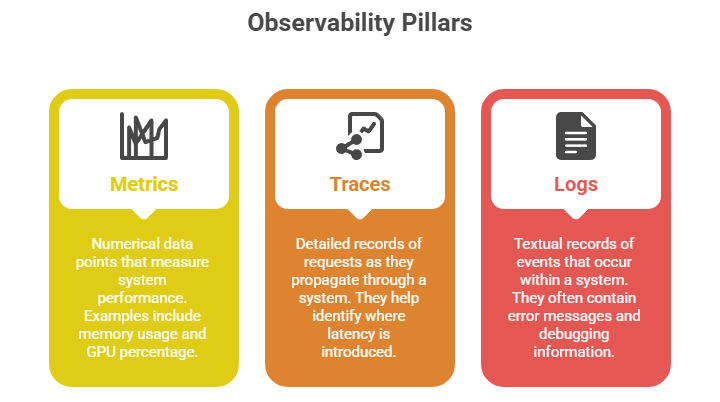
To take this further for AI workloads, we add a fourth: profiling — which is where Grafana Phlare shines.
OpenTelemetry: The Foundation of Distributed Tracing
OpenTelemetry is a CNCF project that standardizes the collection of metrics, traces, and logs. It’s language-agnostic and integrates with frameworks like PyTorch, TensorFlow, and serving engines like TorchServe and NVIDIA Triton.
How It Works:
- Developers instrument code using SDKs in Python, Go, Java, etc.
- The OpenTelemetry Collector processes and exports the data
- Data is sent to a backend like Jaeger, Tempo, or Datadog
AI Workload Example:
A PyTorch model deployed on Kubernetes emits trace context using OpenTelemetry SDK. The trace spans track from API gateway → model pre-processing → inference → post-processing. This helps identify which step adds most latency.
Pixie: Real-Time Telemetry with Zero Code Instrumentation
Pixie is a Kubernetes-native observability tool that uses eBPF to gather system-level metrics, traces, and logs directly from the kernel — without needing to modify application code.
Key Features:
- Real-time metrics without delay
- Code-less debugging using px CLI
- Visualization via Pixie UI or export to OpenTelemetry
How It Works:
- Pixie installs a data collector agent (vizier) on each node.
- It captures syscall-level data using eBPF.
- Pre-built scripts or custom scripts let you extract insights (e.g., top memory users, pod errors).
In AI:
Want to track how long your inference containers spend on GPU compute vs. network I/O? Pixie makes this effortless by directly tapping into the system kernel.
Grafana Phlare: Continuous Profiling Made Easy
While metrics and traces tell you “what” and “where”, Phlare answers the “why” — profiling reveals root causes behind performance degradation.
Technical Overview:
- Captures CPU, memory, and thread usage over time
- Integrated with Grafana dashboards
- Stores profiling data in a time-series manner (like Prometheus)
In AI Environments:
Profiling a TensorFlow Serving node with Phlare helps discover if the CPU thread pool is getting saturated during model warm-up — something that’s not visible in metrics alone.
Building the Stack Together
Here’s how the modern AI observability stack fits:
- OpenTelemetry — Distributed tracing & metrics
- Pixie — Real-time, code-less visibility
- Phlare — Continuous performance profiling
Architecture Flow:
- OpenTelemetry SDKs emit traces from AI services.
- Pixie auto-instruments system calls and container events.
- Phlare runs sidecars or agents to gather profiling data.
- All three output to Grafana for unified visualization.
Practical Use Cases
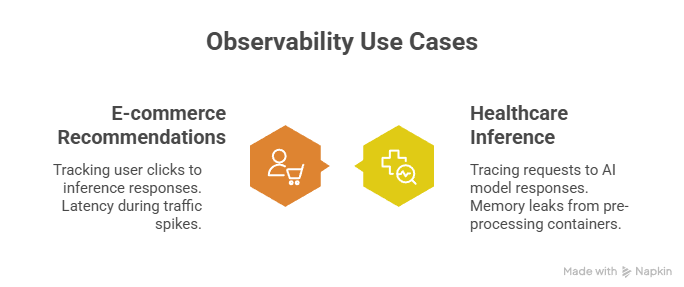
Healthcare Inference Pipelines
- Trace EMR system requests to AI model response using OpenTelemetry
- Pixie shows memory leaks from pre-processing containers
- Phlare reveals CPU-bound bottlenecks during concurrent requests
E-commerce Product Recommendations
- OpenTelemetry tracks user click → inference → response
- Pixie shows increased latency during traffic spikes
- Phlare identifies GC pauses as root cause
Why This Trio Wins for AI Observability
- Low Overhead: Especially Pixie with eBPF
- Language Agnostic: Works across Python, Go, Java
- Cloud-Native Ready: K8s-first architecture
- Extensible: Integrates with Tempo, Jaeger, Grafana, etc.
Together, they bridge the black box gap in modern AI and MLOps pipelines.
Conclusion
AI infrastructure isn’t just about deploying models — it’s about maintaining performance at scale. When latency increases, when inference throughput drops, or when memory bottlenecks creep in, observability becomes your superpower.
By combining OpenTelemetry, Pixie, and Grafana Phlare, AI engineers, DevOps teams, and MLOps professionals gain deep, actionable insights in real time — turning guesswork into data-driven tuning.
Whether you’re deploying edge AI, GPU-powered clusters, or cloud-native MLOps pipelines — this trio forms the essential backbone of your observability journey.
If you’re looking to scale your virtual environments with GPU acceleration, check out **StackGPU — a leading platform offering GPU-powered virtual machines ideal for AI training, 3D rendering, scientific simulations, and virtual desktop infrastructure (VDI)**.
메타데이터
- post_id
- 860c6f7774f4
- slug
- modern-observability-stack-for-ai-infrastructure-opentelemetry-pixie-and-phlare-860c6f7774f4
- url
- https://medium.com/@StackGpu/modern-observability-stack-for-ai-infrastructure-opentelemetry-pixie-and-phlare-860c6f7774f4
- canonical_url
- https://medium.com/@StackGpu/modern-observability-stack-for-ai-infrastructure-opentelemetry-pixie-and-phlare-860c6f7774f4
- author_url
- https://medium.com/@StackGpu
- status
- ok
- fetched_at
- 2026-07-18 13:46:51