Deploying Jaeger, Prometheus and Grafana with Docker Compose
In this article, we will explain how to deploy a monitoring and distributed tracing solution using Jaeger, Prometheus and Grafana. We will…
Deploying Jaeger, Prometheus and Grafana with Docker Compose
In this article, we will explain how to deploy a monitoring and distributed tracing solution using **Jaeger, [Prometheus ](https://prometheus.io/)**and **Grafana. We will use Docker Compose** to manage the infrastructure in a simple and reproducible way.
Introduction
The stack we will deploy consists of the following components:
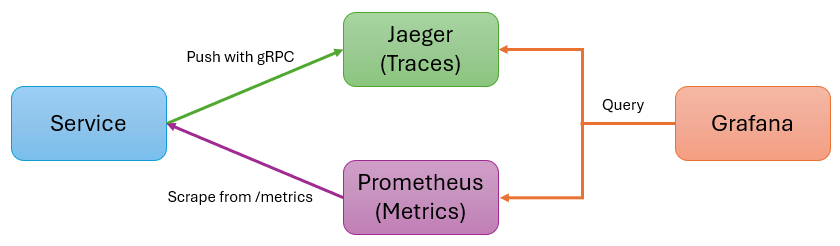
Monitoring Architecture with Jaeger, Prometheus and Grafana.
- **Jaeger**: Jaeger is an open-source distributed tracing system used for monitoring and troubleshooting complex micro-services architectures. It traces requests as they flow through multiple services, visualizing dependencies and identifying performance bottlenecks or errors. This allows developers to optimize performance, quickly detect problems, and gain detailed insights into their distributed systems.
- **Prometheus**: Prometheus is an open-source monitoring and alerting toolkit. It collects time-series metrics from applications and systems, storing them in a time-series database. Thanks to its powerful query language, Prometheus enables comprehensive analysis of these metrics. Teams use Prometheus to monitor the health and performance of their applications, configure threshold-based alerts, and visualize data using dashboards. It is an essential tool for observability in micro-services and distributed systems environments.
- **Grafana**: Grafana is an open-source visualization platform that allows you to create interactive and customizable dashboards for monitoring and analyzing data from various sources. It integrates seamlessly with time-series databases like Prometheus, as well as other monitoring systems. Grafana makes it easy to create clear and concise visualizations of metrics, logs, and traces, helping teams better understand the performance of their applications and systems.
Repository and Source Code
You can find the full source code and configuration files in the GitHub repository. Feel free to clone, contribute, or open issues if you have any questions!
Docker Compose Explained
- Jaeger
jaeger:
    networks:
      backend:
        aliases: [ spm_metrics_source ]
    image: jaegertracing/jaeger:${JAEGER_VERSION:-latest}
    restart: always
    environment:
      - OTEL_ENABLED=true
    volumes:
      - "./jaeger-ui.json:/etc/jaeger/jaeger-ui.json"
      - "./config.yml:/etc/jaeger/config.yml"
    command: ["--config", "/etc/jaeger/config.yml"]
    ports:
      - "0.0.0.0:16686:16686"
      - "0.0.0.0:8888:8888"
      - "0.0.0.0:8889:8889"
      - "0.0.0.0:4317:4317" # OTLP gRPC
      - "0.0.0.0:4318:4318" # OTLP HTTP
To configure Jaeger, it is essential to set OTEL_ENABLED=true to enable receiving traces from OpenTelemetry-instrumented applications. Ports 4317 (gRPC) and 4318 (HTTP) must be exposed to receive trace data, while port 16686 provides access to the Jaeger web interface to view collected traces.
2. Prometheus
  prometheus:
    networks:
      - backend
    image: prom/prometheus:v3.1.0
    restart: always
    volumes:
      - "./prometheus.yml:/etc/prometheus/prometheus.yml"
    ports:
      - "9090:9090"
Defining the configuration via a volume allows Prometheus customization without rebuilding the image. A simple Docker restart loads the updated configuration, including scrape settings and alerting rules. Exposing port 9090 provides access to Prometheus web interface at http://<host_ip>:9090, allowing users to query metrics, view graphs, and manage Prometheus.
3. Grafana
  grafana:
    image: grafana/grafana:latest
    restart: always
    networks:
      - backend
    ports:
      - "3000:3000"
    environment:
      - GF_SECURITY_ADMIN_PASSWORD=admin
    depends_on:
      - prometheus
Exposing port 3000 provides access to Grafana web interface at http://<host_ip>:3000. The GF_SECURITY_ADMIN_PASSWORD environment variable sets the initial admin password. In production environments, this should be replaced with a strong, secure password.
Configuration Files
- prometheus.yml
global:
  scrape_interval: 60s
  evaluation_interval: 60s

scrape_configs:
  - job_name: 'spm-metrics'
    metrics_path: '/metrics'
    static_configs:
      - targets: ['spm_metrics_source:8889']
The global section in Prometheus sets configuration options, with scrape_interval: 60s and evaluation_interval: 60s defining how often Prometheus scrapes metrics and evaluates alerting rules. The scrape_configs section specifies where Prometheus retrieves metrics and the job_name 'spm-metrics' identifies this job. Metrics are collected from /metrics, which means Prometheus will query http://<target_address>/metrics. The targets field (spm_metrics_source:8889) points to the service providing metrics, which, due to Docker Compose alias, resolves to the Jaeger container.
2. config.yml
service:
  extensions: [jaeger_storage, jaeger_query]
  pipelines:
    traces:
      receivers: [otlp]
      processors: [batch]
      exporters: [jaeger_storage_exporter, spanmetrics]
    metrics/spanmetrics:
      receivers: [spanmetrics]
      exporters: [prometheus]
  telemetry:
    resource:
      service.name: jaeger
    metrics:
      level: detailed
      readers:
        - pull:
            exporter:
              prometheus:
                host: 0.0.0.0
                port: 8888
    logs:
      level: DEBUG

extensions:
  jaeger_query:
    storage:
      traces: some_storage
      metrics: some_metrics_storage
  jaeger_storage:
    backends:
      some_storage:
        memory:
          max_traces: 100000
    metric_backends:
      some_metrics_storage:
        prometheus:
          endpoint: http://prometheus:9090
          normalize_calls: true
          normalize_duration: true

connectors:
  spanmetrics:

receivers:
  otlp:
    protocols:
      grpc:
        endpoint: "0.0.0.0:4317"
      http:
        endpoint: "0.0.0.0:4318"

processors:
  batch:

exporters:
  jaeger_storage_exporter:
    trace_storage: some_storage
  prometheus:
    endpoint: "0.0.0.0:8889"
This OpenTelemetry Collector configuration enables the reception, processing, and export of traces and metrics using Jaeger and Prometheus. Traces are received from OpenTelemetry-instrumented applications via the OTLP protocol, listening on ports 4317 (gRPC) and 4318 (HTTP). These traces are processed in batches for efficiency and then exported to Jaeger using jaeger_storage_exporter, while metrics derived from the traces are sent to Prometheus using the spanmetrics connector. For storage management, the jaeger_storage extension configures an in-memory backend capable of storing up to 100,000 traces, while jaeger_query enables querying of stored traces and metrics. For metrics reception, the spanmetrics connector converts traces into metrics for Prometheus to collect, with the collector’s own metrics exposed on port 8888. The batch processor aggregates and processes the data before exporting it, thereby optimizing system performance. The telemetry configuration defines a "detailed" level better observability, while DEBUG-level logs facilitate troubleshooting. In short, this configuration provides a robust solution for capturing traces, storing them in Jaeger, converting them into metrics, and monitoring them in Prometheus, ensuring comprehensive observability in distributed environments.
Deployment with Docker Compose
To start the containers, run:
sudo docker-compose up -dVerifying Services
- Jaeger UI: http://localhost:16686
- Prometheus: http://localhost:9090
- Grafana: http://localhost:3000 (User:
admin, Password:admin)
Creating Dashboards in Grafana
Once the stack is running, you can create custom dashboards in Grafana that integrate data from Prometheus and Jaeger. Simply add Prometheus as a data source to visualize metrics and Jaeger to analyze traces, enabling a complete monitoring and observability setup.
Conclusion
In this article, we successfully deployed a full observability stack using Jaeger, Prometheus and Grafana with Docker Compose. This setup provides a powerful and scalable solution for distributed tracing, monitoring, and data visualization.
This deployment allows teams to gain detailed insights into their applications, detect issues early, and optimize performance with minimal setup effort. Whether managing micro-services, troubleshooting latency issues, or ensuring system reliability, this observability stack is a solid foundation for improving visibility into your infrastructure.
References
[2] Examples of Jaeger configuration files.
[3] https://prometheus.io/docs/prometheus/latest/getting_started/
[4] https://grafana.com/grafana/download?pg=oss-graf&plcmt=resources&platform=docker
메타데이터
- post_id
- 87d3bd499bbe
- slug
- deploying-jaeger-prometheus-and-grafana-with-docker-compose-87d3bd499bbe
- url
- https://medium.com/@juanluis1702/deploying-jaeger-prometheus-and-grafana-with-docker-compose-87d3bd499bbe
- canonical_url
- https://medium.com/@juanluis1702/deploying-jaeger-prometheus-and-grafana-with-docker-compose-87d3bd499bbe
- author_url
- https://medium.com/@juanluis1702
- status
- ok
- fetched_at
- 2026-07-31 06:21:22



