Why Strong Trends End Without Warning
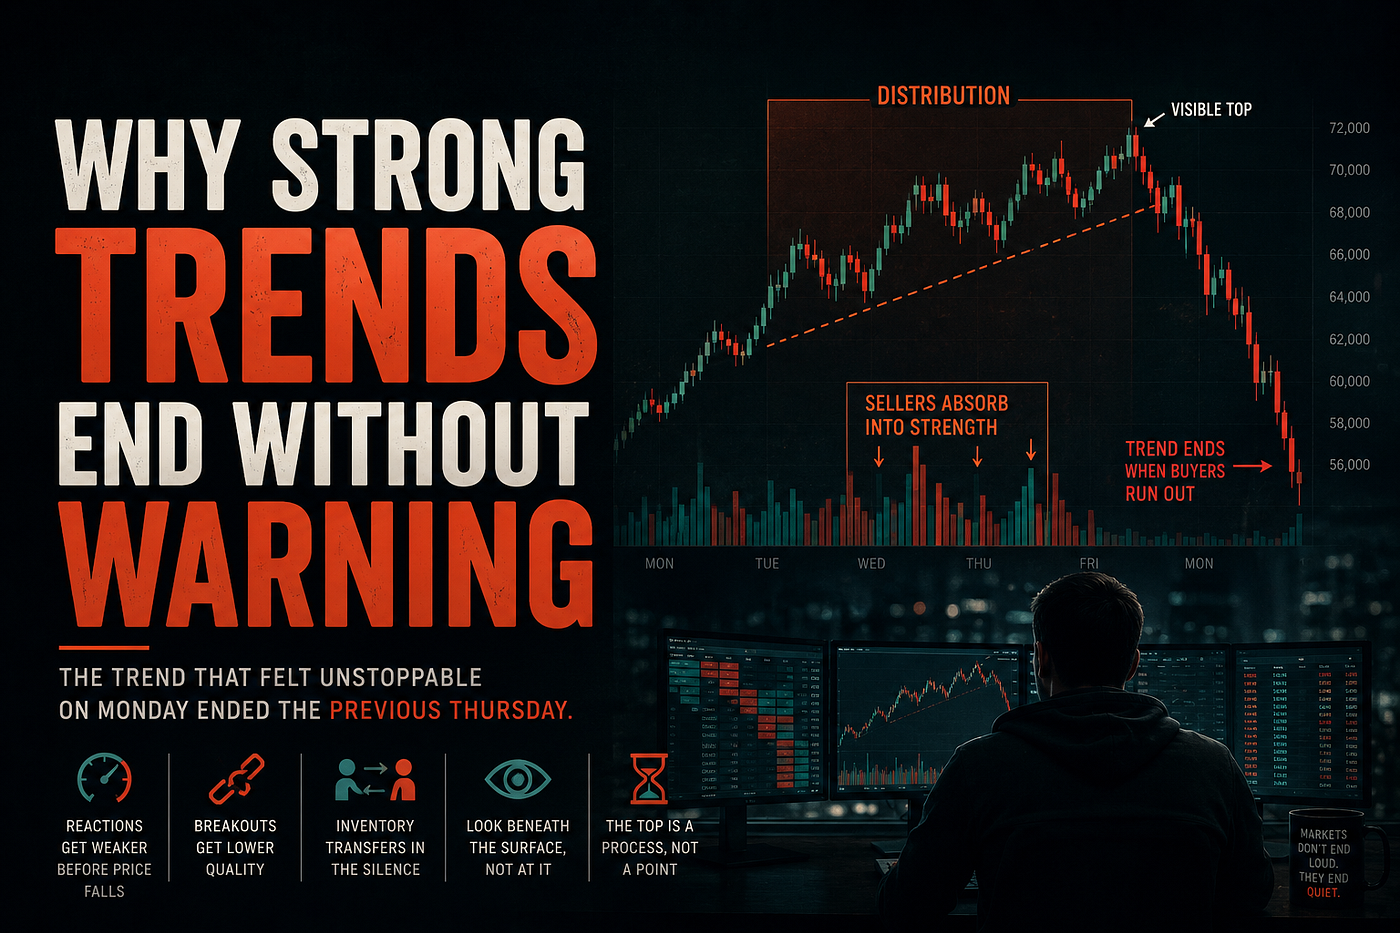
The trend that felt unstoppable on Monday usually ended quietly the previous Thursday.
Why Strong Trends End Without Warning
The trend that felt unstoppable on Monday usually ended quietly the previous Thursday.
That’s not a paradox. It’s how distribution works. The price keeps printing higher highs because the last buyers are still arriving, but the structure underneath has already changed hands. The tape looks strong. The structure has already turned.
By the time the visible top forms, the inventory has already moved from the people who bought it early to the people who will hold it through the decline.
The Top Is a Process, Not a Point
Most traders treat the top of a trend as an event. A specific candle, a specific level, a specific moment where momentum reverses. That’s how it looks on a finished chart, where you can scroll back and point to the bar that printed the high.
In real-time, the top is a process that takes days or weeks. It begins long before the highest price prints and ends long after. The visible top is just the last point on a distribution that started much earlier.
This is why traders who try to identify the top by waiting for the highest candle always arrive late. The candle they’re waiting for is the end of the process, not the beginning. The information they need was already in the tape during the previous week’s quieter sessions.
Reactions Get Weaker Before Price Falls
The first signal that a trend is ending isn’t a drop. It’s a change in how price reacts to support during pullbacks.
In a healthy trend, each pullback finds buyers quickly. Price dips, demand absorbs the dip, and the trend resumes within a session or two. The reaction is sharp, the recovery is clean, and the structure feels coiled.
When distribution begins, these reactions weaken. The pullback still finds support, but the bounce takes longer. The recovery is shallower. The next push to a new high happens, but it required more time and more effort than the previous one. Nothing on the chart looks wrong yet. The trend is still making higher highs. But the engine is no longer running at the same RPM.
A trader watching only price will see continuation. A trader watching the quality of reactions will notice the engine losing power.
The Breakouts Get Lower Quality
Strong trends produce breakouts that hold. A level breaks, price extends, and the new range establishes above the old one. Pullbacks respect the broken level as new support.
Late-stage trends produce breakouts that look the same on the surface but behave differently underneath. The level breaks. Price extends — sometimes dramatically. But the follow-through is shorter, the pullback that follows is deeper, and the broken level no longer holds as support on the retest.
This is what the silence before the storm actually looks like. Not a dramatic warning sign. A quieter version of the same patterns that worked all the way up. The breakouts still happen. They just stop meaning what they used to mean.
The trader who’s been long the trend for weeks doesn’t notice the difference. The patterns look familiar. The chart looks healthy. The subtle erosion in breakout quality is invisible unless you’re specifically watching for it.
Sellers Absorb Into Strength
In an uptrend, sellers exist at every level. What changes during distribution is not whether sellers are present, but how they behave.
Early in a trend, sellers sell into weakness. They wait for pullbacks, they hit bids, they accept the prevailing price. Their selling shows up as drops, dips, brief panics.
During distribution, sellers begin selling into strength. They offer size on the bid side as price rises. They let buyers come to them. The selling doesn’t produce visible drops because it’s being matched against incoming demand. The result is a candle that looks like accumulation — high volume, range expansion, a push to new highs — but the net effect is a transfer of inventory from informed sellers to uninformed buyers.
You can’t see this in the candle. You can sometimes see it in the volume profile, the order flow, or the relationship between volume and price progress. Mostly you see it after the fact, when the same price levels that absorbed all that buying suddenly fail on the first real test.
The Quiet Transfer
Markets don’t end trends in public. They end them in the slow exchange that happens during the sessions nobody pays attention to.
Friday afternoons. Asian sessions during a US holiday. The week between Christmas and New Year. The hours when liquidity is thin and the headlines are quiet. This is where the inventory actually changes hands. Not because the participants are hiding, but because thin liquidity is where large positions can be unwound without moving the price too sharply.
By the time the loud session arrives — the Monday open, the FOMC reaction, the breakout candle — the transfer is already complete. The participants who needed to exit have exited. What remains is a market full of recent buyers who think they’re early to a trend that’s already over.
The visible top happens when these recent buyers finally run out. There’s nobody left to absorb the next supply, and price falls. The drop looks sudden. It wasn’t.
Why Traders Don’t See It
The reason distribution is hard to see in real-time is that the surface of the market looks indistinguishable from continuation.
Price is making new highs. Sentiment is positive. Headlines are bullish. Technical indicators on most timeframes are aligned. Anyone running a checklist of trend-following criteria will get a green light on every item.
The signals that distribution is occurring are not on the checklist. They’re in the second-order observations: the time it takes for pullbacks to recover, the depth of those pullbacks relative to recent ones, the volume required to make new highs, the behavior of price during low-liquidity sessions, the quality of breakouts on lower timeframes.
These observations require slow attention. They require comparing the current week to the previous one without recency bias. They require accepting that the same chart can mean two different things depending on what’s happening underneath. Most traders don’t have the patience for that kind of observation when the price is still rising.
The Trader Who Exits Too Early
There’s an irony in distribution that catches even careful traders. The person who exits near the actual top usually does so for the wrong reason — and re-enters into the distribution they just avoided.
They exit because they’re nervous. They exit because the move feels stretched. They exit because they want to lock in the profit. None of these are observations about structure. They’re observations about feelings. And feelings produce exits that are often correct by accident.
The problem is what happens next. The trend keeps making new highs for another week or two. The trader who exited starts to feel they made a mistake. The recent buyers are still arriving, the price is still rising, and the absence of an obvious reversal makes the early exit look like cowardice.
So they re-enter. They re-enter into the late stage of distribution, often at a worse price than where they exited, often with a larger position because they’re trying to make up for the move they missed. This is why traders exit winners too early and then immediately give back more than they took: the exit was right, but the framework that produced it can’t distinguish between a genuine top and a normal extension. Without that framework, the re-entry is inevitable.
The trader who avoids this loop isn’t the one who exits earliest. It’s the one who can articulate why they exited. If the answer is structural, they stay out. If the answer is emotional, they’re likely to come back.
What Late-Stage Trends Actually Look Like
A trend in its late stage has a specific feel that doesn’t translate well into a single chart pattern.
Volatility expands without producing real range. Daily candles get larger, but the weekly progress slows. The market feels more violent without going anywhere new. Pullbacks get deeper before recovering. Recoveries take longer to complete.
The dominant narrative reaches its purest form. The most confident articles get published. The most ambitious price targets get cited. New traders enter for the first time, drawn in by the visible strength. Old traders increase position size because the trend has rewarded them for so long.
None of this is a top by itself. Markets can run hot for extended periods. But the combination of expanding volatility, shallowing progress, deepening pullbacks, and peak narrative confidence is the environment in which distribution tends to occur. The top is rarely far behind, even when nothing on the chart says so yet.
The Honest Position
There’s no clean way to know when a trend has ended. The cleanest signals only appear in hindsight, and the real-time signals are always ambiguous enough to be ignored.
What changes for the trader who understands distribution is not their ability to time the exact top. It’s their willingness to reduce exposure incrementally as the second-order signals accumulate. The reactions weaken, so they tighten the stop. The breakouts get sloppier, so they take partial profit. The volume required for new highs increases, so they stop adding to the position.
By the time the visible top prints, they’re already partially out — not because they predicted the top, but because they responded to the structural changes underneath the price. The exit is gradual, unspectacular, and impossible to point to on the chart as a single decision. It’s the only kind of exit that consistently works.
The trend ended quietly the previous Thursday. The trader who noticed wasn’t smarter. They were just watching the right thing.
Every day I track one thing: where market structure and crowd sentiment disagree — and which one leads. Today’s read:
Daily on swaphunt.dev. Same on @SwapHunt. Not financial advice.
메타데이터
- post_id
- 89d185d47095
- slug
- why-strong-trends-end-without-warning-89d185d47095
- url
- https://medium.com/@swaphunt/why-strong-trends-end-without-warning-89d185d47095
- canonical_url
- https://medium.com/@swaphunt/why-strong-trends-end-without-warning-89d185d47095
- author_url
- https://medium.com/@swaphunt
- status
- ok
- fetched_at
- 2026-07-09 20:10:33