VCT 2025 PCF «STAGE 1»: RRQ
ANALYTICS
VCT 2025 PCF «STAGE 1»: RRQ
ANALYTICS
VCT 2025 PCF «STAGE 1»: RRQ ANALYTICS
OVERVIEW
VALORANT Champions Tour (VCT) 2025 is the fifth annual competitive tournament circuit organized by Riot Games. It consists of three seasons — «Kickoff», «Stage 1», and «Stage 2» — each divided into four sub-regions: Americas (AMER), China (CN), EMEA, and Pacific (PCF).
While «Kickoff» served as a testing ground where teams experimented with compositions, strategies, and ideas that could shape the season’s meta, «Stage 1» was the first season with a well-established meta that required teams to adapt and refine their tactics. During this tournament, the best teams earned regional titles and qualified for VCT Masters Toronto and the Esports World Cup (EWC) 2025.
Patch 10.05–10.07
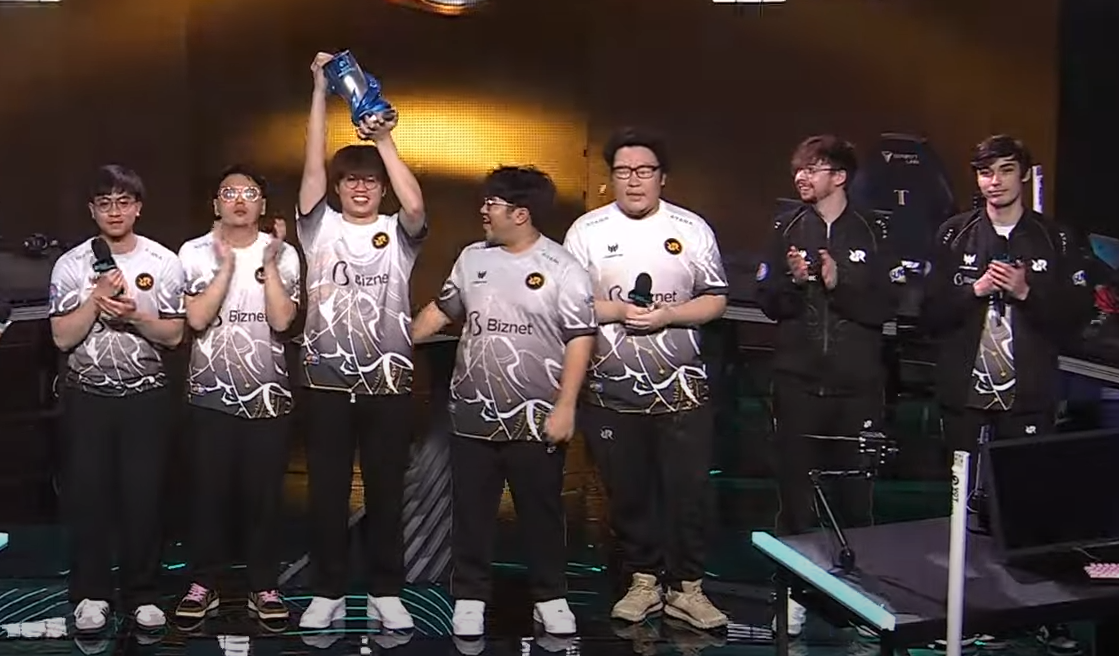
In the PCF region, Rex Regum Qeon (RRQ) delivered an impressive performance during «Stage 1». After a challenging loss to GENG in the upper bracket final, RRQ rallied through the lower bracket with unwavering determination. Their resilience paid off with a decisive victory in the grand final against GENG, crowning them as «Stage 1» champions of the PCF region and securing their spots at VCT Masters Toronto and EWC 2025.
This paper provides an overview of the RRQ team’s performance at the tournament, followed by some conclusions, and compares their performace to «Kickoff».
Other VCT 2025 «Stage 1» papers are available via the links below:
Agent Analytics — link
AMER: G2 Analytics — link
CN: XLG Analytics — link
EMEA: FNC Analytics — link
MAP ANALYSIS
This section analyzes the team’s performance across various aspects to determine their map prioritization. It also compares key metrics with their «Kickoff» results, enabling an assessment of the team’s progress and development.
ROSTER / COMPOSITION

Figure 1. Roster and Composition
As illustrated in Figure 1, the team has nearly fully transitioned to using Tejo and Yoru in their compositions. Additionally, their attempts to integrate Vyse into compositions on various maps are noteworthy, with the Pearl and Split maps showing uncertainty about the composition as a whole. Therefore, most of the team’s compositions deviate from the default ones and feature significant changes.

Figure 2. Roster and Composition During «Kickoff»
As can be observed from the comparison between Figures 1 and 2, the team dedicated substantial effort during the off-season, adjusting each map’s composition prior to «Stage 1». These changes were likely prompted by their underwhelming 7th–8th place finish in «Kickoff» and the replacement of «Estrella» with «crazyguy». Ultimately, these adjustments led to significant performance improvements, indicating that the decisions were well-founded.
MAP STATS


Figure 3. Map Performance: Map Playrate and Winrate


Figure 4. Round Performance: Round and Pistol Round Winrates
Based on the visual data presented in Figures 3 and 4, the team’s overall performance can be considered good. However, there are some areas of concern regarding their performance on Fracture and Pearl (which were the main maps during «Kickoff»), although these are not currently a priority for the team. Additionally, their pistol round performance shows room for improvement.
Compared to «Kickoff», the map winrate increased by 9%, but notably, the round and pistol round winrates dropped by 4% and 8%, respectively. This may be attributed to the team performing decently in the previous season, yet lacking consistency, whereas this season featured many close matches.
WIN CONDITIONS


Figure 5. Post-Plant Performance: Post-Plant Winrate and Its Change Compared to the «Stage 1» Teams Average


Figure 6. Retake Performance: Retake Winrate and Its Change Compared to the «Stage 1» Teams Average
According to the information presented in Figures 5 and 6, the team excels at managing post-plant scenarios across most maps, except Fracture, where challenges are confined to site A. However, retake scenarios reveal greater concerns, with a slight need for improvement on Pearl, Fracture, and Haven (on Haven, site A requires specific attention).
The overall winrate in post-plant and retake scenarios has decreased by 4% from the previous season. However, it is noteworthy that based on the per-map, per-side spike plant ratio, it can be concluded that during «Kickoff» the team focused on aggressive attacking plays and emphasized defense to prevent opponents from planting the spike, whereas in «Stage 1» this approach shifted in a mirrored manner: the team adopted a more restrained attacking style and preferred retake scenarios in defense.
MAP ORDER
Based on all the information provided above, the team’s map priority ranking can be established through a combination of mathematical calculations and logical reasoning. This priority is shown in Figure 7, and it differs from the team’s actual priority based on their veto (see Figure 8).

Figure 7. Map Order: KPI

Figure 8. Map Order: Veto
It differs in that the team overestimates its own strength on Fracture, as well as underestimates its potential on Lotus and Split. Simultaneously, their performance on other maps roughly corresponds to the veto.
PLAYER ANALYSIS
This section evaluates the individual performance of the players during «Stage 1», highlighting their contributions in the overall, attack, and defense categories, and compares these contributions with their «Kickoff» results to assess their progress and development.
Figure 9 presents the overall individual performance metrics of the players: K/D ratio (K/D) and entry rate (E%), where E% shows the winrate of their first duel. These metrics are shown as a change relative to the average values, with K/D set at 1 and E% at 50%.


Figure 9. Player Performance: OVERALL, ATK, DEF
As illustrated in Figure 9, «Jemkin» demonstrates exceptional performance with 1.3 K/D and 59% E%. In contrast, the other four players underperform, falling below average benchmarks, highlighting a clear performance gap within the team. Additionally, some players show inconsistency: «Monyet» struggles in attack but performs adequately in defense, while «crazyguy» performs the opposite.
Comparing the individual performance of the players with the previous season, the following conclusions can be drawn: «Kushy» experienced a decline in performance, particularly on defense; «crazyguy» is nearly on par with «Estrella», an ex-player, but falls short; whereas, the remaining players exhibit largely consistent results with minor variations.
XvY ANALYSIS
This section evaluates the team’s performance in various player-count scenarios (XvY), where X represents the number of live players on the team and Y the opposing team’s live players. It also provides an analysis of their winrate in these scenarios compared to their earlier tournament results to identify improvements or challenges in their adaptability and clutch performance.

Figure 10. XvY Winrate Matrix
Figure 10 demonstrates that the XvY gradient matrix of the RRQ team has a standard distribution, indicating consistent performance across scenarios.

Figure 11. XvY Winrate Change Matrix Compared to the «Stage 1» Teams Average
As shown in Figure 11, the 3v2 and 2v2 scenarios exhibit the most significant improvements. Additionally, the 4v4 and 4v3 scenarios show noticeable improvements, though the 2v1 scenario requires closer attention and improvement.

Figure 12. XvY Winrate Change Matrix Compared to «Kickoff»
As shown in Figure 12, the team achieved significant performance improvements in 1v1, 2v2, and 3v4 scenarios compared to the previous season. However, the team should focus on their performance in 4v5, 4v3, and 2v1 scenarios, as it has significantly declined.
ECONOMIC ANALYSIS
In this section, the focus will be shifted to the economic component of the team. The $ sign shows the relationships between different types of buy: full buy ($$$), semi-buy ($$), and eco ($/0). Simultaneously, the Δ$ sign reflects the team’s performance in each round in terms of their buying power relative to that of their opponent: with advantage (+), parity (=), and disadvantage (-). The changes that have occurred since «Kickoff» will also be evaluated.


Figure 13. Economic Performance: $ and Δ$
From an economic perspective (see Figure 13), the team’s performance is equal to or below the average performance of «Stage 1» teams, suggesting potential issues. Moreover, compared to «Kickoff», a decline is evident across nearly all metrics, raising concerns.
메타데이터
- post_id
- 89fec53db33d
- slug
- vct-2025-pcf-stage-1-rrq-89fec53db33d
- url
- https://medium.com/@N1kL/vct-2025-pcf-stage-1-rrq-89fec53db33d
- canonical_url
- https://medium.com/@N1kL/vct-2025-pcf-stage-1-rrq-89fec53db33d
- author_url
- https://medium.com/@N1kL
- status
- ok
- fetched_at
- 2026-07-19 11:43:23