PPIFlow: Picomolar Binder Design and the Limits of the BLI Data
Changping Laboratory’s flow-matching pipeline reports picomolar affinities for six of seven mini-binder targets, all measured by BLI.
PPIFlow: Picomolar Binder Design and the Limits of the BLI Data
*Changping Laboratory’s flow-matching pipeline reports picomolar affinities for six of seven mini-binder targets, all measured by BLI.*
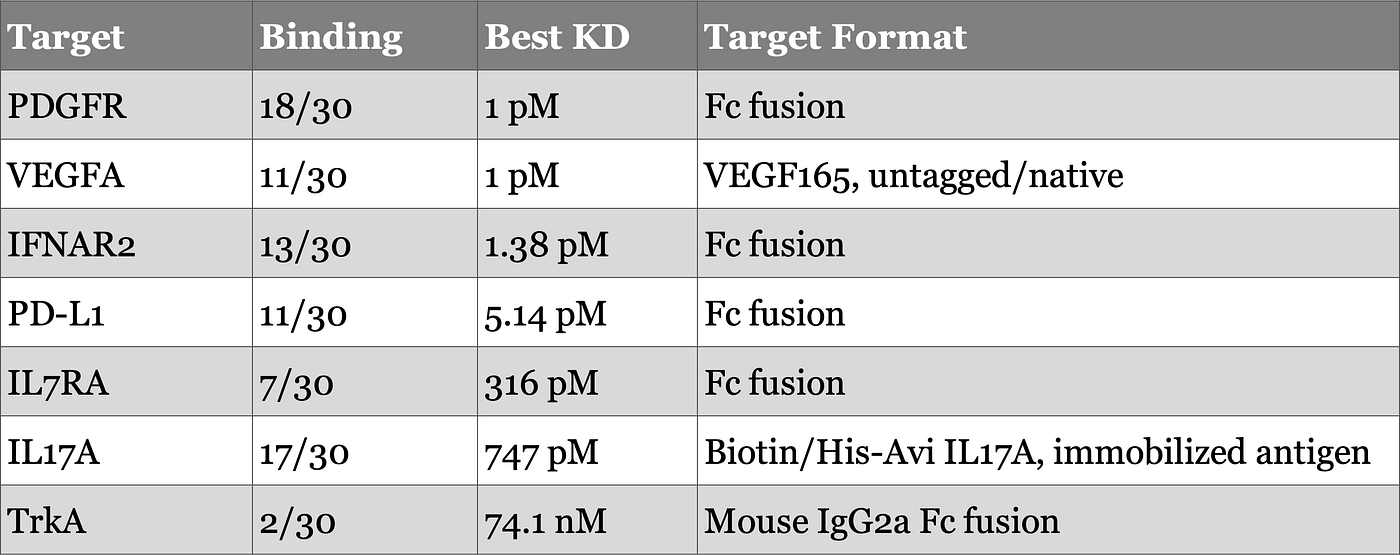
Changping Laboratory released PPIFlow on bioRxiv in January 2026, a flow-matching model for de novo protein binder design paired with an in silico maturation step. Across seven mini-binder targets, they tested 30 designs each (210 total), expressed all 210, and reported a 36.2% sub-µM hit rate (76/210). Best KD per target reached 1 pM for PDGFR and VEGFA, 1.38 pM for IFNAR2, and 5.14 pM for PD-L1. Across eight VHH targets (240 designs), they report 81 total binders (33.8%) and 67 sub-µM binders (27.9%), with a best of 250 pM for CCL2. The headline claim is picomolar and nanomolar binders with no experimental affinity maturation.
The pipeline generates binder backbones by flow matching over residue frames, sequences them with ProteinMPNN or AbMPNN, packs side chains with FlowPacker, runs a maturation step that fixes interface anchor rotamers and regenerates from a partial flow state, and ranks candidates with AF3Score, a score-only adaptation of AlphaFold3. Code and checkpoint links are public. The repo implements the broad workflow, but the released examples do not reproduce the paper workflow out of the box.
The paper also has gaps. The picomolar values come from a BLI assay with a 300 s dissociation phase fit to a 1:1 model, and the tables report KD with no kon or koff. The four deepest mini-binder values come from Fc-fusion or homodimeric targets run as the analyte against a monovalent binder, a format that can produce avidity. The per-target headline is the single tightest design, not the affinity distribution. No binder was tested in a functional or neutralization assay. The epitope was never validated experimentally, no complex was solved, and the affinity was never confirmed by a second method. There is no specificity or polyreactivity panel for the mini-binders, and no SEC, DLS, or MALS on the mini-binder designs. The released ranking code also uses the composite score with the opposite sign from the methods section.
I’m going to walk through what they did, then go through the validation gaps I found.
How It Works
PPIFlow models binder design as a continuous flow over SE(3) residue frames. A pairformer reasons over interface contacts and Invariant Point Attention decodes the frame updates. Training uses a multi-stage curriculum across monomers, protein complexes, scFvs, and VHHs.
The in silico maturation stage runs after initial generation. The model identifies anchor rotamers on the interface that score below −5 Rosetta Energy Units, fixes them, perturbs the backbone to an intermediate flow state (t = 0.6), then regenerates the perturbed regions and redesigns the sequence around the fixed anchors.
For mini-binders, the methods say first-round ProteinMPNN used T = 0.2, with 8 vanilla sequences and 8 sequences biased toward bulky hydrophobic residues per backbone. Across those 16 sequences, Rosetta residue-wise interaction energies were used to merge the residues below −5 REU into an interface rotamer enriched design. The second round used partial flow at t = 0.6 and ProteinMPNN soluble redesign at T = 0.1.
For VHHs, the methods say they sampled 25,000 backbones per target, designed 8 CDR sequences per backbone with AbMPNN at T = 0.5, kept candidates with ipTM > 0.2, and then ran the same rotamer-enrichment plus partial-flow idea. In the second round, 8 refined backbone conformations were generated and 4 sequences per refined structure were redesigned at T = 0.1. Second-round candidates were filtered at ipTM > 0.5 and pTM > 0.8, then validated with AlphaFold3 and DockQ.
Candidate ranking uses AF3Score, which retains the AlphaFold3 confidence head but skips full structure inference, giving about a 100-fold speedup. That speedup is what makes the generation funnel tractable. The paper then ranks final candidates by a composite score: AF3 ipTM × 100 − Rosetta interface score.
Repository Check
The public repo matches the paper at the pipeline-concept level. It has Stage 1 generation, sequence design, FlowPacker side-chain packing, AF3Score filtering, Rosetta interface analysis, fixed-position extraction, partial redesign, second-round scoring, AF3 refolding, DockQ, RosettaRelax, ranking, and report generation. It also provides links for four checkpoints: binder, antibody, nanobody, and monomer.
The clearest discrepancy is in the ranking code. The paper ranks candidates by AF3 ipTM × 100 − Interface Score. The repo RankStep (steps/rank_step.py) computes rank_score = interface_score + 100 × ipTM and sorts descending. The interface_score it reads is Rosetta’s get_interface_dG (steps/rosetta/relax_complex.py), which is negative for a favorable interface. The paper subtracts the interface score, so a more favorable (more negative) interface raises the composite score. The repo adds it, so a more favorable interface lowers the composite score. At equal ipTM, the released ranking pushes the less favorable interfaces toward the top. This is a sign inversion relative to the published formula, and it changes which designs rise.
The released configs are also demo-scale, not the paper runs. The binder example sets samples_per_target to 10, and the demo task disables both PPIFlowStep and the stage-1 MPNN step, so the binder example starts from provided structures rather than generating. The binder config that does exist sets base ProteinMPNN, 8 sequences, T = 0.1, and partial-flow start_t = 0.7, against the paper’s T = 0.2 with 8 vanilla plus 8 biased sequences and partial flow at t = 0.6. The nanobody example uses 10 samples, AbMPNN T = 0.1, filters at ipTM_A_C > 0.3 and chain_A_ptm > 0.7, and sets run_AF3_inference to false, against the paper’s 25,000 backbones, AbMPNN T = 0.5, round-1 ipTM > 0.2, and round-2 ipTM > 0.5 and pTM > 0.8 with AF3 validation.
There is also a path issue. The example step configs point to absolute paths such as /tools/PPIFlow and /tools/flowpacker, and the README states that many paths in the example configs must be replaced with local paths, so those are placeholders by design. Install.sh is a separate problem: it sets the tools directory to tools and changes into it, while the repository ships a tool directory (singular). Install.sh will fail at that step unless the directory is renamed.
So the repo is an open implementation of the pipeline concept, not a turnkey reproduction of the paper’s 210 mini-binder and 240 VHH experiments.
Experimental Results
All affinities were measured by BLI on a Gator Bio instrument.
Mini-binders, 30 designs per target, 210 total:

PPIFlow mini-binder design and experimental validation across seven targets. (a) Highest-affinity de novo binder per target, with expression, hit rates, best affinities, and representative BLI sensorgrams. (b) Per-target hit rates. (c) Per-target affinity distributions (violin plots). (d, e) Interface side-chain packing for PDL1_26 after initial generation (d) and in silico affinity maturation (e). (f) AF3Score profiles for Round 1 versus Round 2 designs. (g, h) AF3Score pTM (g) and ipTM (h) for IFNAR2 across design strategies.
VHHs, 30 designs per target, 240 total:


PPIFlow VHH design and experimental validation across eight targets. (a) Highest-affinity de novo VHH per target, with expression, binding hit rates, best KD, and representative BLI sensorgrams. (b) Per-target hit rates. (c) Per-target affinity distributions (violin plots), with previous-best binders marked. (d, e) Interface side-chain packing for CCL2_21 after initial generation (d) and in silico affinity maturation (e), with AF3Score ipTM and interface scores. (f) AF3Score complex ipTM for Round 1 versus Round 2 designs across targets. (g, h) AF3Score VHH pTM (g) and complex ipTM (h) for CCL2 across design strategies.
Expression was 100% in both campaigns. The sub-µM hit rate was 36.2% for mini-binders and 27.9% for VHHs. The best-KD column is the single tightest design per target, not the median.
Strengths
Hit rate from a purely computational funnel. 36.2% of mini-binders bound below 1 µM across seven structurally diverse targets, with no wet-lab affinity maturation. For a generate-filter-test pipeline, that is a strong screen.
The VHH screen also worked across most targets. The paper reports binders for seven of eight VHH targets and 67 sub-µM designs out of 240 tested. The best VHH reached 250 pM against CCL2, and HNMT, PDGFR, and 1433E reached single-digit nanomolar best values.
The maturation ablations support the mechanism. Fixing anchor rotamers and running partial flow raised AF3Score pTM and ipTM and improved Rosetta interface scores relative to initial generation and refinement-only baselines. PDL1_26 went from −50.84 to −63.97 REU interface score and 0.76 to 0.85 ipTM; CCL2_21 went from 0.26 to 0.58 ipTM. The step does what the paper claims computationally.
AF3Score gives about a 100-fold scoring speedup over full AF3 inference, which is what makes large candidate funnels practical.
The open-source release is useful. The repo exposes the core pipeline, PPIFlow model code, example configs, and checkpoint links. It is not a turnkey reproduction of the paper’s experimental runs, but it is more than a static model card or a methods-only release.
Gaps
Gap #1: The Best-KD Row Is One Design, Not the Distribution
The per-target headline reports the single tightest binder, not the spread. For IL17A, Table S7 shows a broad distribution: one 747 pM design, several designs in the 10–100 nM range, and several weaker designs above 100 nM. The 36.2% sub-µM hit rate describes the screen. The best-KD row describes one outlier per target. The two numbers answer different questions, and the second one carries the picomolar claim.
Gap #2: The 300 s Dissociation Window Cannot Resolve Picomolar Affinities
The mini-binder assay uses a 120 s association phase, a 300 s dissociation phase, and a 1:1 fit. Take KD = 1 pM, the value reported for PDGFR and VEGFA. With a kon of 1e6 M⁻¹s⁻¹, koff is 1e−6 s⁻¹, so the complex loses about 0.03% of signal across the 300 s window. With a kon of 1e5 M⁻¹s⁻¹, it loses 0.003%. A 1:1 model cannot reliably fit an off-rate from a trace that is flat inside baseline noise, so the reported KD can become dominated by the lower resolvable koff range or fitting bounds. Two targets returning 1 pM is consistent with a fit approaching that floor.
To see even 5% dissociation across 300 s, koff has to be near 1.7e−4 s⁻¹, which paired with a typical kon is a KD in the high-picomolar to low-nanomolar range. That is the floor this assay resolves. The tables report KD only, with no kon and no koff, so the one number that would settle this is not shown.
Gap #3: The Deepest Affinities Come From Bivalent Analytes Against Monovalent Binders
The four tightest mini-binder values come from multivalent or dimeric targets run as analyte over a nominally monovalent, surface-immobilized His-tagged binder: PDGFR (Fc fusion, 1 pM), VEGF165 (native dimeric ligand, 1 pM), IFNAR2 (Fc fusion, 1.38 pM), and PD-L1 (Fc fusion, 5.14 pM). The methods confirm this orientation: for TrkA, IFNAR2, IL-7RA, PD-L1, PDGFR, and VEGF-A, the His-tagged binder was immobilized on the sensor and the target was the analyte. A bivalent analyte can bridge two surface-bound binders. The second arm rebinds before the complex fully releases, which suppresses the apparent off-rate far below the monovalent value. A 1:1 fit reads that slow apparent koff as ultra-high affinity. The reported numbers are apparent KDs for a bivalent interaction; the intrinsic monovalent KDs are not reported.
The orientation that avoids bridging gives a different answer. IL17A was run with the monovalent binder as the analyte over immobilized antigen, and the best design came in at 747 pM. IL7RA, an Fc fusion as analyte, gave 316 pM. TrkA, an Fc fusion too, stayed at 74.1 nM, because only 2 of 30 designs bound at all and avidity cannot rescue an interface that barely forms. The deepest affinities are concentrated among the bivalent-analyte targets, not the monovalent-analyte measurements.
Gap #4: “Sub-Nanomolar VHHs Across Multiple Targets” Overstates the VHH Data
The VHH bests are mostly nanomolar: CCL2 250 pM, HNMT 2.5 nM, PDGFR 4.09 nM, 1433E 6.47 nM, then 131 to 276 nM for BHRF1, S100A4, and EFNA1. IL13 produced no binders.
The abstract claims sub-nanomolar VHH binders across multiple targets, and the Figure 4 caption names CCL2, PDGFR, and 1433E as sub-nanomolar. In the same figure, CCL2 is 250 pM, but PDGFR is 4.09 nM and 1433E is 6.47 nM. One of the three is sub-nanomolar.
Gap #5: No Orthogonal Affinity Confirmation
All affinity measurements come from one platform: BLI on a Gator Bio instrument. No picomolar binder was confirmed by SPR, KinExA, equilibrium binding, competition titration, or another method that can independently test the affinity range.
This is the part that carries the 1 to 5 pM claims. A 300 s BLI dissociation trace with a bivalent analyte can return an apparent KD set by assay geometry and fitting limits. Orthogonal confirmation would distinguish a picomolar binder from a koff-limited BLI artifact.
Gap #6: No Functional Data
No neutralization or cell-based assay shows any binder blocks its target’s biological interaction. Binding to PD-L1, VEGFA, or IL17A is reported as KD, not as IC50 against the cognate interaction (PD-L1/PD-1, VEGFA/VEGFR, IL17A signaling). For targets defined by a function, binding without a blocking readout leaves the therapeutic claim untested.
Gap #7: No Experimental Epitope Validation
PPIFlow is described as targeting predefined epitopes through hotspots, and the design inputs list hotspot residues for each target. But the experimental data only show target binding. There is no competition experiment, alanine scanning, mutagenesis, HDX, or structure showing that the binders engage the intended epitope.
This is a major gap for an epitope-guided design method. A binder can hit the target and still bind somewhere else. Without epitope validation, the paper supports target binding, not successful epitope targeting.
Gap #8: No Experimental Structures
The paper shows AF3 models of the binder-target complexes, but no experimental structure of any complex. No complex was solved by cryo-EM, X-ray crystallography, or NMR.
That leaves two questions unresolved: whether the binder binds in the designed pose, and whether the predicted interface geometry exists experimentally. For a paper claiming direct computational design of picomolar binders, even one structure would have settled the binding mode.
Gap #9: No Specificity or Polyreactivity Panel
There is no off-target or polyreactivity testing for the mini-binders. The Figure S7 specificity note refers to multi-point kinetic titrations, not cross-reactivity against unrelated proteins. A de novo interface has no selection pressure against non-specific binding, so polyreactivity has to be measured after the fact. Standard options are baculovirus particle ELISA, PSR, heparin, insulin, DNA, or a panel of unrelated antigens. None were run.
The same point applies to VHH specificity. The paper shows target binding kinetics, but not a panel demonstrating that the designed binders avoid unrelated proteins.
Gap #10: Limited Oligomeric-State and Developability Data
For mini-binders, there is no SEC, DLS, or MALS on the designs. Aggregated or multimeric binder on the sensor can produce the same slow apparent off-rate as avidity, so the biophysical state of each design is part of the affinity question. A basic SEC and DLS characterization of the confirmed mini-binders would have separated a monomeric high-affinity binder from an aggregation artifact.
For VHHs, the methods mention SEC-HPLC during purification, but the paper does not report per-design SEC traces, oligomeric-state distributions, thermal stability, or aggregation behavior for the confirmed binders. That is less severe than the mini-binder case, but still incomplete for a therapeutic framing.
Gap #11: The Repo Does Not Reproduce the Paper Workflow Exactly
The repo implements the broad design pipeline, but the released configs are not the paper configs, and the ranking code does not match the paper formula.
The strongest mismatch is the ranking sign described above: RankStep computes interface_score + 100 × ipTM, while the paper specifies 100 × ipTM − Interface Score, and the Rosetta interface score is negative for favorable binders. The mini-binder example uses 8 ProteinMPNN sequences at T = 0.1 instead of the paper’s 8 vanilla plus 8 biased sequences at T = 0.2, and partial-flow start_t = 0.7 instead of t = 0.6. The VHH example uses 10 samples instead of 25,000, AbMPNN T = 0.1 instead of T = 0.5, looser AF3Score thresholds, and disables AF3 inference in the refold step. Install.sh changes into a tools directory while the repo ships a tool directory, so it fails at that step unless renamed.
This does not invalidate the paper. It changes how the open-source release should be described. The repo is an implementation of the pipeline concept, not an exact reproducibility package for the reported experiments.
Conclusion
PPIFlow generates expressed, target-binding proteins at a 36.2% sub-µM mini-binder rate from a purely computational funnel, and the maturation ablations show the partial-flow step improves interface metrics as described. The VHH campaign also produced binders for seven of eight targets, including a 250 pM CCL2 design. The open-source release is always commendable and appreciated.
But the strongest number in the paper is still the screen-level hit rate, not the single-design picomolar KD values. The picomolar values read as apparent affinities from a 300 s, koff-limited BLI assay, often in a bivalent-analyte format. The experiments that would test them are missing: the kinetic rate constants, an orthogonal affinity method, a functional assay, an experimental structure, and epitope mapping.
Here’s what would make this work stronger: report kon and koff for every picomolar binder, not just KD. Repeat the deep-pM measurements with monovalent assay formats and longer dissociation windows. Confirm at least one picomolar value with an orthogonal method such as KinExA or equilibrium competition. Run a functional IC50 against the cognate interaction for the therapeutic targets. Map epitopes with competition, mutagenesis, or a structure. Run a polyreactivity panel. Add SEC, DLS, or SEC-MALS on the confirmed mini-binders to rule out aggregation. Release the exact paper configs and the ranking formula used to select the tested designs.
Until then, the sub-µM hit rate is the number the data supports, and the picomolar values should be treated as apparent BLI affinities rather than intrinsic monovalent KDs.
Too many acronyms in one post? **Check out my biotech abbreviation cheat sheet** and feel free to suggest additions.
Follow me on **Substack, Medium, Bluesky, and LinkedIn **for more posts on drug discovery, assay development, and screening workflows.
Views expressed are my own and do not represent my employer.
메타데이터
- post_id
- 8a0336bf526a
- slug
- ppiflow-picomolar-binder-design-and-the-limits-of-the-bli-data-8a0336bf526a
- url
- https://medium.com/@enginyapici/ppiflow-picomolar-binder-design-and-the-limits-of-the-bli-data-8a0336bf526a
- canonical_url
- https://medium.com/@enginyapici/ppiflow-picomolar-binder-design-and-the-limits-of-the-bli-data-8a0336bf526a
- author_url
- https://medium.com/@enginyapici
- status
- ok
- fetched_at
- 2026-06-20 20:29:01