CpK Calculation
CpK Calculation
I shall go through the steps to calcuate CpK index. I like to highlight a point here that the CpK values are similar but not same as PpK values. CpK indicates the measure of process capability whereas PpK measures the process performance.
CpK calculation needs estimated standard deviation (different from standard deviation). This is also known as sigma(within).

As calculation of PpK is straight forward, but CpK calculation needs sampling of data, I have shown here only the calculation steps of CpK.
Let me go through the steps as below.
import pandas as pd
import numpy as np
Load Data
Reading the below sample file. This is a fictitous file created by random values.
df=pd.read_csv("SampleDataForCpKCalculation.csv")Glimps of few records from top of the file.
df.head()
Number of groups (by hour) and the count of records for each hour.
df['Hr'].value_counts()17 17
20 15
19 15
18 15
16 15
21 12
Name: Hr, dtype: int64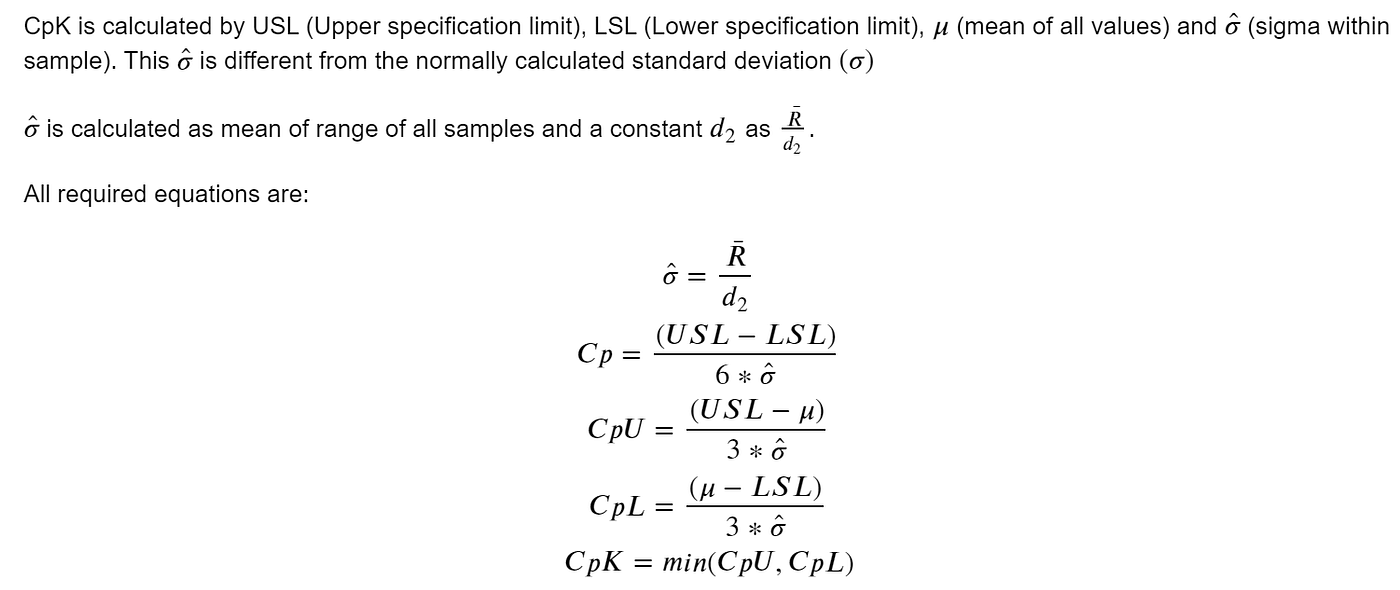
Sampling and grouping of data
I shall group the data based on the hours values. There are k=6 different values of Hour. From each I shall take n=10 data points as sample.
Initialize a dictionary to keep range values for each group. Also define a group object from the data set based on ‘Hr’.
grp_sample={}
df_grp = df.groupby('Hr')
Perform loop to calculate range of all groups.
for g,d in df_grp.groups.items():
    rand_idx=np.random.choice(d,10)
    sample_range=df.loc[rand_idx,:].Values.max()-df.loc[rand_idx,:].Values.min()
    grp_sample[g]=sample_range
Range of values for each sample with 10 sample records each.
grp_sample{16: 0.005499999999999616,
17: 0.00709999999999944,
18: 0.0035999999999987153,
19: 0.0027999999999988034,
20: 0.009100000000000108,
21: 0.02909999999999968}Find mean of ranges for all samples (n=6)
R_bar=np.mean(list(grp_sample.values()))
print(round(R_bar,6))0.009533Values of d2 for given values of k and n.

In my case k=6 and n=10, hence $d_2$ = 3.095
Find sigma_hat
sigma_hat = R_bar/3.095
print(round(sigma_hat,6))0.00308CpK Calculation
Define upper and lower specification limits.
USL=14.61
LSL=14.55
Store mean of the values.
mu = df.Values.mean()Calculate CpK index
Cp = (USL-LSL)/(6*sigma_hat)
CpU= (USL-mu)/(3*sigma_hat)
CpL= (mu-LSL)/(3*sigma_hat)
CpK=min(CpU, CpL)
Print CpK index values
print('Cp=',Cp)
print('CpU=',CpU)
print('CpL=',CpL)
print('CpK=',CpK)
Cp= 3.246503496503634
CpU= 2.2685399151409262
CpL= 4.224467077866342
CpK= 2.2685399151409262Plots
Plot histogram of the values along with upper and lower specification limits.
from matplotlib import pyplot as pltPlot histogram
fig,ax=plt.subplots(nrows=1,ncols=1,figsize=(6,5));

df.Values.hist(bins=30,ax=ax,color='grey',alpha=0.6);

plt.vlines(x=USL,ymin=0,ymax=13,color='red');
plt.vlines(x=LSL,ymin=0,ymax=13,color='red');
plt.vlines(x=mu,ymin=0,ymax=13,color='blue');

p_text = 'CpK='+ str(np.round(CpK,3));
plt.text(14.56,6.2,p_text);
With Cpk = 2.269, which is greater than 1.3, this process is highly capable.
Conclusion
With the intention to help data Scientists on the basic understanding of CpK calculation, I have creating this white paper. I wish this humble presentation will help the Data Scientist community.
#End#메타데이터
- post_id
- 8b34e31f9b7d
- slug
- cpk-calculation-8b34e31f9b7d
- url
- https://medium.com/@KousikRoyDataScientist/cpk-calculation-8b34e31f9b7d
- canonical_url
- https://medium.com/@KousikRoyDataScientist/cpk-calculation-8b34e31f9b7d
- author_url
- https://medium.com/@KousikRoyDataScientist
- status
- ok
- fetched_at
- 2026-06-21 07:44:09