Is Bitcoin Quietly Following a Textbook Wyckoff Accumulation Pattern?
A classic market structure may be forming beneath the surface, suggesting that smart money is preparing for the next major move.
Is Bitcoin Quietly Following a Textbook Wyckoff Accumulation Pattern?
A classic market structure may be forming beneath the surface, suggesting that smart money is preparing for the next major move.
Bitcoin’s recent correction has left investors divided.
Some see the drop below $70,000 as the beginning of a deeper bear market. Others believe the worst may already be behind us.
But when looking beyond daily volatility and focusing on market structure, a different narrative begins to emerge.
Not a Medium member? Read the full article **here**.
According to the Wyckoff Method, Bitcoin may currently be building a textbook accumulation pattern, the type of structure that has historically appeared before major bull market advances.
If that’s the case, the recent weakness could be less about panic and more about preparation.
Understanding the Wyckoff Accumulation Model
Developed by legendary market analyst Richard Wyckoff, the accumulation model describes how large institutional players gradually build positions before a significant markup phase.
The process typically unfolds in several stages:
- Preliminary Support (PS)
- Selling Climax (SC)
- Automatic Rally (AR)
- Secondary Test (ST)
- Last Point of Support (LPS)
- Sign of Strength (SOS)
- Markup Phase
Rather than chasing prices higher, smart money tends to accumulate during periods of fear, uncertainty, and negative sentiment.
This often creates a prolonged sideways range that frustrates both bulls and bears before the market eventually breaks higher.
Bitcoin’s Current Structure Looks Familiar
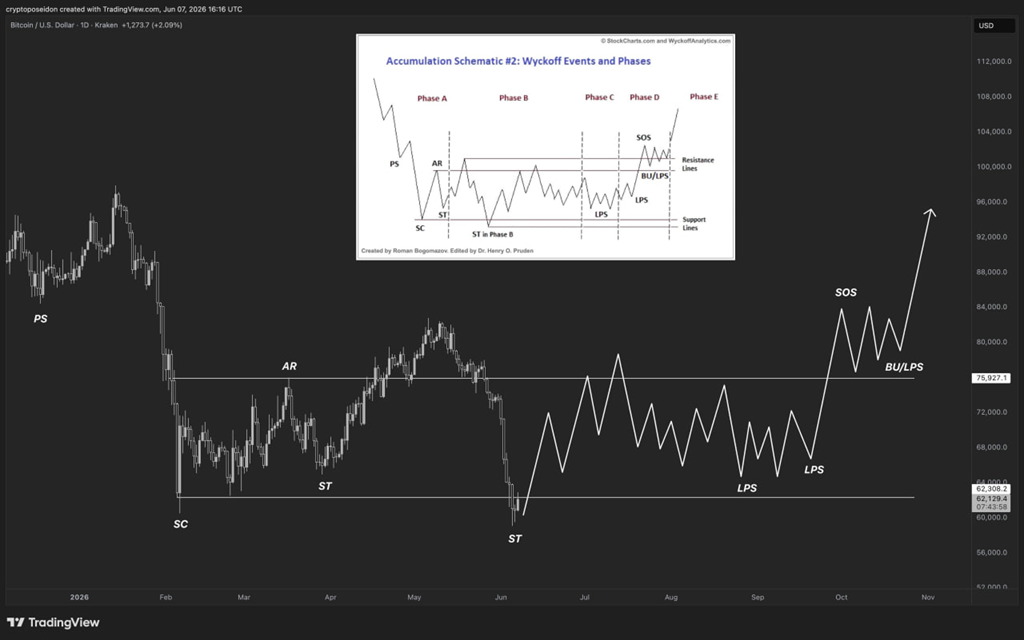
Looking at Bitcoin’s recent price action through the Wyckoff lens reveals a surprisingly clean setup.
BTC/USDT 1D Chart on trading view
The initial selling pressure created what appears to be a Preliminary Support zone before a sharp decline formed a Selling Climax near the recent lows.
From there, Bitcoin staged an Automatic Rally before returning for multiple Secondary Tests, repeatedly revisiting support levels without creating significant new lows.
More recently, the market appears to be forming several Last Points of Support, areas where sellers lose momentum and buyers quietly absorb available supply.
This behavior is often interpreted as a sign that stronger hands are accumulating while retail sentiment remains cautious.
The Sign of Strength May Be Next
If the accumulation thesis remains valid, the next important phase would be the Sign of Strength.
This occurs when price begins breaking above resistance levels that have contained the market throughout the accumulation range.
Historically, this phase often signals that demand is finally overwhelming supply.
Once that transition occurs, markets frequently enter what Wyckoff described as the markup phase, the stage where prices begin trending aggressively higher and public participation returns.
In previous Bitcoin cycles, similar transitions have produced some of the strongest advances of the entire bull market.
Why Smart Money Prefers These Conditions
One of the most important principles of the Wyckoff Method is that major players rarely buy during periods of excitement.
They buy when fear dominates headlines.
The current market environment certainly fits that description.
Concerns about inflation, interest rates, ETF outflows, geopolitical uncertainty, and weakening sentiment have created a backdrop where many investors remain hesitant.
Yet historically, these are often the conditions where long-term positions are built.
Accumulation phases are designed to be uncomfortable.
They shake out weak hands, create uncertainty, and test investor conviction before larger trends emerge.
What Would Confirm the Bullish Scenario?
For the Wyckoff accumulation thesis to play out, Bitcoin needs to accomplish one critical task:
Break above the upper boundary of its current trading range with strong momentum and sustained buying volume.
That move would likely signal the beginning of the Sign of Strength phase and potentially open the door to a much larger advance later in the year.
Until then, volatility and range-bound price action remain entirely consistent with the accumulation process.
Final Thoughts
No market structure guarantees future results, and Bitcoin remains vulnerable to macroeconomic shocks and unexpected events.
However, when viewed through the framework of the Wyckoff Method, the current chart looks far less like a collapse and far more like a market quietly building a foundation.
If this interpretation proves correct, the recent correction may eventually be remembered not as the start of a bear market, but as the accumulation zone that preceded Bitcoin’s next major expansion.
And if Richard Wyckoff were looking at today’s chart, he might argue that smart money has already begun positioning for what comes next.
Join my community of crypto enthusiasts and serious traders!
👉🏻 **Join my Telegram Channel for Crypto**
️👉🏻 Join my Telegram Channel for Gold
👉🏻 Join my Private Email list & Get Access to our Trading Signals
👉🏻️ Join my Medium newsletter and be notified when I publish new articles!
Disclaimer: This article is for educational purposes only and should not be considered financial advice. Always conduct your own research before making any decision.
메타데이터
- post_id
- 8d3cc4e276b2
- slug
- is-bitcoin-quietly-following-a-textbook-wyckoff-accumulation-pattern-8d3cc4e276b2
- url
- https://medium.com/crypto-cap/is-bitcoin-quietly-following-a-textbook-wyckoff-accumulation-pattern-8d3cc4e276b2
- canonical_url
- https://medium.com/crypto-cap/is-bitcoin-quietly-following-a-textbook-wyckoff-accumulation-pattern-8d3cc4e276b2
- author_url
- https://medium.com/@Tradingpass
- status
- ok
- fetched_at
- 2026-06-10 13:10:15