Your SLOs Should Be Kubernetes Resources, Not Grafana Dashboards
How treating Service Level Objectives as declarative infrastructure changed the way I think about reliability
Your SLOs Should Be Kubernetes Resources, Not Grafana Dashboards
How treating Service Level Objectives as declarative infrastructure changed the way I think about reliability
Every SRE team I’ve talked to has the same problem. Somewhere in their stack, there’s a Google Doc or a Confluence page titled something like “SLO Definitions — Q3 2024.” It lists targets. 99.95% availability for checkout. P99 latency under 300ms for search. 99.9% success rate for payments.
And somewhere else entirely — in a completely different system — there are Prometheus recording rules that may or may not implement those targets correctly. And in yet another system, Grafana dashboards that may or may not visualize them accurately. And in someone’s head, there’s tribal knowledge about what the actual burn rate thresholds should be.
None of these things are connected. None of them are version-controlled together. None of them go through pull request review as a single unit.
I started asking myself a question that seemed obvious once I said it out loud: if we treat deployments, services, ingress rules, and network policies as declarative Kubernetes resources — versioned in Git, reconciled by controllers, reviewed in PRs — why don’t we do the same thing with SLOs?
This post walks through why I think SLOs belong in the Kubernetes API, how to build an operator that makes this work, and the architectural decisions that come up when you try.
The Problem With How We Define SLOs Today
The standard SRE approach to SLOs goes something like this:
Step 1: A team sits in a meeting and agrees on targets. Someone writes them down.
Step 2: An SRE translates those targets into Prometheus recording rules. Something like:
groups:
  - name: slo_checkout_availability
    rules:
      - record: slo:checkout:error_rate:5m
        expr: |
          sum(rate(http_requests_total{service="checkout", code=~"5.."}[5m]))
          /
          sum(rate(http_requests_total{service="checkout"}[5m]))
Step 3: Someone creates a Grafana dashboard that visualizes error budgets based on these rules.
Step 4: Someone configures alerting rules for burn rate thresholds, hopefully following the multi-window multi-burn-rate approach from Google’s SRE workbook.
Step 5: Six months later, the team revises the SLO target from 99.95% to 99.9%. Someone updates the Confluence page. The Prometheus rules don’t get updated for three weeks. The Grafana dashboard still shows the old target. The alerts fire at wrong thresholds for a month until someone notices.
I’ve seen this exact sequence play out at scale. The fundamental issue is that an SLO is a single concept being expressed across four disconnected systems maintained by different people at different times.
This is a configuration drift problem. And we already know how to solve configuration drift.
What If SLOs Were CRDs?
Imagine this is your entire SLO definition:
apiVersion: slo.kubeslo.dev/v1
kind: ServiceSLO
metadata:
  name: checkout-availability
  namespace: production
  labels:
    team: payments
    tier: critical
spec:
  service: checkout-api
  description: "Checkout API availability for end users"
  objective: 99.95
  window: 30d
  indicator:
    type: availability
    metric: http_requests_total
    totalFilter: 'service="checkout-api"'
    errorFilter: 'code=~"5.."'
  alerting:
    burnRates:
      - severity: critical
        shortWindow: 5m
        longWindow: 1h
        factor: 14.4
      - severity: warning
        shortWindow: 30m
        longWindow: 6h
        factor: 6
One file. Version-controlled in Git. Reviewed in a pull request by both the SRE and the product owner. Applied with kubectl apply. And a controller running in the cluster takes this single source of truth and generates everything else automatically.
No manual Prometheus rules. No hand-crafted Grafana JSON. No copy-paste alerting configs. One resource, reconciled continuously.
Building the Operator
I built this using kubebuilder and controller-runtime. The high-level architecture is straightforward:
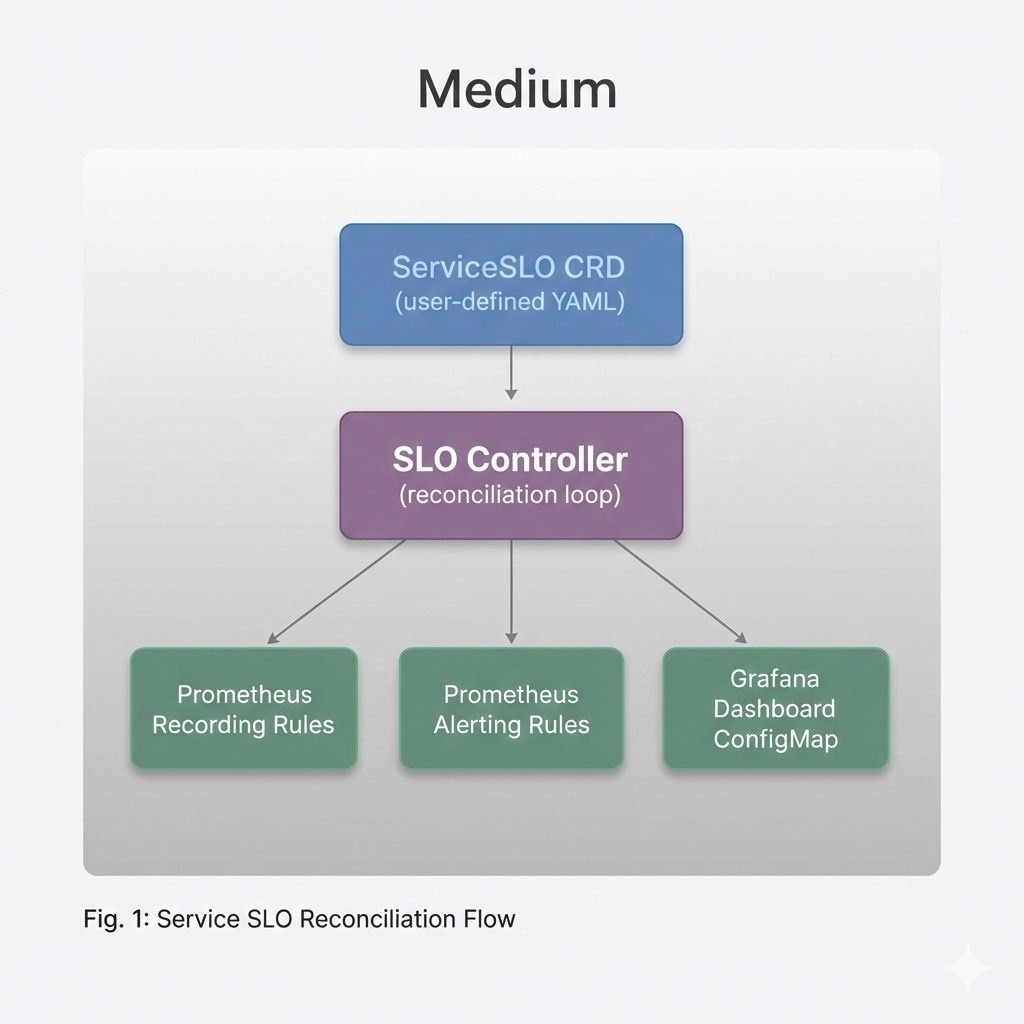
The controller watches for ServiceSLO resources and reconciles three downstream objects:
- A PrometheusRule resource (if you’re using prometheus-operator) containing the recording rules
- A second PrometheusRule resource containing multi-burn-rate alerting rules
- A ConfigMap containing generated Grafana dashboard JSON
Let me walk through the interesting parts.
// api/v1/serviceslo_types.go

package v1

import (
    metav1 "k8s.io/apimachinery/pkg/apis/meta/v1"
)

type SLOIndicatorType string

const (
    SLOAvailability SLOIndicatorType = "availability"
    SLOLatency      SLOIndicatorType = "latency"
)

type SLOIndicator struct {
    Type          SLOIndicatorType `json:"type"`
    Metric        string           `json:"metric"`
    TotalFilter   string           `json:"totalFilter"`
    ErrorFilter   string           `json:"errorFilter,omitempty"`
    // For latency SLOs
    ThresholdMs   float64          `json:"thresholdMs,omitempty"`
    LatencyMetric string           `json:"latencyMetric,omitempty"`
}

type BurnRateAlert struct {
    Severity    string  `json:"severity"`
    ShortWindow string  `json:"shortWindow"`
    LongWindow  string  `json:"longWindow"`
    Factor      float64 `json:"factor"`
}

type SLOAlerting struct {
    BurnRates []BurnRateAlert `json:"burnRates"`
}

type ServiceSLOSpec struct {
    Service     string       `json:"service"`
    Description string       `json:"description,omitempty"`
    Objective   float64      `json:"objective"`
    Window      string       `json:"window"`
    Indicator   SLOIndicator `json:"indicator"`
    Alerting    SLOAlerting  `json:"alerting"`
}

type ServiceSLOStatus struct {
    // Track what we've generated
    RecordingRuleGenerated bool   `json:"recordingRuleGenerated"`
    AlertRuleGenerated     bool   `json:"alertRuleGenerated"`
    DashboardGenerated     bool   `json:"dashboardGenerated"`
    LastReconciled         string `json:"lastReconciled"`
}

// +kubebuilder:object:root=true
// +kubebuilder:subresource:status
type ServiceSLO struct {
    metav1.TypeMeta   `json:",inline"`
    metav1.ObjectMeta `json:"metadata,omitempty"`

    Spec   ServiceSLOSpec   `json:"spec,omitempty"`
    Status ServiceSLOStatus `json:"status,omitempty"`
}
Nothing clever here. Standard kubebuilder boilerplate. The interesting decisions start in the reconciler.
The Reconciliation Loop
// internal/controller/serviceslo_controller.go

func (r *ServiceSLOReconciler) Reconcile(ctx context.Context, req ctrl.Request) (ctrl.Result, error) {
    log := log.FromContext(ctx)

    // Fetch the ServiceSLO resource
    var slo slov1.ServiceSLO
    if err := r.Get(ctx, req.NamespacedName, &slo); err != nil {
        if apierrors.IsNotFound(err) {
            // SLO was deleted — downstream resources get garbage
            // collected via OwnerReferences
            log.Info("ServiceSLO deleted, owned resources will be cleaned up")
            return ctrl.Result{}, nil
        }
        return ctrl.Result{}, err
    }

    // Generate and apply Prometheus recording rules
    if err := r.reconcileRecordingRules(ctx, &slo); err != nil {
        log.Error(err, "failed to reconcile recording rules")
        return ctrl.Result{}, err
    }

    // Generate and apply alerting rules
    if err := r.reconcileAlertingRules(ctx, &slo); err != nil {
        log.Error(err, "failed to reconcile alerting rules")
        return ctrl.Result{}, err
    }

    // Generate and apply Grafana dashboard ConfigMap
    if err := r.reconcileDashboard(ctx, &slo); err != nil {
        log.Error(err, "failed to reconcile dashboard")
        return ctrl.Result{}, err
    }

    // Update status
    slo.Status.LastReconciled = time.Now().UTC().Format(time.RFC3339)
    slo.Status.RecordingRuleGenerated = true
    slo.Status.AlertRuleGenerated = true
    slo.Status.DashboardGenerated = true
    if err := r.Status().Update(ctx, &slo); err != nil {
        return ctrl.Result{}, err
    }

    return ctrl.Result{RequeueAfter: 5 * time.Minute}, nil
}
A few decisions worth explaining:
Why RequeueAfter: 5 * time.Minute? The controller primarily reacts to changes in ServiceSLO resources via watches. But periodic reconciliation catches cases where downstream resources (PrometheusRules, ConfigMaps) were manually deleted or modified. Five minutes is a reasonable balance between responsiveness and API server load.
Why OwnerReferences for cleanup? When someone deletes a ServiceSLO, the recording rules, alerting rules, and dashboard ConfigMap should disappear too. Setting OwnerReferences on all generated resources lets Kubernetes garbage collection handle this automatically. No finalizer complexity needed.
Generating Multi-Burn-Rate Alerts
This is where the actual SRE thinking lives. A naive implementation would generate a single alert when error rate exceeds the budget. But that’s useless in practice — it fires too late for fast burns and too noisy for slow ones.
The multi-window multi-burn-rate approach from Google’s SRE workbook uses different time windows to catch different failure modes:
func (r *ServiceSLOReconciler) generateAlertRules(slo *slov1.ServiceSLO) []monitoringv1.Rule {
    var rules []monitoringv1.Rule

    errorBudget := 1 - (slo.Spec.Objective / 100)
    sloName := slo.Name

    for _, br := range slo.Spec.Alerting.BurnRates {
        burnThreshold := br.Factor * errorBudget

        // Both windows must be breaching to fire
        // This dramatically reduces false positives
        expr := fmt.Sprintf(
            `(
              slo:%s:error_rate:%s > %.6f
              and
              slo:%s:error_rate:%s > %.6f
            )`,
            sloName, br.ShortWindow, burnThreshold,
            sloName, br.LongWindow, burnThreshold,
        )

        rules = append(rules, monitoringv1.Rule{
            Alert: fmt.Sprintf("SLOBurnRate_%s_%s", sloName, br.Severity),
            Expr:  intstr.FromString(expr),
            For:   monitoringv1.Duration("60s"),
            Labels: map[string]string{
                "severity": br.Severity,
                "slo":      sloName,
                "service":  slo.Spec.Service,
            },
            Annotations: map[string]string{
                "summary": fmt.Sprintf(
                    "SLO %s is burning error budget at %.1fx the allowed rate",
                    sloName, br.Factor,
                ),
                "description": fmt.Sprintf(
                    "Service %s has been exceeding its %.2f%% SLO target. "+
                    "At current burn rate, the entire error budget will be "+
                    "exhausted in %.1f hours.",
                    slo.Spec.Service,
                    slo.Spec.Objective,
                    parseWindowHours(slo.Spec.Window)/br.Factor,
                ),
            },
        })
    }

    return rules
}
The and between short and long windows is the critical detail. The short window catches real incidents (something broke in the last 5 minutes). The long window confirms it’s not a transient blip (it’s been degraded for the last hour too). Both conditions must be true simultaneously. This alone eliminates most false positive SLO alerts.
Decisions I Argued With Myself About
Should the operator generate PrometheusRule resources or write to Prometheus directly?
I went with PrometheusRule CRDs. This means the operator depends on prometheus-operator being installed, which is an opinionated choice. The alternative — writing rules to a ConfigMap that Prometheus picks up via rule_files — is more universal but loses the nice reconciliation that prometheus-operator provides.
If I were building this for a broader audience, I’d support both via a configuration flag. For now, prometheus-operator is common enough that coupling to it is acceptable.
Should the Grafana dashboard be a ConfigMap or use the Grafana API?
ConfigMap. Using the Grafana API means the operator needs Grafana credentials and network access, which is a security and operational headache. Most teams using Grafana on Kubernetes already use sidecar-based dashboard provisioning where Grafana watches for ConfigMaps with a specific label and auto-imports them. The operator creates a ConfigMap with the right label and Grafana picks it up. Clean separation of concerns.
Should SLOs be namespace-scoped or cluster-scoped?
Namespace-scoped. Teams own namespaces. SLOs are team-level concerns. A platform team shouldn’t need cluster-admin privileges to define an SLO for their service. Namespace scoping also means OwnerReferences work correctly for garbage collection.
What Happens When Someone Bypasses the Operator
This is the question every operator builder needs to answer. What if someone manually edits the generated PrometheusRule? What if they modify the Grafana ConfigMap directly?
The reconciliation loop handles this automatically. Every 5 minutes (or on any change event), the controller regenerates the expected state from the ServiceSLO spec and patches the downstream resources. Manual edits get overwritten.
This is intentional. The ServiceSLO CRD is the source of truth. If you want to change the alerting threshold, you change the CRD in Git and let ArgoCD sync it. You don’t edit PrometheusRules by hand.
Some operators add an annotation like kubeslo.dev/managed: true to generated resources so it’s obvious to anyone who stumbles across them that they shouldn’t be edited directly.
func managedLabels(slo *slov1.ServiceSLO) map[string]string {
    return map[string]string{
        "app.kubernetes.io/managed-by": "kube-slo",
        "kubeslo.dev/slo-name":        slo.Name,
    }
}
Extending to Latency SLOs
Availability SLOs are straightforward — count errors, divide by total, compare to target. Latency SLOs are trickier because they depend on histogram buckets.
apiVersion: slo.kubeslo.dev/v1
kind: ServiceSLO
metadata:
  name: search-latency
spec:
  service: search-api
  objective: 99.0
  window: 30d
  indicator:
    type: latency
    metric: http_request_duration_seconds_bucket
    totalFilter: 'service="search-api"'
    thresholdMs: 300
  alerting:
    burnRates:
      - severity: critical
        shortWindow: 5m
        longWindow: 1h
        factor: 14.4
The recording rule generation for latency looks different:
func (r *ServiceSLOReconciler) latencyRecordingExpr(slo *slov1.ServiceSLO) string {
    thresholdSec := slo.Spec.Indicator.ThresholdMs / 1000

    // Fraction of requests slower than threshold
    return fmt.Sprintf(
        `1 - (
          sum(rate(%s{%s,le="%.3f"}[%%s]))
          /
          sum(rate(%s{%s,le="+Inf"}[%%s]))
        )`,
        slo.Spec.Indicator.Metric,
        slo.Spec.Indicator.TotalFilter,
        thresholdSec,
        slo.Spec.Indicator.Metric,
        slo.Spec.Indicator.TotalFilter,
    )
}
The %%s is a format placeholder that gets filled in later with the actual window duration for each recording rule. The math is simple: count the requests that fit within the latency bucket, divide by total requests, subtract from 1 to get the “bad” ratio. This becomes the SLI that feeds into the same burn-rate alerting logic.
Why This Matters Beyond Tooling
The real value isn’t the automation. It’s the workflow change.
When SLOs live in Git as Kubernetes resources:
- Product managers can read the YAML and understand what reliability target their service has
- SLO changes go through pull requests where both SREs and developers review them
- Audit history is Git history — you know exactly when a target changed and who approved it
- Rollbacks are git revert
- New services get SLOs on day one because it’s just another YAML file in the deployment repo
The cultural shift matters more than the technical one. SLOs stop being an SRE team concern and become a shared vocabulary that lives next to the deployment manifests, network policies, and everything else that defines how a service runs in production.
I’ve been running this against a test cluster for a few weeks now. The code is on GitHub at [link]. It’s rough around the edges — error handling needs work, the Grafana dashboard templates are basic, and I haven’t written admission webhooks for CRD validation yet. But the core reconciliation loop works and it’s already changed how I think about SLO management.
If your team’s SLO definitions live in a wiki that nobody updates, consider whether they should live in your cluster instead.
메타데이터
- post_id
- 8d94820e2b32
- slug
- your-slos-should-be-kubernetes-resources-not-grafana-dashboards-8d94820e2b32
- url
- https://medium.com/@dpacgdm/your-slos-should-be-kubernetes-resources-not-grafana-dashboards-8d94820e2b32
- canonical_url
- https://medium.com/@dpacgdm/your-slos-should-be-kubernetes-resources-not-grafana-dashboards-8d94820e2b32
- author_url
- https://medium.com/@dpacgdm
- status
- ok
- fetched_at
- 2026-06-22 05:41:33


