Price-to-Sales (P/S) Ratio: When to Use It
Price-to-Sales Ratio compares a company’s market capitalisation to its total revenue, showing how much investors pay for every rupee of…
Price-to-Sales (P/S) Ratio: When to Use It
Price-to-Sales (P/S) Ratio: When to Use It
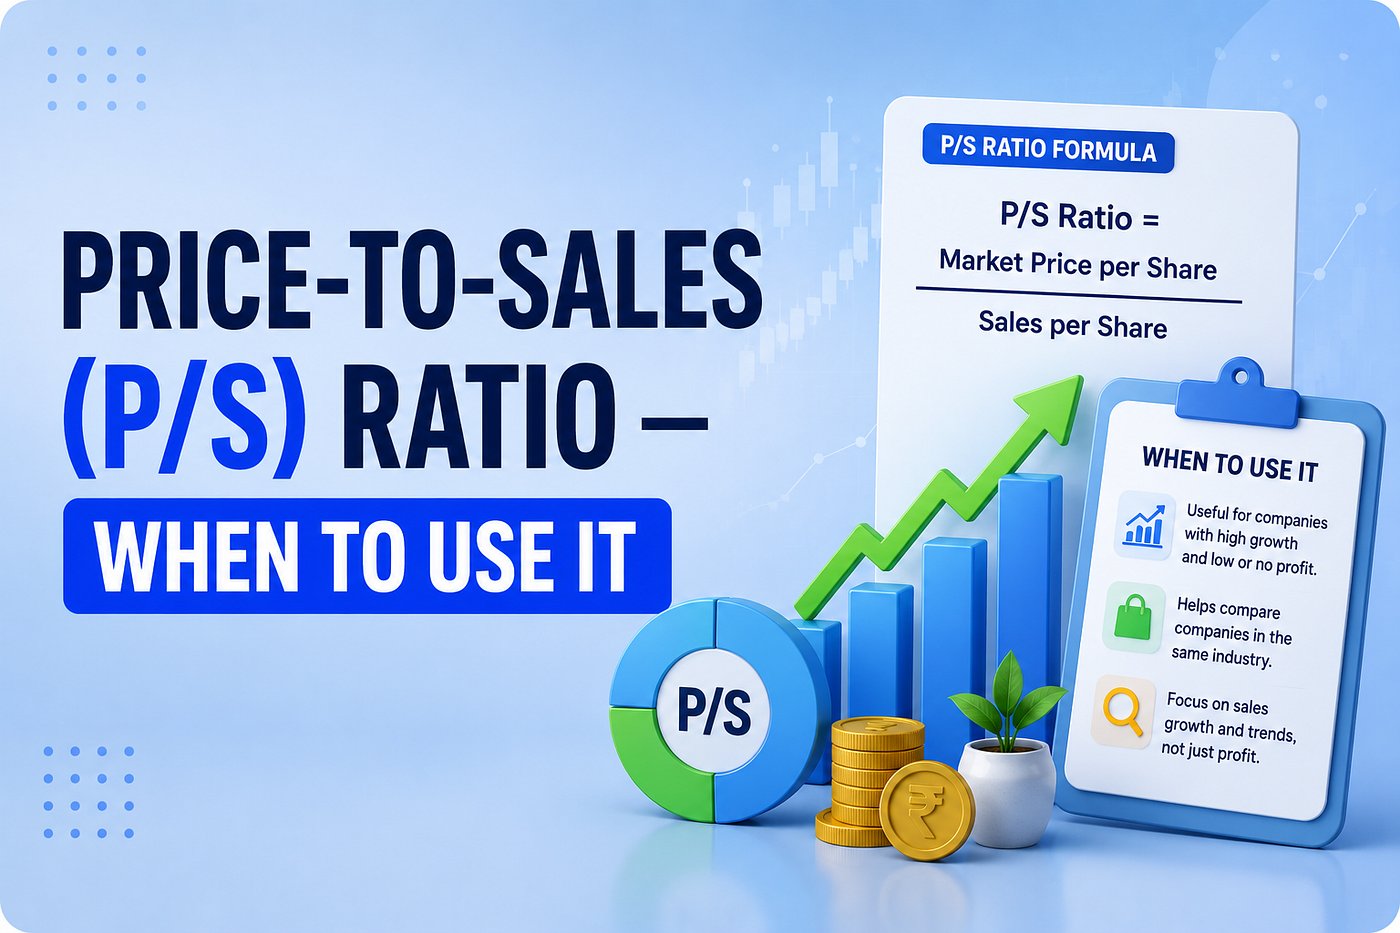
Price-to-Sales Ratio compares a company’s market capitalisation to its total revenue, showing how much investors pay for every rupee of sales. It is calculated as Market Cap divided by Annual Revenue. P/S ratio is most useful for valuing loss-making or early-stage companies where the P/E ratio cannot be calculated or gives a misleading result.
Quick Summary
- P/S Ratio = Market Capitalisation ÷ Annual Revenue
- Works even when a company has no profit, unlike P/E ratio
- A P/S ratio between 1 and 2 is generally considered reasonable, but this varies sharply by sector
- Ignores debt entirely, which is why EV/Sales is often preferred for leveraged companies
- Best compared within the same sector, never across industries
- For the full P/E mechanics this ratio is meant to complement, read P/E ratio explained
What is Price-to-Sales (P/S) Ratio? PS Ratio Meaning
P/S ratio meaning, in plain terms, is how much the market values a company for every rupee of revenue it generates. Investor Kenneth Fisher developed the ratio after noticing that earnings-based metrics break down for young companies going through a temporary rough patch, since revenue stays far more stable than profit.
Unlike net income, sales sit at the top of the income statement and are harder to distort through accounting choices like depreciation policy or one-off write-offs. This makes P/S ratio a cleaner, if less complete, lens on company valuation.
Price to Sales Ratio Formula and How to Calculate It
The price to sales ratio formula has two equivalent versions.
Method 1: P/S Ratio = Market Capitalisation / Total Revenue (trailing 12 months)
Method 2: P/S Ratio = Current Share Price / Revenue per Share
Both give the same result. Market capitalisation equals current share price multiplied by total outstanding shares. Revenue is taken from the top line of the income statement, before any expenses are deducted.
A P/S ratio of 5 means investors are paying Rs 5 for every Rs 1 of annual revenue the company generates.
Worked Example: Calculating P/S Ratio for an Indian Stock
Nykaa parent FSN E-Commerce Ventures carried a market capitalisation of Rs 86,301 crore against FY2026 revenue from operations of Rs 10,022 crore (Source: screener.in company data, June 2026).
P/S Ratio = 86,301 / 10,022 = 8.61x

Calculating P/S Ratio for an Indian Stock
Data sourced from screener.in company filings data. Last updated: June 2026.
A P/S ratio above 8x is steep for a retail-style business, but it reflects investor expectations of continued GMV growth and margin expansion rather than current profitability. To filter Indian stocks by P/S, P/E, and other valuation ratios together, the stock screener lets you build this comparison across sectors in one place.
What is a Good Price-to-Sales Ratio?
There is no universal “good” P/S ratio. It depends heavily on profit margins and growth expectations within each sector.

What is a Good Price-to-Sales Ratio?
Data sourced from NSE/BSE company filings and sector valuation reports. Last updated: June 2026.
A P/S ratio between 1 and 2 is often called reasonable in general finance literature, but high-margin or high-growth Indian companies routinely trade well above this without being overvalued. Always benchmark against direct sector peers, not a generic global rule.
Price-to-Sales Ratio vs P/E Ratio: When P/S Wins
P/E ratio becomes unreliable or unusable in specific situations where P/S still works.
FSN E-Commerce Ventures carried a trailing P/E of 376.48 as of mid-2026 (Source: stockanalysis.com, June 2026), a figure so high it tells an investor almost nothing useful, since thin current profit inflates the ratio to an extreme level. The P/S ratio of 8.61x calculated earlier gives a far more usable read on how the market is pricing the business relative to its actual sales scale.

Price-to-Sales Ratio vs P/E Ratio
P/S wins whenever earnings are too thin, too volatile, or too distorted by one-off items to give a meaningful P/E.
P/S Ratio vs EV/Sales: Why Debt Changes the Picture
P/S ratio uses market capitalisation, which reflects equity value only and ignores how much debt sits on the balance sheet. Two companies with identical P/S ratios but very different debt levels do not carry the same risk.
EV/Sales Ratio = Enterprise Value / Total Revenue
Enterprise Value = Market Capitalisation + Total Debt — Cash and Cash Equivalents
A company funding growth through heavy borrowing will look cheaper on P/S than it actually is, because the debt that funded that revenue is invisible to the ratio. EV/Sales corrects for this by folding debt and cash into the numerator, which is why institutional analysts often prefer it over plain P/S for leveraged Indian companies in capital-intensive sectors like infrastructure or telecom.
When to Use P/S Ratio: A Decision Checklist
Use the P/S ratio when any of the following apply:
- The company has negative net income or earnings too volatile to trust
- You are comparing early-stage or recently listed companies with no profit history
- You want a quick first-pass valuation check before digging into margins
- You are comparing companies within the same sector with similar capital structures
Avoid relying on P/S alone when:
- Comparing companies across different industries
- The company carries significant debt, where EV/Sales is more appropriate
- Revenue quality is questionable, such as heavy reliance on one-off or non-recurring sales
For a fuller breakdown of how financial ratios fit together before you commit capital, see financial ratio analysis.
Limitations of the P/S Ratio
P/S ratio has real blind spots that should temper how much weight it gets in a decision.
It says nothing about profitability. A company can carry a low P/S ratio while bleeding cash on every rupee of sales, which the ratio alone will never reveal.
It ignores margins. A retailer and a software company can show similar P/S ratios while operating at completely different profitability levels, since P/S does not adjust for how much of that revenue converts to profit.
It does not capture debt, as covered above, and it can be inflated by one-time revenue spikes such as a large bulk order or a temporary distribution deal that will not repeat.
P/S ratio works best as a starting filter, not a final verdict, and should always be read alongside profitability and balance sheet metrics before any investment decision.
Conclusion
P/S ratio earns its place specifically where P/E falls apart, for loss-making or early-stage companies where earnings cannot be trusted as a valuation anchor. Use it as a first screen, switch to EV/Sales when debt is significant, and always pair it with profitability checks before drawing conclusions about whether a stock is genuinely cheap or expensive.
This article is for educational purposes only. It does not constitute investment advice. Please consult a SEBI-registered financial advisor before making investment decisions.
About the Author Dipak is a financial content writer at Dhanarthi.com, where he covers Indian equity markets, ETFs, mutual funds, and personal finance. He has researched and written 200+ articles on stock analysis, market data, and investment strategies using NSE, BSE, and AMFI sources.
메타데이터
- post_id
- 8e8aee94ba39
- slug
- price-to-sales-p-s-ratio-when-to-use-it-8e8aee94ba39
- url
- https://medium.com/@dipakbotify/price-to-sales-p-s-ratio-when-to-use-it-8e8aee94ba39
- canonical_url
- https://medium.com/@dipakbotify/price-to-sales-p-s-ratio-when-to-use-it-8e8aee94ba39
- author_url
- https://medium.com/@dipakbotify
- status
- ok
- fetched_at
- 2026-08-12 09:46:13