Rising Energy Costs: Is Solar Really The Cheapest Energy in the Yukon?
Introduction
Rising Energy Costs: Is Solar Really The Cheapest Energy in the Yukon?
Introduction
With the upcoming territorial election and a recently announced 34% rate hike from YEC putting pressure on a worsening cost of living crisis, energy has become a hot topic. The capital projects responsible for the rate hikes are necessary for keeping our most important and reliable energy assets running, like Mayo Generating Station. Many people have tuned into the fact that the incumbent government has failed to enact policies that help stabilize energy prices, or even materially lower emissions as per their goals. In fact, with a lack of new firm clean power, we are set to expand our thermal generation fleet out of necessity. All this in spite of funneling millions of Federal and Territorial money into rooftop and utility scale solar owned by private citizens and corporations.
In the midst of all this controversy, we saw another Solvest post claiming that solar is the cheapest option for new energy in the Yukon. Indeed, this post was widely shared amongst the territory’s strongest solar supporters, some of whom are directly responsible for many of the failed policies, as proof that they were clearly right all along. This one opens with the statement “Solvest CEO, Ben Power, has been busting energy myths on LinkedIn.”.
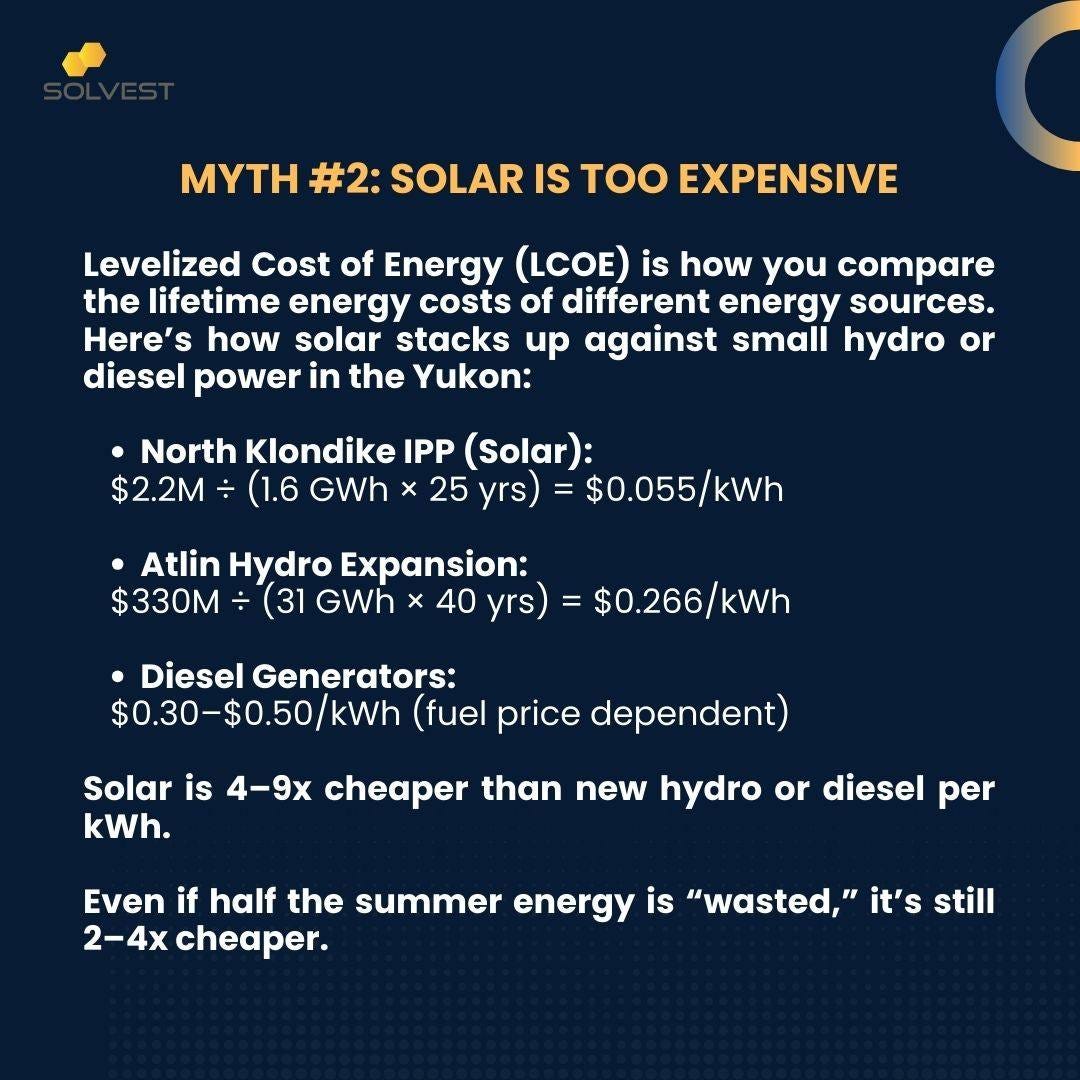
Well, I’m here to myth-bust some ‘busted’ myths. This time, they’ve tidied up their analysis a little bit but it’s still unfortunately pretty sloppy. The most important one I’d like to address is their ‘LCOE’ slide. Here they demonstrate that obviously solar is the cheapest form of energy in the territory based on this key metric. There’s one little issue, amongst many others. This isn’t even an LCOE calculation.
Levelized Cost of Energy, or LCOE, is one of the most commonly used metrics to demonstrate the cost of electricity from a particular generation source. Methodologies may vary based on who is doing the analysis but generally speaking this is the formula for LCOE [1]:

They key phrase being present value. This is the integration of the time value of money, critical in economic analysis. For those unfamiliar with the concept, I suggest you read this article: Time Value of Money (Investopedia). Cashflows are ‘discounted’ (aka devalued) the further along the timeline of a project that you are. The basic concept being that as the economy grows and inflation sets in, you’d prefer a dollar today to a dollar tomorrow, as it will have more purchasing power today. Or, if possible, you’d rather spend a dollar tomorrow than spend a dollar today. Solvest’s calculations are simplified capital costs divided by lifecycle energy with absolutely zero discounting done, amongst other missing factors. Their employment of the phrase LCOE is entirely incorrect here.
Discount Factors
There’s some other caveats to touch on. Firstly, with all the information provided, you can essentially create a proper LCOE (which I will do for you shortly). You’re mostly missing a ‘discount factor’. This is the factor by which each annual cost is discounted back to a ‘present value’. For these types of projects, the discount factor used is what’s called a Weighted Average Cost of Capital. Organizations and companies have different financial structures that allow them to finance new capital projects. This is usually a mixture of both equity (return to shareholders) and debt (return to lending institutions).
Generally speaking, private companies who do not have the backing of a sovereign government, will have a higher cost of capital because they are seen as riskier. Meaning costs of financing new projects is higher in the long run, which makes a big difference when it comes to economic analysis of new projects and calculating LCOE. We’ll talk about appropriate discount factors or WACC soon. But, in short, LCOE will change drastically depending on the discount rate applied (and thus, depending on who is financing the project). Which is one reason why privatizing any aspect of a system that has little opportunity for genuine competition is a pretty terrible idea, but that may be a subject for another post.
How LCOE is Calculated
The most popular form of LCOE (and what they got close to in their calculation), is what could be referred to as ‘energy-only’ LCOE. This means that the only costs considered are those of the plant itself and not any downstream costs it might impose on the system. In addition, it has no consideration of whether that energy is produced at a useful time or not, particularly important when it comes to intermittent renewables. It should be intuitive to most that a hydro plant is inherently firm power. Whereas intermittent renewables need significant investment in storage, overbuilding AND novel grid assets that ensure reliability (such as synchronous condensers, grid forming inverters, etc.). Assets that are not usually necessary for other forms of generation (recent events in Spain and in the Yukon highlight this need[2][3]).
PSSE powerflow models of the YIS were updated to represent the state of the grid immediately prior to two different concerning events that occurred in 2023 and 2024, respectively. These events involved the grid frequency drifting far enough from 60 Hz that the distributed micro-gen tripped off, resulting in the frequency dropping low enough to trigger under-frequency load shedding (UFLS), resulting in power outages.
There is strong evidence that while wholesale (i.e. generation) costs may decrease under high renewable penetration that other system costs tend to rise. There are a variety of studies out there that show near exponential rise in system costs as penetration increases [4][5].

System LCOE based on Solar PV penetration in Germany
Holistic Pricing Frameworks
For most this is intuitive and the usual pushback is that no one expects one single source to be the only form of generation in the energy transition future. Integration costs can vary wildly depending on the investments made and the context of the system in question. This is a fair point but the issue is when you look to energy-only LCOEs to claim that ‘renewables are the cheapest’ you’re doing just that. To genuinely gauge the cost-effectiveness of the grid under different generation mixes you need to study a variety of different generation mixes (and their necessary grid investments) to find what is the ‘cost optimal’ mix. This is called Production Cost Modelling and Capacity Expansion Modelling. In addition, these models need their results increasingly verified through power-flow models that can simulate highly dynamic system factors such as voltage, frequency, inertia, etc. to ensure systems avoid those issues mentioned previously. These are very common components of an Integrated Resource Plan done on a regular basis by utilities. Unfortunately, due to the lack of widespread large, publicly owned and vertically integrated utilities with large renewables portfolios it is often rare to get a ‘whole system’ picture. However, a small, disconnected grid like the Yukon’s would be relatively easy to model.
Without holistic PCM or CEMs, we’re really just guessing as to what the cost optimal incremental expansions to a system are. If I were Premier, I would work with the other territories to pool funding for Northern Energy Innovation to become a center of excellence in the North for this kind of modelling, specialized in remote, Northern mini-grids. I would ensure results are made public, presented in a palatable way, and updated regularly.
What do the numbers we do have say?
In the absence of advanced modelling, let’s at least do some proper LCOE calculations for a few different scenarios:
- Solar and Pumped Hydro
- Conventional Hydro Expansion
- Run-of-River Hydro Expansion
Each scenario will run over a matched timeline of 60 years. To get an idea of how these calculations are done, I would suggest watching this video: Build a LCOE model in Excel in 5 minutes!
All values are escalated from their original year’s dollars to 2025 using StatCan annual CPI data, assuming a 2% inflation rate for 2024 to 2025.
Solar and Pumped Hydro

Without pumped hydro or other storage, the majority of solar output occurs during the summer months (May to September) when we have surplus hydro [6] and thus has zero value to the grid. In fact, it imposes a cost as the hydro must keep spinning to provide spinning reserves, spilling water that could otherwise potentially be held back for winter use (this is nuanced since the ability to hold back water at our hydrogenerating stations is constrained by the Water License and technical parameters, but I digress). The number I was told by a credible source a couple years ago was that solar was costing the grid ~$2 million a year, but I cannot personally confirm that.
Solvest claims that 60% of energy produced by the North Klondike IPP is produced in the shoulder months, though they add May to this claim, which is a surplus hydro month. Using a Whitehorse PVWatts profile, I calculate ~41% of energy is produced in the shoulder season. That doesn’t mean that 41% of the energy offsets fossil fuels. You would have to look at the actual hourly profiles of solar, hydro, and thermal generation to make that claim. It’s likely far, far less. As Solvest mentions, you can change the plant design to produce more energy during colder seasons (orientation, angle, etc.) but this will result in even higher plant costs as you get less density per square meter.
So we’ll use a scenario in which the Yukon deploys seasonal storage (i.e. Pumped Hydro) that allows the solar supply to be shifted to match demand. We’ll use the numbers from the Moon Lake Pumped Hydro Study [1] and Solvest’s values, based on my calculations from my last post.
As the timeline is 60 years and typical lifespan for solar PV is 25 years, the generation will need a refresh partway through, we’ll assume a slightly longer than standard 30 year lifespan for PV to be generous, again.

Solar costs may drop (in real terms) by the time the new phase arrives, but publications like the *Canadian Renewable Energy Market Outlook 2025 *shows total installed costs are likely to level out in the long term. By lowering the cost of Solar Phase 2 by a conservative 10% only nudges the LCOE by 1 cent/kWh.
Real Discount Rate: 4.5%
Degradation Factor: 0.5%/year
Annual Energy: 31 GWh/yr
LCOE: $0.73/kWh
Conventional Hydro Expansion
We’ll use the Mayo B numbers for this. This expansion on the original Mayo A site occurred around 2011. Although it is likely to have a lower marginal cost compared to a brand new conventional hydro site, it is the most recent conventional hydro example we have to pull from.

Real Discount Rate: 4.5%
Degradation Factor: 0%
Annual Energy: 36 GWh/yr
LCOE: $0.40/kWh
Atlin Run of River Expansion
The Atlin Hydro Expansion is one of the more recent attempts at deploying new, firm clean power. It has not gone ahead due to funding gaps. Although it’s an expansion on an existing plant, to connect it to the Yukon Integrated System would require extensive transmission additions that make up a significant portion of costs and is more akin to a brand new, run-of-river facility. Also, it should be noted that the project was far more advanced than Moon Lake, which would likely see upward estimates of costs as it progressed.

Degradation Factor: 0%
Annual Energy: 31 GWh/yr
LCOE: $0.69/kWh
Discount Factor Sensitivity Analysis
Depending on the source of funding and ownership of each component in each scenario, the WACC is likely to change. To avoid claims of unfair discounting, I chose to make each discount factor the same in each scenario. 4.5% is a bit higher than the real WACC that YEC currently cites in its most recent General Rate Application (6.07% nominal WACC for 2027)f[8]. However, it is likely that the discount factor would be higher for a project with significant private funding. Another interesting piece of news is the Yukon Party’s recent announcement that, if elected, they will stop YEC from putting most of the newest capital projects on the ratebase and will instead fund it directly from the government. [10] Likely either with bonds or other direct government funding. I won’t argue for or against this approach, in spite of the significant sums of government money that has gone toward solar, but this would result in an even lower discount rate for any projects owned by YEC.
With that in mind, I have provided the LCOEs of each scenario based on small step-wise changes up and down in the discount rate for you to get a broader perspective on how that might change things.

As you can see, the numbers are significantly less favourable for solar than initially presented. It takes an unrealistically high 8% discount rate to make the Atlin Expansion breakeven with the Solar + Pumped Hydro scenario, benefitting from the slightly lower CapEx. Of course, this is just ONE scenario for solar where it meets the capacity gap by using pumped hydro.
There may indeed be a generation mix where solar plays a cost-effective part of the energy system without needing to invest in a large civil project like Moon Lake. But that requires significantly more advanced modelling, which we don’t have access to.
Analogous Modelling
People often point to modelling done for jurisdictions with entirely different contexts to our own. Such as highly interconnected grids in Europe or the US. These are not fit for purpose for our situation, as a highly isolated grid. Highly interconnected, continental scale grids are much better (i.e. more cost-effective) at integrating intermittent renewables. Because these resources are weather dependent and weather differs over vast stretches of land, as well as giving higher likelihood of being able to connect to jurisdictions with a wealth of clean, firm, and flexible resources like Quebec or Norway.
While we do not have publicly available Capacity Expansion or Production Cost Modelling for the Yukon, we do have some analogous resources to pull from. The one I will focus on is an NREL study from 2024 “Achieving an 80% Renewable Portfolio in Alaska’s Railbelt: Cost Analysis” [11]. The ‘Alaska Railbelt’ is an electrical grid that stretches from Fairbanks to the tip of the Kenai Peninsula. The reason this makes a good analogy to the Yukon Integrated System is it is a relatively small, isolated system in the far North. This study clearly demonstrates the modelling workflow that CEM and PCMs go through.

The system details generated by the CEM (types, capacities, and locations of transmission, renewable generation, and conventional generation), are passed to the PCM, along with hourly load and variable generation data and hourly operating reserve requirements. The PCM calculates operational costs and ensures that adequate reserves are maintained under the given set of weather and load conditions.
This type of simulation is an iterative process. The PCM provides necessary feedback to the CEM to determine more definitively if the built system can operate feasibly. If PLEXOS identifies unserved energy (i.e., load that the system is unable to serve) or other constraint violations (e.g., reserves shortages or hydro violations), the CEM can be refined to incorporate additional constraints or requirements, which directly impacts the resulting build decisions.
The intention of the study is to show two things 1) what is the cost to get to explicitly ‘80% renewable energy’ by 2040 (RPS Scenario) and 2) what is the least-cost generation mix in that same timeframe (Reference Scenario).
The results are quite interesting but before I get to that I will caveat a few important points:
- The ‘expandable’ resources fed into the model are: Solar PV, off-shore and on-shore wind, geothermal, run-of-river hydro, biomass and landfill gas, gas turbines and battery energy storage. Neither ‘conventional’ hydro nor pumped hydro is considered. Coal and internal combustion engines are also not considered.
- Investment Tax Credits are applied to Land-based Wind, PV, Geothermal, Run of River Hydro, and Batteries. While this may have been a fair representation as to the real costs paid by proponents at the time of writing the study, they are less relevant with the passage of the Big Beautiful Bill. They also result in costs that do not represent unsubsidized system wide costs.
- Although Alaska is a winter peaking jurisdiction, it only has ~14% of heating electrified [12], and the study does not forecast any additional electrified heating. In comparison, 25% of the Yukon is heated electrically as of 2023 with that number likely growing. [13] This means the winter peak in the Yukon is likely more pronounced and would require more firm or backup capacity.
- Alaska’s grid is powered primarily by fossil fuels with very little incumbent, low marginal cost legacy hydro. The Yukon would need very little extra capacity to remain at greater than 80% renewables.
- While the PCM will model hourly power flows and identify any unserved load, it does not identify stability issues such as voltage or frequency deficiencies. This is a third layer of modelling that is becoming increasingly necessary with high penetrations of renewables, for reasons mentioned previously. Mitigation of these sorts of disturbances can be costly and are not included in this model.
So, understanding that with these caveats, including that there are some key differences compared to the Yukon, we see something very interesting in the results of the ‘least cost mix’ (i.e. Reference case):

The model outputs a ‘least cost’ mix that is 76% renewable. But of those renewables, the vast majority is wind. Not solar. Why this is, in a far north jurisdiction should be intuitive to most. Wind output, while variable, is more closely aligned with demand. Given we are already 80%+ low marginal cost hydro, I have doubts that our least-cost mix would look anything like this, but any incremental intermittent renewables in that mix are likely to be wind, not solar.
This underscores the importance of evidence-based decision making. In my opinion, the policies of the last 6 years were ideologically motivated by politicians and bureaucrats caught in the global fever surrounding renewables and, in particular, solar. Very few of the bureaucrats I know working at Yukon Government have any sort of expertise in power systems. In energy? Sure. But those people think at a very macro level with timeframes of months and years, informed by economic models applied to extremely different jurisdictions. Not the hourly or minute-by-minute balancing of supply & demand, voltage, and frequency needed to assure a reliable and cost-effective power system.
Until that attitude shifts, we won’t be able to solve our energy problems here at home. The Yukon doesn’t need more slogans about ‘cheap’ solar. It needs serious modeling, local expertise, and the courage to face the real trade-offs of keeping the lights on in the North.
References
- Moon Lake Conceptual Study Report
- 28 April 2025 Blackout
- Intermittent Renewable Integration Study Yukon Integrated System
- System LCOE: What are the costs of variable renewables?
- Levelized Full System Costs of Electricity
- Shared Grid / Shared Benefits pre-feasibility benefits analysis
- Federal Government Funds Mayo B and Carmacks-Stewart Line
- 2025–2027 General Rate Application
- Atlin hydro expansion project is ‘shovel-ready,’ but still $86M short
- Yukon Party Pledges to Cut Power Rate Increase if Elected
- Achieving an 80% Renewable Portfolio in Alaska’s Railbelt: Cost Analysis
- State Profile and Energy Estimates — EIA
- Yukon Energy Facts 2023
메타데이터
- post_id
- 8ec2fcf73efc
- slug
- rising-energy-costs-is-solar-really-the-cheapest-energy-in-the-yukon-8ec2fcf73efc
- url
- https://medium.com/@philosophyofnuance/rising-energy-costs-is-solar-really-the-cheapest-energy-in-the-yukon-8ec2fcf73efc
- canonical_url
- https://medium.com/@philosophyofnuance/rising-energy-costs-is-solar-really-the-cheapest-energy-in-the-yukon-8ec2fcf73efc
- author_url
- https://medium.com/@philosophyofnuance
- status
- ok
- fetched_at
- 2026-07-17 00:53:25



