How I Automated My IT Performance Review Using Ticket Data and AI
No more blank-page anxiety. No more pivot tables. Just your data and a prompt chain.
How I Automated My IT Performance Review Using Ticket Data and AI
No more blank-page anxiety. No more pivot tables. Just your data and a prompt chain.
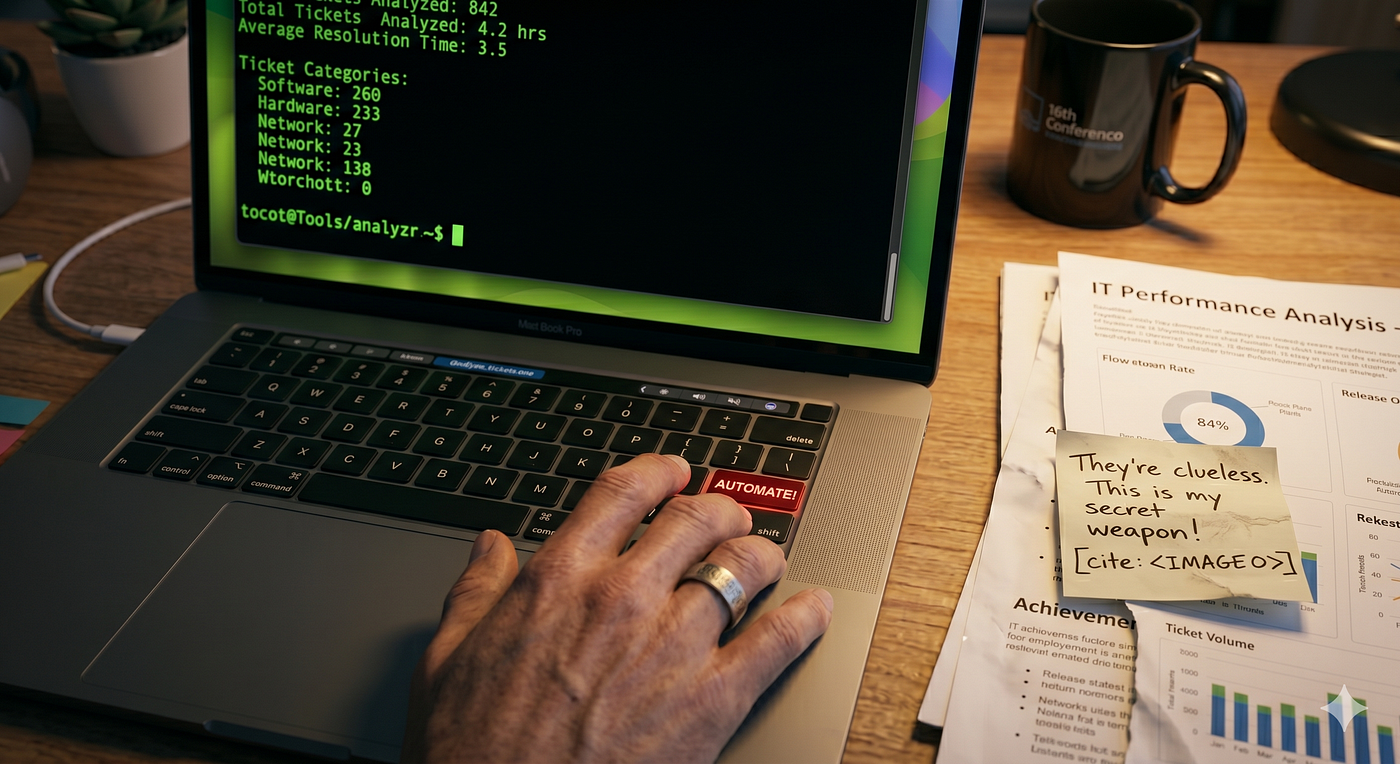
✨ AI Prompt: Photorealistic overhead shot of a cluttered work desk with laptop showing terminal output, printed performance documents, coffee cup, warm office lighting, cinematic mood
Every year, same story — performance review season hits and you’re staring at a blank doc, trying to reconstruct 12 months of work from memory. There had to be a better way.
Your ITSM tracks everything you did. It just wasn’t built to tell your story.
The Problem With Performance Reviews in IT
If you work in IT service desk or support, your work is highly measurable — ticket volume, resolution time, categories, deployments, unique users served. The data exists. The problem is where it lives.
ITSM platforms like ManageEngine, Jira, and ServiceNow are org-facing tools. Dashboards are built for managers and team leads, not individual contributors. When appraisal time comes, you’re left doing this:
- Export a CSV with 800+ rows
- Build pivot tables manually
- Dig through months of emails to remember what projects you contributed to
- Stare at your org’s appraisal template and try to fill it from memory
That’s hours of work, every cycle, producing a document that should’ve taken 30 minutes.
The Idea
The raw evidence already exists — it’s just scattered. Your ITSM ticket export has every resolution, every category, every timestamp. Your inbox has project threads, event support confirmations, training certificates.
The missing piece was a structured pipeline to pull it all together and turn it into something HR-ready.
That’s what I built: **it-eval-kit** — a local, config-driven Python toolkit + AI prompt chain that does exactly that.
How It Works
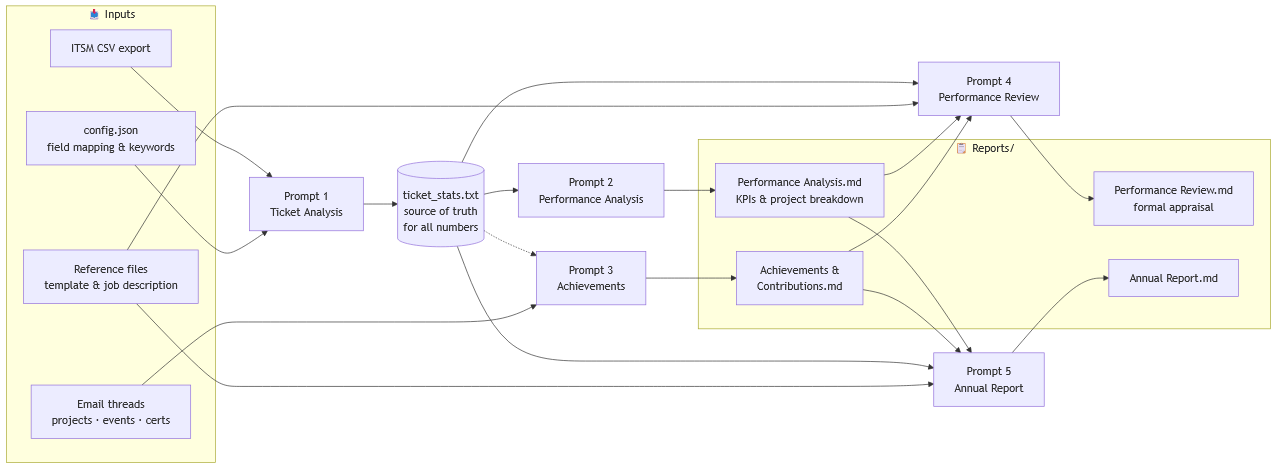
The pipeline has two stages: data extraction and report generation.
Stage 1 — Extract
python Tools/analyze_tickets.py Evidence/tickets/your-export.csvA config-driven Python script reads your CSV, maps your columns (subject, status, requester, created, resolved), classifies tickets by keyword patterns, and outputs a clean ticket_stats.txt — resolution rates, category breakdown, average resolution time, peak months, unique users. That file becomes the source of truth for all numbers downstream.
First time? Run setup.prompt.md in Copilot Agent chat — it reads your CSV and writes the config for you automatically.
Stage 2 — Generate
A numbered prompt chain in VS Code runs against your workspace files:
Prompt 1 → ticket_stats.txt
Prompt 2 → Performance Analysis.md
Prompt 3 → Achievements & Contributions.md
Prompt 4 → Performance Review.md
Prompt 5 → Annual Report.md
Each prompt reads the previous output. 0-orchestrator.prompt.md runs the whole sequence end-to-end — you just answer two questions at the start and let it run.
What You Get
Four ready-to-submit documents, generated from your actual data:
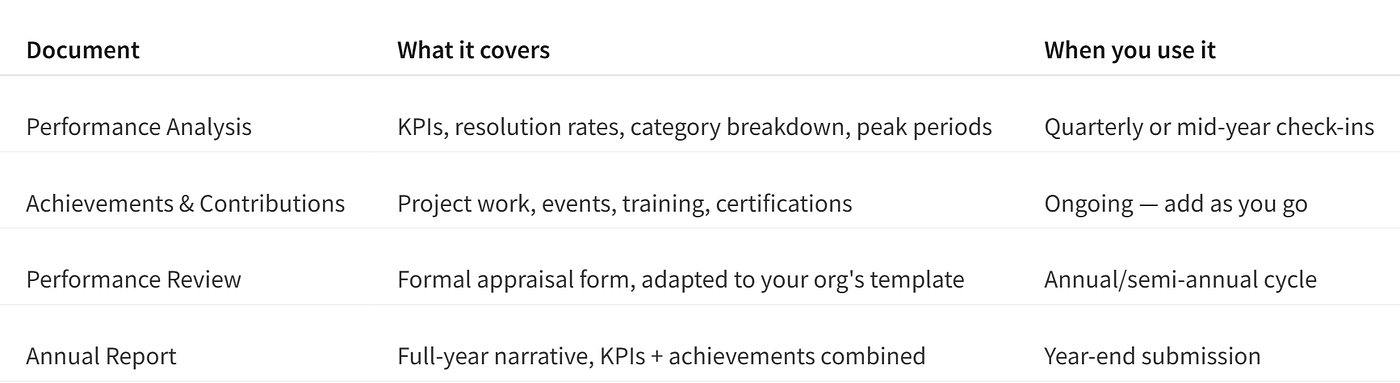
Prompts 4 and 5 support a supervisor mode — drafts the manager sections in third-person voice, which you can hand to your supervisor to review and sign off.
Works With What You Have
No need to change your tooling or request special access.
- ITSM: ManageEngine SDP, Jira Service Management, ServiceNow, Freshdesk — anything that exports CSV
- AI: GitHub Copilot (recommended), ChatGPT, Claude, Gemini — manual paste workflow documented for non-Copilot users
- No ticket data? The tool works on email evidence alone — useful if your role is mostly project or event-based
- Privacy: Runs 100% locally. Your ticket data, emails, and reference files are git-ignored by default. Nothing leaves your machine.
Get Started
git clone https://github.com/5a9awneh/it-eval-kit.git
cd it-eval-kit
python Tools/analyze_tickets.py Evidence/sample/sample_tickets.csv
Run the sample data first to verify everything works, then swap in your own CSV. Full setup docs in the README.
→ **github.com/5a9awneh/it-eval-kit**
Sample ticket_stats.txt output with resolution rates and category breakdown:
============================================================
  SERVICE DESK TICKET STATISTICS — Full Tenure
  Generated: 2026-04-03 21:19
============================================================

── OVERVIEW ─────────────────────────────────────────────
  Total tickets:          1,940
  Date range:             29 Aug 2024  →  01 Apr 2026
  Tenure months:          21
  Unique requesters:      470
  New system deployments: 156  (subject-keyword, closed/resolved)
  OS reformat operations: 47  (subject-keyword, closed/resolved)

── STATUS BREAKDOWN ─────────────────────────────────────
  Closed:                 1,861  (95.9%)
  Canceled:               51  (2.6%)
  Other/Open:             28  (1.4%)
  Resolution rate:        95.9%  (Closed / Total)

── RESPONSE / RESOLUTION TIMES ──────────────────────────
  Closed tickets timed:   1,861
  Median resolution time: 0.2 hours  (14 min)
  Average resolution:     9.7 hours
  Same-day (≤24h):        1,718  (92.3% of Closed)

── VOLUME PATTERNS ──────────────────────────────────────
  Monthly average:        92 tickets/month
  Peak month:             2025-07  (180 tickets)
  Peak quarter:           Q2 2025  (390 tickets)
  Peak day-of-week:       Sunday  (445 tickets)
  Peak hour:              10:00  (308 tickets)

── MONTHLY BREAKDOWN ────────────────────────────────────
  2024-08     1
  2024-09     5  █
  2024-10     5  █
  2024-11    88  █████████████████
  2024-12   116  ███████████████████████
  2025-01   126  █████████████████████████
  2025-02    28  █████
  2025-03    78  ███████████████
  2025-04   129  █████████████████████████
  2025-05   115  ███████████████████████
  2025-06   146  █████████████████████████████
  2025-07   180  ████████████████████████████████████
  2025-08    97  ███████████████████
  2025-09   104  ████████████████████
  2025-10   178  ███████████████████████████████████
  2025-11   106  █████████████████████
  2025-12    76  ███████████████
  2026-01   164  ████████████████████████████████
  2026-02   103  ████████████████████
  2026-03    85  █████████████████
  2026-04    10  ██

── QUARTERLY BREAKDOWN ──────────────────────────────────
  Q1 2025      232
  Q1 2026      352
  Q2 2025      390
  Q2 2026       10
  Q3 2024        6
  Q3 2025      381
  Q4 2024      209
  Q4 2025      360

── CATEGORY BREAKDOWN ───────────────────────────────────
  (Derived from subject-keyword analysis — CSV category field not used)
  Hardware                    593  (30.6%)
  Other                       367  (18.9%)
  Software/App                324  (16.7%)
  Printer/Scanner             290  (14.9%)
  Account/Access              224  (11.5%)
  Network/Connectivity         53  (2.7%)
  Email/Outlook                37  (1.9%)
  Formatting/OS                30  (1.5%)
  Setup/Config                 14  (0.7%)
  Security                      8  (0.4%)

── DAY-OF-WEEK DISTRIBUTION ─────────────────────────────
  Monday         411
  Tuesday        371
  Wednesday      362
  Thursday       338
  Friday          12
  Saturday         1
  Sunday         445

── HOURLY DISTRIBUTION ──────────────────────────────────
  00:00     1
  01:00     0
  02:00     1
  03:00     0
  04:00     0
  05:00     0
  06:00     1
  07:00    12  █
  08:00    73  ███████
  09:00   285  ████████████████████████████
  10:00   308  ██████████████████████████████
  11:00   299  █████████████████████████████
  12:00   304  ██████████████████████████████
  13:00   215  █████████████████████
  14:00   191  ███████████████████
  15:00   125  ████████████
  16:00    65  ██████
  17:00    26  ██
  18:00    14  █
  19:00     2
  20:00     7
  21:00     6
  22:00     3
  23:00     2
Your work is already documented. You just need the right pipeline to surface it.
메타데이터
- post_id
- 8f36817ddf38
- slug
- automate-it-performance-review-ticket-data-ai-8f36817ddf38
- url
- https://medium.com/@5a9awneh/automate-it-performance-review-ticket-data-ai-8f36817ddf38
- canonical_url
- https://medium.com/@5a9awneh/automate-it-performance-review-ticket-data-ai-8f36817ddf38
- author_url
- https://medium.com/@5a9awneh
- status
- ok
- fetched_at
- 2026-06-16 19:09:56