Exploring Winsorization and Trimming in R: A Data Cleaning Approach
Data cleaning is a crucial step in the data analysis process, ensuring that the data used for analysis is accurate and reliable. Outliers…
Exploring Winsorization and Trimming in R: A Data Cleaning Approach
Data cleaning is a crucial step in the data analysis process, ensuring that the data used for analysis is accurate and reliable. Outliers, or extreme values, can significantly impact statistical analyses. In this article, we’ll explore two approaches to handle outliers: Winsorization and Trimming.
The main objective is to demonstrate how Winsorization and Trimming can be applied to clean a dataset. We’ll focus on the ‘NOX’ variable from a dataset (click to access the dataset) containing air quality measurements in the year 2013.
The first step is to import our dataset and load the the necessary libraries i.e. in this case we will be using the robustHD and DescTools.
# Set the working directory (rem to change the path)
setwd("C:/Users/admin/documents/Desktop/Assessments")

# Load the required libraries
library(robustHD)
library(DescTools)

# Read the 2013 data
dat.exp <- read.csv("Data_2013.csv", header = TRUE, sep = ",")
Winsorization
Winsorization involves replacing extreme values in the dataset with more typical values. Let’s apply Winsorization to the ‘NOX’ variable.
# Create a data frame for the winsorized data
dat.win <- data.frame(winsorize(dat.exp), standardize = FALSE)
Trimming
Trimming removes outliers by cutting off the excessive tails of the distribution. We’ll trim at most 10% of the ‘NOX’ data.
# Create a data frame for the trimmed data
dat.trim <- data.frame(Trim(dat.exp$NOX, trim = 0.05))
Comparing the Distributions
Now, let’s compare the distribution properties of the three datasets.
# Set up the plotting area
par(mfrow=c(3,1))

# Boxplot for raw observed data
boxplot(dat.exp$NOX, col="red", main="Raw observed data", horizontal=TRUE, notch=TRUE, ylim=c(30,120))

# Boxplot for winsorized data
boxplot(dat.win$NOX, col="green", main="Winsorized data", horizontal=TRUE, notch=TRUE, ylim=c(30,120))

# Boxplot for trimmed data
boxplot(dat.trim$Trim.dat.exp.NOX..trim...0.05., col="blue", main="Trimmed data (at 10%)", horizontal=TRUE, notch=TRUE, ylim=c(30,120))
The output should be as follows;
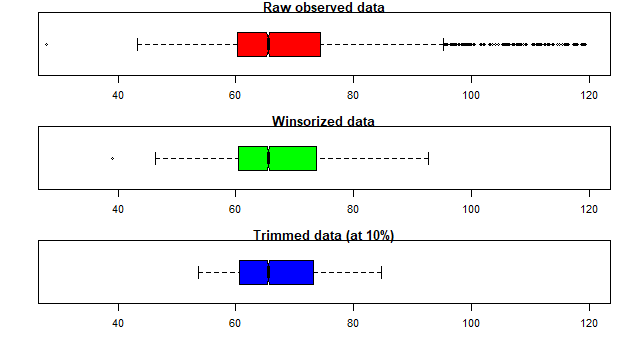
Figure 1: Comparison of NOX variable distributions before and after Winsorization and Trimming
Winsorization and Trimming are valuable techniques for handling outliers in your data. Depending on your specific analysis and dataset, choosing the right approach can lead to more robust and accurate results.
메타데이터
- post_id
- 8f54be7efbb3
- slug
- exploring-winsorization-and-trimming-in-r-a-data-cleaning-approach-8f54be7efbb3
- url
- https://medium.com/@cc_54801/exploring-winsorization-and-trimming-in-r-a-data-cleaning-approach-8f54be7efbb3
- canonical_url
- https://medium.com/@cc_54801/exploring-winsorization-and-trimming-in-r-a-data-cleaning-approach-8f54be7efbb3
- author_url
- https://medium.com/@cc_54801
- status
- ok
- fetched_at
- 2026-07-08 05:22:04