98.8% Performance Improvement on Spring Data R2DBC
Connection Pooling
98.8% Performance Improvement on Spring Data R2DBC
Connection Pooling
By default, spring-data-r2dbc opens a new connection for every incoming request, meaning the ConnectionFactory instructs Netty to establish a new TCP socket for each database interaction. This leads to several critical issues under load:
- Constant TCP handshakes: every request pays the full cost of connection establishment
- Port exhaustion under high concurrency: the OS runs out of available ports as sockets accumulate faster than they are released
With connection pooling, TCP sockets are kept alive up to a configured limit and reused across requests, drastically reducing handshake overhead and relieving pressure on the downstream database server.
It is worth noting that most production incidents related to database connectivity stem from relying on framework defaults for connection handling. In most frameworks, Spring Data included, connection pooling is not enabled by default, making it one of the most critical and frequently overlooked configurations before going to production.
Configuring Connection Pool on Spring Data R2DBC
This section shows you how to configure Connection Pooling on your spring-data-r2dbc application.
Note that this example is specific for PostgreSQL, but the steps should be very similar for any DBMS of your choice.
Spring Data Autoconfiguration
Spring provides an out-of-the-box configuration for connection pooling.
implementation 'org.springframework.boot:spring-boot-starter-data-r2dbc'
implementation 'org.postgresql:r2dbc-postgresql'
spring-boot-starter-data-r2dbc already includes r2dbc-pool as a transitive dependency, allowing you to set the following properties
spring.r2dbc.pool.enabled=true
spring.r2dbc.pool.initial-size=5
spring.r2dbc.pool.max-size=20
spring.r2dbc.pool.max-idle-time=30m
spring.r2dbc.pool.max-life-time=1h
spring.r2dbc.pool.max-acquire-time=10s
While this approach is simpler and sufficient for most cases, it comes with a trade-off, you lose granular control over driver-specific settings, such as Postgres session-level options like lock_timeout, transaction_timeout, and TCP keepalive tuning. For production applications that require fine-grained control over these settings, programmatic configuration is the recommended approach.
Programmatic Setup
When not relying on Spring Boot auto configuration, r2dbc-pool must be explicitly declared, as it exposes ConnectionPool — a ConnectionFactory sub-type responsible for managing the pool life-cycle:
implementation 'org.springframework.data:spring-data-r2dbc'
implementation 'org.postgresql:r2dbc-postgresql'
implementation 'io.r2dbc:r2dbc-pool'
With the required dependencies in place, connection pooling is configured by exposing a ConnectionPool bean:
    @Bean
    public ConnectionPool connectionFactory() {
        log.info("Initializing ConnectionFactory with Connection Pool");
        Map<String, String> options = new HashMap<>();

        // PostgreSQL options settings only configurable via programmatic setup
        options.put("lock_timeout", "10s");
        options.put("transaction_timeout", "40s");
        options.put("idle_in_transaction_session_timeout", "120s");
        options.put("tcp_keepalives_idle", "300s");
        options.put("tcp_keepalives_interval", "5s");
        options.put("client_connection_check_interval", "120s");

        ConnectionFactory connectionFactory =  new PostgresqlConnectionFactory(
                PostgresqlConnectionConfiguration
                        .builder()
                        .username(properties.user)
                        .password(properties.password)
                        .database(properties.name)
                        .host(properties.server.host)
                        .port(properties.server.port)
                        .options(options)
                        .build()
        );

        ConnectionPoolConfiguration poolConfiguration = ConnectionPoolConfiguration.builder()
                .connectionFactory(connectionFactory)
                .initialSize(16)
                .maxSize(32)
                .maxIdleTime(Duration.ofDays(1))
                .maxLifeTime(Duration.ofDays(3))
                .maxAcquireTime(Duration.ofSeconds(10))
                .build();

        return new ConnectionPool(poolConfiguration);
    }
The primary advantage of programmatic configuration is full control over both database-native settings , such as Postgres session-level options, and connection pool behaviour.
The bean returns a ConnectionPool instance built from a ConnectionPoolConfiguration, which holds a reference to the underlying PostgresqlConnectionFactory.
ConnectionPoolConfiguration exposes the following tuning parameters:
initialSize— the minimum number of connections opened at startupmaxSize— the maximum number of concurrent open connections in the poolmaxIdleTime— how long a connection can remain idle before being evictedmaxLifeTime— the maximum TTL of a connection regardless of activitymaxAcquireTime— the maximum time to wait when acquiring a connection from the pool before failing
Intenally, r2dbc-pool sits on top of Netty (the R2DBC Java driver transport layer), when R2DBC pool creates a new logic connection, it requests Netty to open a new TCP socket. When the pool keeps the connection idle (not emitting a close signal), Netty keeps the socket open too.
ConnectionPool is literally a wrapper around PostgresqlConnectionFactory , intercepting create() calls and deciding whether to reuse or delegate to Netty.
Pool Sizing
A totally fair, and common, question at this point is: “Where did those limits come from?” This section covers the reasoning behind pool sizing.
The main misconception when configuring a connection pool is assuming that more pooled connections means better performance. This is totally wrong.
Pooled connections, whether R2DBC or JDBC, should be thought of the same way as threads. If the number of pooled connections greatly exceeds the number of available CPU cores, context switching overhead will eventually degrade performance rather than improve it.
However, it is not as simple as setting pool size = CPU cores. When dealing with I/O operations, we must account for the time a connection spends idle, blocked and waiting for a response from the database. This is where the nature of blocking I/O changes the equation, while one connection is waiting for a response, the CPU core is free to process another. In this scenario, having more connections than CPU cores is actually beneficial.
The tipping point is the ratio of wait time to compute time. If connections spend little time waiting, increasing pool size introduces more context switching than it relieves, and performance drops.
As noted by Brett Wooldridge, creator of HikariCP:
“More threads only perform better when blocking creates opportunities for executing.”
The same source provides a PostgreSQL formula for determining an appropriate pool size:
connections = (core_count * 2) + effective_spindle_countWith 16 available CPU cores and a single disk spindle, this yields an ideal pool size of around 32 connections, which is the basis for the maxSize=32 configured earlier.Performance Testing
Performance Testing
Context
This is not a trivial endpoint , each request performs three distinct and non-negligible operations:
- Streaming file consumption: the incoming
CSVis consumed as a stream ofFilePartEvent, deserializing aFlux<DataBuffer>into domain objects reactively, introducing I/O wait at the HTTP layer; - Database persistence: the resulting domain objects are persisted to Postgres via
spring-data-r2dbc, introducing a second I/O wait at the database layer; - Response serialization: a
ServerResponseis assembled and returned to the caller;
Each request therefore has two distinct I/O blocking points, network I/O from the file upload and database I/O from the persistence, meaning connections spend a significant portion of their lifetime blocked and waiting, not consuming CPU.
This is precisely the workload profile where the HikariCP formula applies most effectively. With each file averaging 894 bytes, the serialization overhead is minimal, meaning the dominant cost per request is I/O wait, further justifying a pool size that exceeds the raw CPU core count.
In other words, this endpoint is a textbook case where a saturated pool of connections waiting on I/O outperforms a smaller pool of connections competing for CPU.
Load Test setup
Load testing was performed using K6, a developer-friendly tool for writing performance test scripts in JavaScript or TypeScript.
The test was configured with a staged ramp-up from 25 to 400 concurrent virtual users (VUs), simulating a real-world traffic spike rather than an immediate burst. Each virtual user introduces a randomized think time of 0.5s to 1.5s between requests, further approximating realistic user behaviour.
The following thresholds were defined as pass/fail criteria for the test:
- p95 response time must remain under 2s;
- p99 response time must remain under 5s;
- Error rate must stay below 1%;
import http from 'k6/http';
import { sleep, check } from 'k6';
import { Trend, Rate, Counter } from 'k6/metrics';
import { FormData } from 'https://jslib.k6.io/formdata/0.0.2/index.js';

// Custom metrics
const responseTrend = new Trend('response_time');
const errorRate = new Rate('error_rate');
const requestCounter = new Counter('total_requests');

export const options = {
    stages: [
        { duration: '30s', target: 85 },   // ramp up to 85 VUs
        { duration: '1m',  target: 85 },   // hold 85 VUs - baseline
        { duration: '30s', target: 200 },  // ramp up to 200 VUs
        { duration: '2m',  target: 300 },  // ramp up to 300 VUs - stress
        { duration: '30s', target: 400 },  // ramp up to 400 VUs - peak
        { duration: '1m',  target: 400 },  // hold peak
        { duration: '30s', target: 0 },    // ramp down
    ],
    thresholds: {
        // 95% of requests must complete under 2s
        http_req_duration: ['p(95)<2000'],
        // 99% under 5s
        'http_req_duration': ['p(99)<5000'],
        // Error rate must stay below 1%
        error_rate: ['rate<0.01'],
    },
};

const csvFile = open('statement.csv');

export default function () {
    const url = 'http://localhost:8089/v1/statement';
    const fd = new FormData();

    fd.append('csv', http.file(csvFile, 'statement.csv', 'text/csv'));

    const res = http.post(url,
        fd.body(),
        {
            headers: { 'Content-Type': 'multipart/form-data; boundary=' + fd.boundary },
            timeout: '30s',
        }
    );

    // Track custom metrics
    responseTrend.add(res.timings.duration);
    requestCounter.add(1);

    const success = check(res, {
        'is status 201': (r) => r.status === 201,
        'response time < 4s': (r) => r.timings.duration < 4000,
    });

    errorRate.add(!success);

    // Realistic think time between requests (0.5s to 1.5s)
    sleep(Math.random() * 1 + 0.5);
}
Note: When evaluating performance without connection pooling, the maximum VU count had to be reduced to 50 to prevent the application from crashing under load. This limitation itself is a strong indicator of how critical connection pooling is, the unpooled configuration could not sustain the same concurrency level required for a meaningful comparison.
Without Connection Pooling
Without connection pooling was observed:
- Error rate at 17.11%, meaning roughly 1 in 6 requests failed;
- Of 5.913 requests attempted, over 1.000 ended in failure, with 16.99% resulting in HTTP errors;
- p99 of 3.08 seconds, and average latency of 751ms;
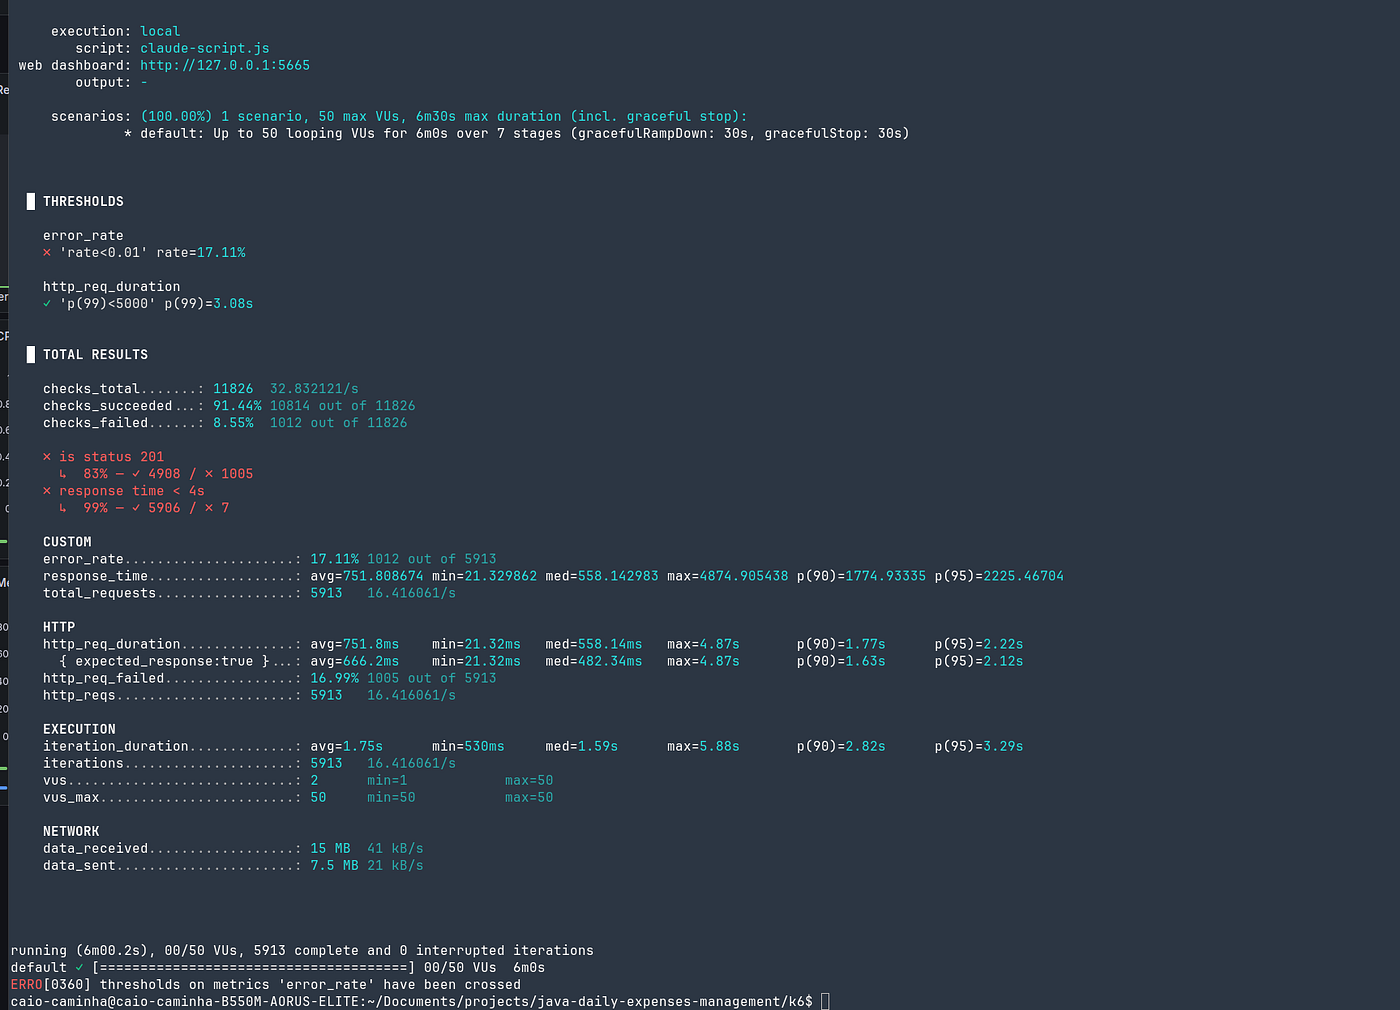
Application container logs provided a definitive confirmation of the root cause. Under load, the following error was repeatedly emitted by ReactorNettyClient:
sorry, too many clients alreadyThis is a Postgres server-side rejection, thrown when the number of open connections exceeds its configured max_connections limit. Seeing this error in the context of an unpooled setup proves the earlier statement concretely, without connection pooling, every incoming request translates directly into a new TCP socket opened against Postgres, with no reuse whatsoever. Under sufficient concurrency, this inevitably saturates the database server and causes it to reject connections entirely, which is precisely what the 16.99% HTTP failure rate reflected in the load test results.

Postgres container logs confirmed what was previously stated, [14647] FATAL: sorry, too many clients already being logged.

Analysing CPU and Memory usage metrics we can observe that CPU usage had a spike of 1 CPU core (maximum available) and memory usage went up to 58mb.

Another interesting metric to observe is Garbage Collection CPU time. As the number of open connections grew unbounded, heap memory consumption increased alongside it, triggering significantly more GC rounds. Each GC round introduces a pause in application execution, which directly impacts response time and explains part of the latency degradation observed in the unpooled results.

With Connection Pooling
The following test was performed against the pooled version of the application using the exact same parameters as the unpooled test (50 VUs) to ensure a fair and direct comparison.

From a direct comparison at identical concurrency (50 VUs), we can observe:
- Error rate dropped from 17.11% to 0%, with HTTP failures following the same pattern — from 16.99% to zero
- Throughput increased by 88% at identical concurrency, going from 16.4 req/s to 30.9 req/s
- Completed iterations increased by 88%, from 5,913 to 11,147
- Average latency dropped from 751ms to 8.76ms — an improvement of 98.8%
- p99 latency improved by 99.1%, dropping from 3.08s to just 27.69ms
When analyzing memory and CPU consumption:

When analyzing memory and CPU consumption, the application remained well within healthy bounds throughout the entire test, CPU usage peaked at 0.47 units (47% of available CPU), while heap memory stayed stable around 50.01MB, showing no signs of unbounded growth.
GC CPU time also saw a significant improvement:

GC CPU time dropped from 0.1 to 0.0104, a reduction of 89.6%, or 9.6x less GC pressure.
This aligns directly with the latency results. Without pooling, the application was constantly creating and destroying connection objects on every request, putting continuous pressure on the GC to clean them up. With pooling, connections are reused, meaning far fewer objects are allocated and collected, resulting in fewer GC rounds, shorter pauses, and a more stable and predictable response time.
Further comparison
With connection pooling enabled, the application scaled up to 400 VUs — 8x more concurrent users than the unpooled test could sustain. The results were significant:
- Throughput increased by 450%, purely from enabling connection pooling, with no other changes to the application
- Error rate dropped from 17.11% to 0.82%, with zero HTTP-level failures; the remaining errors were exclusively requests that exceeded the 4 second response time threshold
- Completed iterations increased from 5,913 to 32,584, a 451% increase in the amount of work the application was able to handle

Note: The higher latency observed in this test is expected , it was run under significantly higher concurrency (up to 400 VUs) compared to the 50 VUs used in the unpooled test. The comparison is not about absolute latency numbers, but about stability, error rate, and throughput under load.
Conclusion
The results make a compelling case. The initial average latency of 751ms was almost entirely attributable to TCP handshake overhead, dropping to just 8.76ms after enabling connection pooling, with no other changes to the application. A 98.8% reduction in average latency from a single configuration change.
As stated earlier, connection pooling is not an optional optimization — it is a baseline requirement for any production-ready application. The data speaks for itself.
Reference
- https://github.com/brettwooldridge/HikariCP/wiki/About-Pool-Sizing#connections--core_count--2--effective_spindle_count
- https://dev.to/kamalhm/configuring-connection-pooling-with-spring-r2dbc-ho6
- https://docs.spring.io/spring-framework/reference/data-access/r2dbc.html#r2dbc-ConnectionFactory
- https://www.postgresql.org/docs/7.4/jdbc-datasource.html
메타데이터
- post_id
- 90fe19fb8a8b
- slug
- 98-8-performance-improvement-on-spring-data-r2dbc-90fe19fb8a8b
- url
- https://medium.com/@caminhacaiopro/98-8-performance-improvement-on-spring-data-r2dbc-90fe19fb8a8b
- canonical_url
- https://medium.com/@caminhacaiopro/98-8-performance-improvement-on-spring-data-r2dbc-90fe19fb8a8b
- author_url
- https://medium.com/@caminhacaiopro
- status
- ok
- fetched_at
- 2026-07-10 03:02:36




