Unveiling Data Insights in R: A Deep Dive into Exploratory Data Analysis (EDA) Techniques
Welcome to the fourteenth part of our “R Journey: From Beginner to Data Explorer” series! In the world of data science, EDA is the first…
Unveiling Data Insights in R: A Deep Dive into Exploratory Data Analysis (EDA) Techniques
Welcome to the fourteenth part of our “R Journey: From Beginner to Data Explorer” series! In the world of data science, EDA is the first step towards understanding the intrinsic nature of datasets. Through this blog post, we’ll explore an array of EDA techniques that empower data scientists and analysts to extract meaningful insights, detect patterns, and validate assumptions from datasets. Join us as we navigate through the intricacies of EDA with practical examples and detailed explanations.
Understanding Exploratory Data Analysis (EDA):
Exploratory Data Analysis (EDA) is a critical process that involves probing, visualizing, and summarizing datasets to glean insights into their underlying structure and characteristics. By scrutinizing data distributions, relationships, and anomalies, EDA aids in forming hypotheses and directing subsequent analyses.
Exploring Key EDA Techniques:
Let’s delve into a variety of EDA techniques and methods commonly used by data professionals:
- Summary Statistics: Deriving measures of central tendency and dispersion like mean, median, mode, standard deviation, and range offers a comprehensive overview of numerical variables within the dataset.
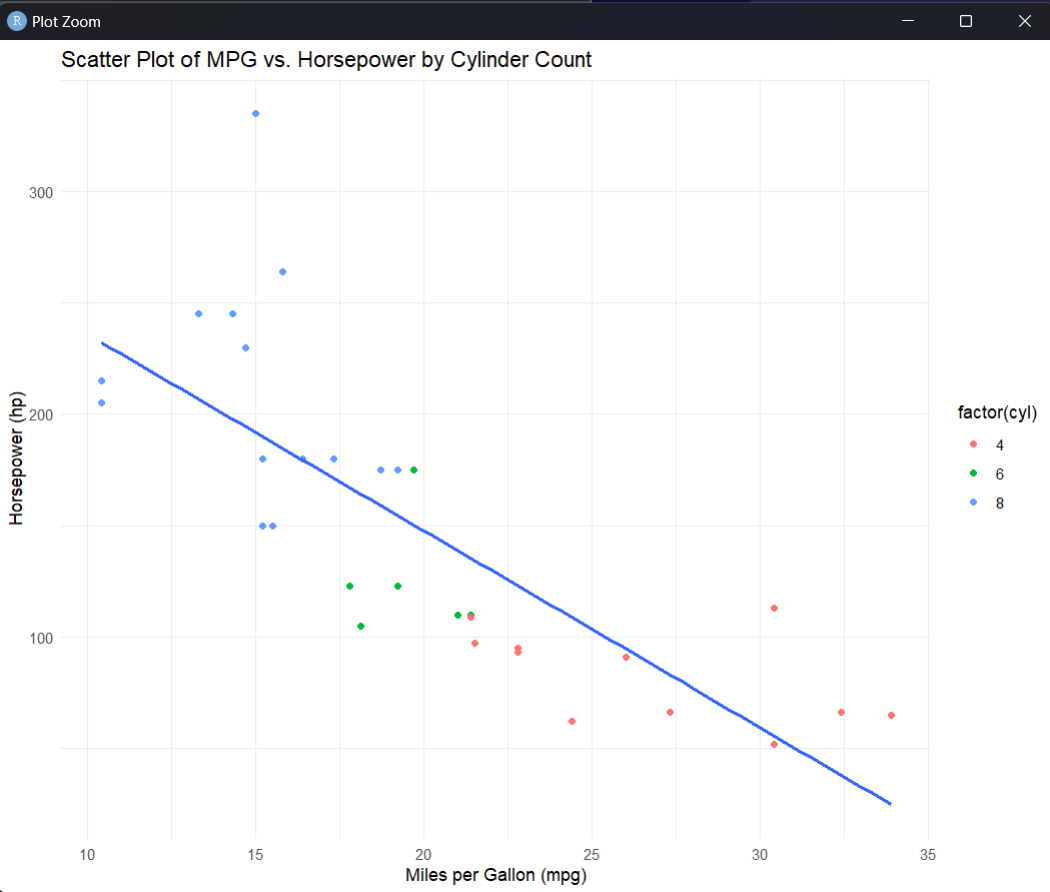
- Data Visualization: Utilizing graphical representations such as histograms, box plots, scatter plots, and heatmaps facilitates the identification of trends, outliers, and patterns within the data.
- Correlation Analysis: Assessing correlations between numerical variables provides insights into their interdependence and aids in identifying potential relationships for further investigation.
- Outlier Detection: Employing techniques like box plots, z-score analysis, and isolation forests helps in identifying and understanding outliers, which may signify anomalies or errors in the data.
- Missing Values Analysis: Scrutinizing missing values and their patterns aids in understanding data completeness and informs decisions regarding imputation or handling strategies.
- Distribution Analysis: Examining the distributions of numerical variables reveals information about their skewness, kurtosis, and adherence to specific probability distributions.
- Categorical Variable Exploration: Analyzing categorical variables through frequency distributions, bar plots, and chi-square tests offers insights into their distribution and association with other variables.
- Time Series Analysis: For temporal datasets, time series analysis techniques such as trend analysis, seasonality detection, and autocorrelation analysis provide valuable insights into patterns and trends over time.
Examples of EDA Techniques:
Let’s explore practical examples showcasing the application of various EDA techniques:
- Summary Statistics:
# Load library
library(dplyr)

# Use mtcars dataset
mtcars_summary <- mtcars %>%
  reframe(avg_mpg = mean(mpg),  # Mean of miles per gallon
          median_hp = median(hp),   # Median of horsepower
          mode_cyl = mode(cyl),     # Mode of number of cylinders (may not be unique)
          sd_disp = sd(disp),        # Standard deviation of displacement
          range_wt = range(wt))      # Range of weight

print(mtcars_summary)
- Data Visualization:
# Load libraries
library(ggplot2)

# Histogram of mpg
ggplot(mtcars, aes(x = mpg)) +
  geom_histogram(bins = 10, color = "lightblue") +
  labs(title = "Distribution of Miles Per Gallon (MPG)", x = "MPG", y = "Frequency")
- Correlation Analysis:
# Correlation matrix
cor(mtcars[, c("mpg", "disp", "hp", "drat", "wt", "qsec", "vs", "am", "gear", "carb")])
- Outlier Detection:
# Create a boxplot for mpg
ggplot(mtcars, aes(x = "", y = mpg)) +
  geom_boxplot() +
  labs(title = "Boxplot of MPG in mtcars Dataset") +
  theme_minimal()

# Z-score analysis for mpg
z_scores <- scale(mtcars$mpg)
outliers <- which(abs(z_scores) > 2)

# Print outliers
print(mtcars[outliers, ])

- Missing Values Analysis:
# Check for missing values
summary(is.na(mtcars))
- Distribution Analysis:
# Create a density plot for mpg
ggplot(mtcars, aes(x = mpg)) +
  geom_density(fill = "skyblue", color = "blue") +
  labs(title = "Density Plot of MPG in mtcars Dataset", x = "MPG") +
  theme_minimal()
- Categorical Variable Exploration:
# Convert cyl to a factor to treat it as a categorical variable
mtcars$cyl <- factor(mtcars$cyl)

# Create a bar plot for the distribution of cylinders
ggplot(mtcars, aes(x = cyl)) +
  geom_bar(fill = "skyblue", color = "blue") +
  labs(title = "Distribution of Cylinders in mtcars Dataset", x = "Number of Cylinders") +
  theme_minimal()
- Time Series Analysis:
# Load the economics dataset
data(economics)

# Create a time series plot for personal consumption expenditures (PCE)
ggplot(economics, aes(x = date, y = pce)) +
  geom_line(color = "blue") +
  labs(title = "Time Series Plot of Personal Consumption Expenditures", x = "Date", y = "PCE") +
  theme_minimal()
Conclusion:
Exploratory Data Analysis (EDA) serves as a crucial foundation for data-driven decision-making, enabling data scientists and analysts to unearth insights and understand the nuances of the datasets they work with. By leveraging a diverse array of EDA techniques, practitioners can unravel hidden patterns, validate assumptions, and derive actionable insights that drive impactful decisions. As we embark on our data analysis journey, remember that EDA is not merely a preliminary step but a continuous process that fosters deeper understanding and informs subsequent analyses. In the next installment, we will be working on an real-world dataset for solidifying our knowledge about data analysis. Happy Coding!
메타데이터
- post_id
- 91787e27ca26
- slug
- unveiling-data-insights-in-r-a-deep-dive-into-exploratory-data-analysis-eda-techniques-91787e27ca26
- url
- https://medium.com/@kuckianc/unveiling-data-insights-in-r-a-deep-dive-into-exploratory-data-analysis-eda-techniques-91787e27ca26
- canonical_url
- https://medium.com/@kuckianc/unveiling-data-insights-in-r-a-deep-dive-into-exploratory-data-analysis-eda-techniques-91787e27ca26
- author_url
- https://medium.com/@kuckianc
- status
- ok
- fetched_at
- 2026-07-24 07:01:26