Moving Average Crossover Strategy: Does It Really Work? A Complete Trading Guide
Introduction
Moving Average Crossover Strategy: Does It Really Work? A Complete Trading Guide
Moving Average Crossover
Introduction
Technical analysis offers traders numerous tools for identifying market trends and potential trading opportunities. Among these tools, the Moving Average Crossover Strategy remains one of the most popular and widely used methods across stocks, forex, commodities, cryptocurrencies, and indices.
Many traders consider moving average crossovers a simple yet effective way to identify trend changes and generate buy or sell signals. The strategy has existed for decades and continues to be used by retail traders, institutional investors, and algorithmic trading systems.
However, an important question remains: Does the Moving Average Crossover Strategy really work?
The answer is not as straightforward as many trading courses and social media influencers suggest. While moving average crossovers can help traders identify trends, they also have limitations that can lead to false signals and losses during certain market conditions.
This comprehensive guide explores the history of moving averages, explains how crossover strategies function, examines their strengths and weaknesses, discusses practical applications, and evaluates whether this classic technical analysis technique still works in modern financial markets.
What Is a Moving Average?
Before understanding crossover strategies, traders must understand moving averages themselves.
A moving average is a technical indicator that smooths price data over a specified period.
Instead of focusing on daily price fluctuations, moving averages provide a clearer picture of the overall market direction.
The primary objective is to reduce market noise and reveal underlying trends.
Common moving averages include:
- 10-period Moving Average
- 20-period Moving Average
- 50-period Moving Average
- 100-period Moving Average
- 200-period Moving Average
Each moving average reflects a different market perspective.
Shorter averages respond quickly to price changes, while longer averages react more slowly.
The History and Evolution of Moving Average Analysis
Early Market Analysis
Long before modern trading platforms existed, traders searched for methods to identify trends and avoid emotional decision-making.
Market participants recognized that price movements often followed broader trends despite short-term volatility.
This observation led to the development of averaging techniques.
Introduction of Moving Averages
As charting methods improved during the twentieth century, analysts began using moving averages to smooth price fluctuations.
The indicator quickly gained popularity because of its simplicity and effectiveness.
Unlike complex mathematical models, moving averages were easy to calculate and understand.
Computerized Trading Era
The rise of personal computers transformed technical analysis.
Traders could now:
- Calculate moving averages instantly
- Analyze multiple markets
- Test trading strategies
- Automate signal generation
Moving average crossover systems became increasingly popular during this period.
Algorithmic Trading and AI
Today, sophisticated trading systems continue to use moving averages as foundational components.
Modern AI-driven platforms combine moving averages with:
- Machine learning
- Pattern recognition
- Volatility analysis
- Predictive modeling
Despite technological advances, moving averages remain relevant because they effectively capture market trends.
Understanding the Moving Average Crossover Strategy
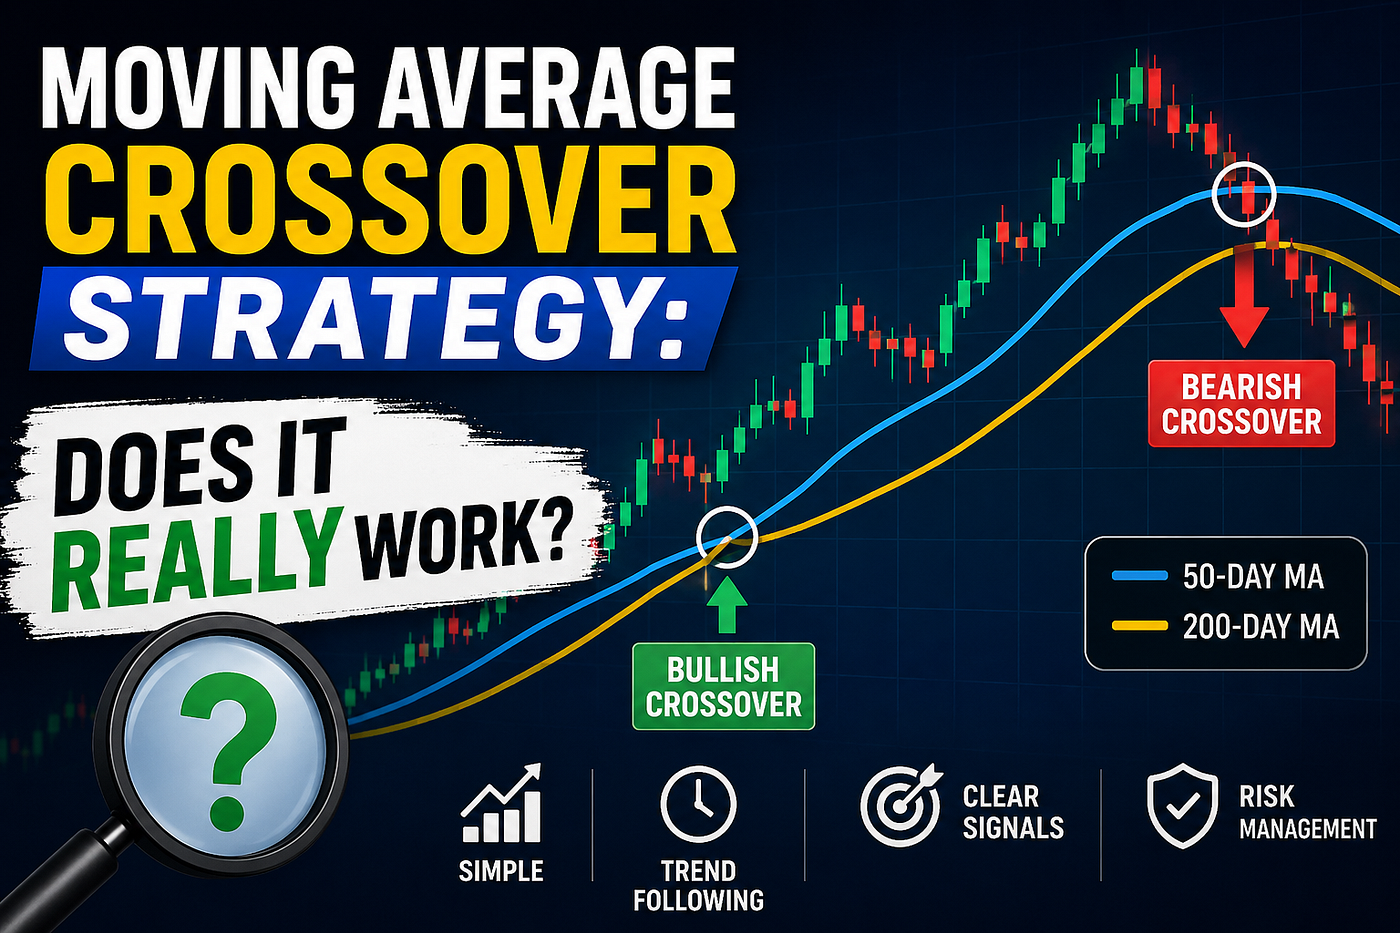
A moving average crossover occurs when two moving averages intersect.
Typically, traders use:
- A short-term moving average
- A long-term moving average
The crossover generates potential trading signals.
Types of Moving Average Crossovers
Bullish Crossover
A bullish crossover occurs when the shorter moving average rises above the longer moving average.
This event suggests increasing upward momentum.
Many traders interpret it as a buy signal.
Example
- 50-day moving average crosses above 200-day moving average
This pattern is commonly known as the Golden Cross.
Bearish Crossover
A bearish crossover occurs when the shorter moving average falls below the longer moving average.
This suggests weakening momentum.
Many traders interpret it as a sell signal.
Example
- 50-day moving average crosses below 200-day moving average
This pattern is commonly known as the Death Cross.
Why the Moving Average Crossover Strategy Works
The strategy works because trends are among the most persistent characteristics of financial markets.
Markets often move in sustained directions due to:
- Economic growth
- Interest rate changes
- Corporate earnings
- Investor sentiment
- Institutional buying and selling
Moving averages help traders stay aligned with these trends.
Instead of predicting market direction, crossover strategies react to confirmed trend changes.
Popular Moving Average Crossover Combinations
5-Day and 20-Day Crossover
Often used by short-term traders.
Characteristics include:
- Fast signals
- Higher frequency trades
- Increased risk of false signals
10-Day and 50-Day Crossover
Suitable for swing traders.
Benefits include:
- Better trend confirmation
- Reduced noise
- Balanced responsiveness
50-Day and 200-Day Crossover
One of the most widely followed combinations.
Advantages include:
- Long-term trend identification
- Institutional relevance
- Stronger signals
The Golden Cross and Death Cross use this setup.
The Core Logic Behind Moving Average Crossovers
The strategy relies on momentum shifts.
When short-term prices rise faster than long-term prices, momentum strengthens.
This causes the short moving average to cross above the long moving average.
Similarly, weakening momentum creates bearish crossovers.
The crossover serves as visual confirmation that market conditions may be changing.
Moving Average Crossover Strategy in Technical Analysis
The Moving Average Crossover Strategy is considered a trend-following system.
Trend-following strategies aim to:
- Capture major market moves
- Stay invested during trends
- Avoid emotional trading decisions
Rather than buying bottoms or selling tops, crossover traders attempt to participate in the middle portion of a trend.
Although this approach sacrifices perfect entries, it often improves consistency.
Advantages of the Moving Average Crossover Strategy
Simplicity
One of the biggest strengths is simplicity.
Even beginner traders can understand crossover signals quickly.
Objective Decision Making
The strategy removes much of the emotional element from trading.
Signals are generated through predefined rules.
Trend Identification
Moving averages excel during trending markets.
They help traders:
- Stay aligned with momentum
- Avoid premature exits
- Filter short-term noise
Versatility
The strategy works across:
- Stocks
- Forex
- Commodities
- Cryptocurrencies
- Exchange-traded funds
Limitations of the Moving Average Crossover Strategy
Despite its popularity, the strategy is not perfect.
Lagging Nature
Moving averages rely on historical prices.
As a result, signals occur after trends have already begun.
This delay can reduce profits.
False Signals in Sideways Markets
Range-bound markets create frequent crossovers.
These false signals can produce multiple losing trades.
This phenomenon is known as whipsaw trading.
Late Exits
The same lag that delays entries also delays exits.
Traders may surrender profits before receiving a sell signal.
Not a Standalone System
Successful traders often combine moving averages with other tools.
Using crossovers alone can lead to inconsistent performance.
How Traders Improve Moving Average Crossover Accuracy
Combine with Volume Analysis
Volume helps confirm breakout strength.
Higher volume often increases signal reliability.
Use Support and Resistance Levels
Support and resistance provide context for crossover signals.
Crossovers occurring near major technical levels tend to be more meaningful.
Add Momentum Indicators
Many traders combine moving averages with:
- RSI
- MACD
- Stochastic Oscillator
These indicators provide additional confirmation.
Apply Multi-Timeframe Analysis
Analyzing multiple timeframes reduces the risk of false signals.
For example:
- Weekly trend confirmation
- Daily crossover entry
This approach strengthens decision-making.
Golden Cross vs Death Cross
Two crossover patterns attract significant market attention.
Golden Cross
The Golden Cross occurs when:
- 50-day moving average rises above 200-day moving average
This pattern often signals:
- Long-term bullish momentum
- Increased investor confidence
- Potential trend continuation
Death Cross
The Death Cross occurs when:
- 50-day moving average falls below 200-day moving average
This pattern often signals:
- Long-term bearish momentum
- Weakening market conditions
- Increased selling pressure
Although neither pattern guarantees future performance, both are widely monitored by institutional investors.
Does the Moving Average Crossover Strategy Really Work?
The answer depends on market conditions.
When It Works Well
Moving average crossovers perform best during:
- Strong bull markets
- Strong bear markets
- Sustained trends
- Momentum-driven environments
In these situations, the strategy can capture substantial portions of major moves.
When It Struggles
Performance often declines during:
- Sideways markets
- Low-volatility environments
- Choppy price action
Frequent false signals may reduce profitability.
The Reality
The strategy does not predict future prices.
Instead, it helps traders:
- Follow trends
- Reduce emotional decisions
- Maintain trading discipline
Used properly, it can be effective.
Used blindly, it can become costly.
Modern Applications of AI and Moving Average Strategies
Artificial intelligence is transforming technical analysis.
Automated Signal Detection
AI systems monitor thousands of assets simultaneously.
They identify:
- Bullish crossovers
- Bearish crossovers
- Trend acceleration
within seconds.
Machine Learning Models
Modern algorithms evaluate:
- Historical crossover performance
- Market volatility
- Volume behavior
- Economic conditions
to improve signal quality.
Smart Trade Management
AI platforms assist with:
- Position sizing
- Stop-loss placement
- Risk management
- Profit target optimization
Predictive Analytics
Advanced systems estimate probabilities for:
- Trend continuation
- Trend reversal
- Breakout strength
This provides traders with deeper market insights.
Best Practices for Using Moving Average Crossovers
To maximize effectiveness:
Focus on Trending Markets
The strategy performs best when clear trends exist.
Avoid Overtrading
Not every crossover deserves action.
Wait for high-quality setups.
Use Proper Risk Management
Every trade should include:
- Stop-loss rules
- Position sizing
- Risk-reward analysis
Keep Expectations Realistic
No strategy wins every trade.
Consistency matters more than perfection.
Backtest Your Approach
Historical testing helps traders understand:
- Strengths
- Weaknesses
- Market suitability
before risking capital.
Why Moving Average Crossovers Remain Relevant
Despite newer indicators and AI-driven tools, moving average crossovers remain popular because they:
- Simplify trend analysis
- Provide objective signals
- Adapt to different markets
- Support disciplined trading
Their longevity demonstrates the enduring value of trend-following principles.
Conclusion
The Moving Average Crossover Strategy remains one of the most effective and widely recognized methods for identifying market trends. While it is not a perfect system, it provides traders with a structured framework for recognizing momentum shifts and participating in larger market movements.
The strategy works best during strong trends and performs less effectively during sideways conditions. Therefore, successful traders often combine moving average crossovers with volume analysis, support and resistance levels, momentum indicators, and sound risk management practices.
Modern AI-powered trading platforms continue to enhance crossover analysis through automation, machine learning, and predictive insights. However, the core principle remains unchanged: follow the trend while managing risk effectively.
For traders seeking a straightforward yet powerful technical analysis approach, moving average crossovers remain a valuable tool in today’s financial markets.
메타데이터
- post_id
- 9180a2fd8aab
- slug
- moving-average-crossover-strategy-does-it-really-work-a-complete-trading-guide-9180a2fd8aab
- url
- https://medium.com/@astroduniaaatech_41204/moving-average-crossover-strategy-does-it-really-work-a-complete-trading-guide-9180a2fd8aab
- canonical_url
- https://medium.com/@astroduniaaatech_41204/moving-average-crossover-strategy-does-it-really-work-a-complete-trading-guide-9180a2fd8aab
- author_url
- https://medium.com/@astroduniaaatech_41204
- status
- ok
- fetched_at
- 2026-06-09 15:37:30