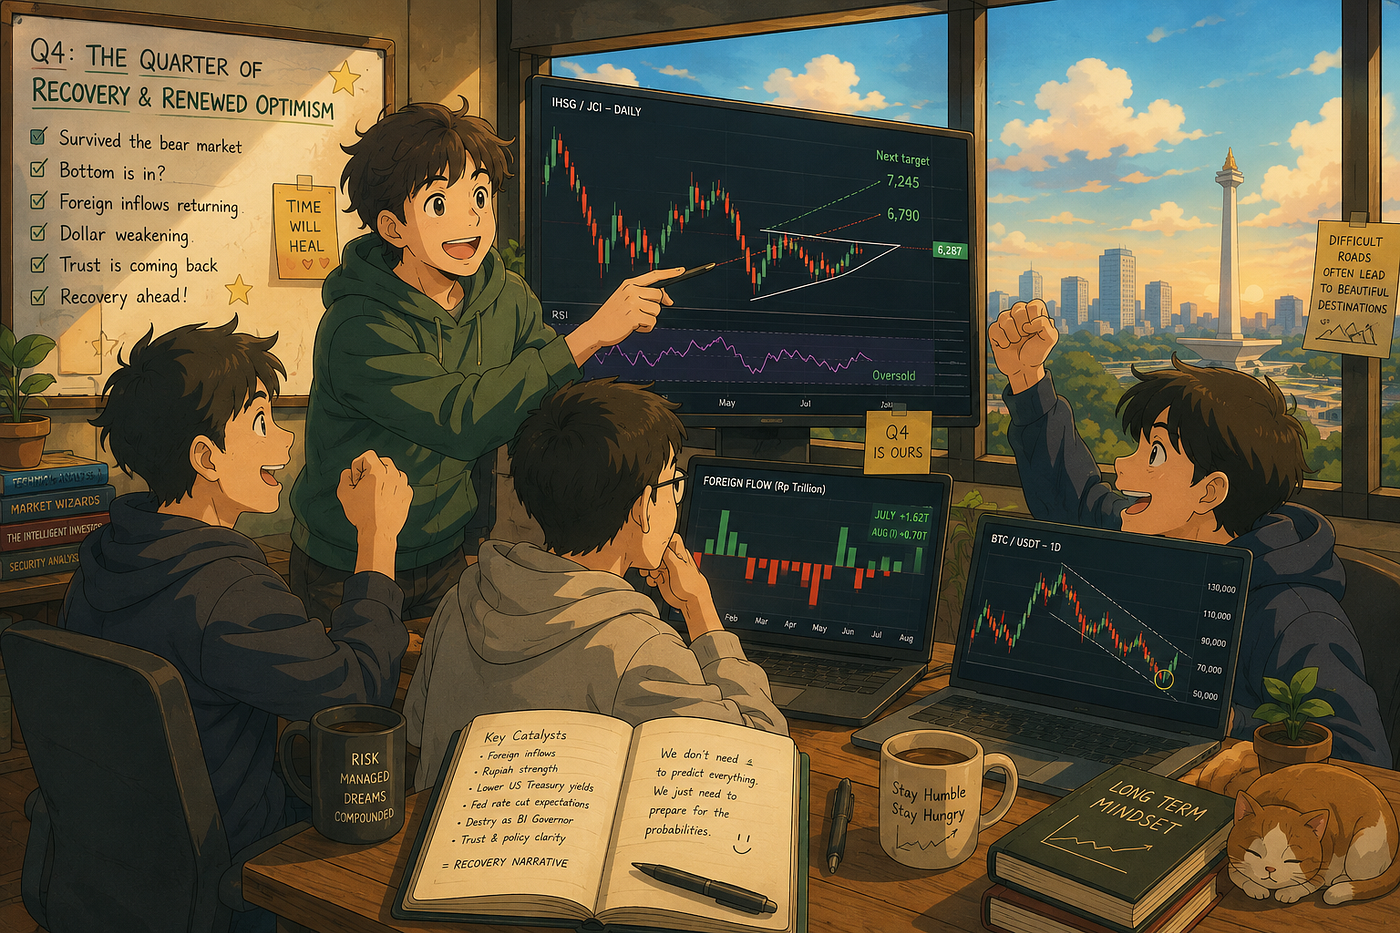
Indonesia and the dumb self-fulfilling prophecy
Sometimes markets fall not because they are weak, but because everyone slowly loses faith
Indonesia and the dumb self-fulfilling prophecy
Sometimes markets fall not because they are weak, but because everyone slowly loses faith
As it turned out, 2026 became a painful year for Indonesian stock traders.
![Illustration of the IDR weakening against the USD [Generated by ChatGPT]](https://miro.medium.com/v2/resize:fit:1400/1*3a-EYpNbCnTRdfUpTn3-6w.png)
Illustration of the IDR weakening against the USD [Generated by ChatGPT]
At the beginning of 2026, I casually charted the market and sent the analysis to a few of my trader friends. Half-jokingly, and with a skeptical tone, I told them: “What if Indonesia is actually just beginning a full bear market wave starting from now?”.


Captured via Stockbit on 27 Feb 2026 (left); via TradingView on 4 Mar 2026 (right)
The idea initially came from a simple observation: the Bitcoin cycle had already begun slipping into a bear market, while Gold looked heavily overbought, conditions that often signal rising fear and weakening risk appetite across broader markets, with worsening global conditions slowly dragging Indonesia into the same pressure.
At the time, it sounded almost impossible.
The Indonesian stock market (IHSG) was still riding a strong wave of euphoria, fueled by speculation around conglomerate-related stocks that were expected to enter the MSCI Index. Throughout 2025, many of these conglomerate-linked names, along with highly speculative “gorengan” stocks carrying similar narratives, experienced an almost parabolic rally.
Still, the idea never felt entirely invalid to me. It felt more like a pile of gasoline waiting for the smallest spark.
Global macro conditions were already showing signs of strain. At the same time, geopolitical tensions between Iran and the United States continued escalating, eventually forcing the closure of the Strait of Hormuz and sending global oil prices even higher.
What makes this interesting, however, is not merely that the prediction eventually became reality, but how it unfolded through price action itself.
So let’s try connecting the chart with the broader global macro context.
The last stage of euphoria
Back then, as always, the beginning of the year was filled with optimism-driven narratives. The usual beginner-market playbook around the “January effect” and “Window-dressing period” started circulating once again.
A popular thesis at the time revolved around a potential commodity rally across Emerging Markets (EM), based on the assumption that US tech stocks had become overvalued, while emerging markets still looked relatively undervalued. At the same time, the accelerating AI race pushed technological development at an unprecedented pace, increasing demand for commodities tied to infrastructure, data centers, semiconductors, microchips, storage systems, and other hardware components.
As a result, commodities such as Gold, palladium, tin, platinum, tantalum, copper, aluminum, and critical minerals like arsenic, fluorspar, gallium, germanium, indium, and tantalum started being priced aggressively higher.
This became even more apparent in gold and silver. Combined with rising global uncertainty, prices turned increasingly parabolic. Let’s simply call this entire phase the “Metal Bull Season”. Whether through direct commodity exposure or commodity-related equities, almost everything tied to the sector benefited from the rally.
Meanwhile, expensive US growth stocks, now perceived as having limited upside potential, slowly began losing favor, with capital rotating toward emerging markets, especially those linked to commodities and real assets.
South Korea (KOSPI) rallied on the back of AI and governance reform narratives, Taiwan (TSE) surged due to semiconductors, while Brazil climbed alongside the commodity boom. At the same time, a weakening US dollar made emerging markets even more attractive. Several asset management reports at the time showed massive positive inflows into EM assets.

Equity market rotation via Advisor Perspectives
In Brazil alone, energy and metal mining stocks outperformed significantly, with companies like Vale (iron ore and nickel) and Petrobras moving in strong uptrends.
Indonesia’s situation was not that different from Brazil either, considering both economies are heavily commodity-based. Indonesia was often viewed as one of the strongest commodity plays after Brazil itself, which naturally reinforced expectations that EM capital rotation would eventually flow into Indonesia as well.
But that’s exactly what made the situation interesting.
Ironically, the moment everyone became convinced that Indonesia would be one of the biggest beneficiaries of emerging market inflows was precisely when the market had likely reached its cycle top, without realizing it.
I’ve noticed that across almost every market (stocks, crypto, or forex), cycle tops usually emerge under the same conditions:
- Everyone is making money, even with minimal experience. People you had never even heard talk about stocks or crypto suddenly begin showing off their profits.
- FoMO becomes collective behavior. Usually amplified by influencers claiming success through methods A, B, or C while promoting their courses, even though, during a broad bull run, almost any asset bought would likely go up anyway.
- Both beginners and professionals start losing self-awareness. Everyone suddenly feels like they’ve mastered market analysis and developed a “high win rate,” simply because everything they buy keeps rising. People begin saying things like “I told you” or “We predicted this long ago,” when in reality almost every analysis carried an upward bias during the rally.
- Margin positions become dangerously bloated. Excessive leverage in securities and futures markets reflects increasingly aggressive speculation, fueled by the belief that prices can continue rising sustainably. This pushes market psychology into a state of extreme greed, a fragile condition where positions become highly vulnerable to force liquidations once a black swan event hits.
Let’s connect the story to the price action
If we zoom out to the yearly timeframe, the IHSG had actually been moving inside a long-term parallel upside channel for decades.
What became interesting was the fact that every major cycle top consistently failed to break above the upper resistance band of that channel. Instead, each touch near the upper boundary was eventually followed by a significant correction.
![IHSG on weekly timeframe with uptrend curve (left) and drawdowns (right) [Captured on 4 Mar 2026]](https://miro.medium.com/v2/resize:fit:1071/1*IKkpHbwn98nLJA-_iT5Wgg.jpeg)
IHSG on weekly timeframe with uptrend curve (left) and drawdowns (right) [Captured on 4 Mar 2026]
So when the 2025 rally became increasingly vertical and euphoric, the question naturally became:
Why were people expecting the market to keep going exponentially higher, when historically this zone had always been the best area to distribute and take profit?
The chart itself was already showing exhaustion.
Compared to previous cycles, the slope of the 2025 rally was far steeper and more aggressive, largely driven by the euphoria surrounding conglomerate-related and speculative Indonesian stocks. In many ways, the move started resembling a reflexive momentum chase rather than sustainable market expansion.
And historically, parabolic rallies rarely end peacefully.
The faster an asset rises, the more fragile the structure underneath becomes. Sharp vertical expansions are usually followed by equally violent drawdowns, sometimes evolving into prolonged bear markets altogether.
What made the situation even more concerning was how similar the structure looked compared to previous cycle tops.
Each major rejection from the upper yearly channel previously resulted in drawdowns ranging between roughly 16% to 26%, while larger macro crises produced even deeper collapses.
By early 2026, the market once again found itself rejecting near the exact same upper resistance region, with momentum indicators such as RSI and MACD already showing signs of exhaustion and weakening strength.
From a technical perspective alone, the market was already entering a dangerously overheated condition. And the real catalyst almost always comes from narrative deterioration.
As traders often say: “Story drives the price”**
And at that moment, the “bad story” quietly began emerging through a series of institutional and macro concerns involving MSCI, FTSE Russell, and Moody’s Ratings.
For many retail investors, these names may sound abstract. But for global institutions, they are extremely important pillars of trust.
MSCI and FTSE Russell manage global benchmark indexes used by trillions of dollars worth of institutional portfolios, ETFs, pension funds, and sovereign wealth allocations. Their assessments influence how investable a country appears in the eyes of international capital.
At the time, Indonesia began facing growing concerns surrounding market stability and accessibility following several trading system disruptions, weakening liquidity conditions, and broader worries about foreign investor confidence. Discussions around possible freezes, reduced accessibility perception, and potential weighting adjustments slowly created fear among institutional investors.
And this matters because weighting determines capital allocation.
If a country’s weighting inside major indexes gets reduced, global passive funds automatically allocate less money into that market. Less allocation means weaker inflows. Weaker inflows reduce liquidity. Lower liquidity makes markets increasingly fragile during periods of panic.
In many ways, this became the pioneer “pivot story” that slowly shifted the direction of the Indonesian stock market into a broader bear market phase.
The situation deteriorated even further as geopolitical tensions in the Middle East escalated. Brent Crude Oil surged above $100 per barrel, dragging other energy commodities higher as well, including liquefied natural gas (LNG) and ammonia.
The closure of the Strait of Hormuz triggered a massive increase in shipping costs, logistics expenses, fuel prices, and global transit costs.
And because Indonesia remains heavily dependent on imported supply chains and energy-sensitive industries, those pressures eventually spilled into production costs, consumer prices, and broader inflationary fears.
It was dealing with collapsing confidence, I think.

Generated by ChatGPT
Catching the falling knife, or catching the bottom?
So, is this finally the right time to start buying aggressively? Or is it actually better to cut losses before things get even worse?
There’s a famous quote from a market legend:
“Be fearful when others are greedy, and greedy when others are fearful.”
Or perhaps you’ve heard another variation:
“Buy when there’s blood in the streets, even if the blood is your own.”
But all of those quotes only make sense within the right context.
Is this crash merely the result of temporary “system defects”, a short-term panic that will eventually recover?
Or is this a deeper systemic problem caused by poor governance and structural deterioration that could fundamentally change how business and investment activity operate in Indonesia going forward?
Understanding the nature of the crash itself changes how we should respond to it. Should investors aggressively step in and accumulate undervalued stocks? Or is this actually the moment to de-risk and preserve capital?

Generated by ChatGPT
At the very least, however, this is becoming a technically interesting area to observe

IHSG on weekly chart via TradingView (Captured on 21 May 2026)
On the weekly timeframe of the long-term IHSG chart, one thing stands out clearly.
Within the broader bull market structure, which I measure using the 200-week SMA (the orange line), the index historically tends to spend limited periods trading below its long-term bull market support band.
So far, those periods have typically lasted around 21 weeks, 28 weeks, 34 weeks, and rarely more than 40 weeks before buyers eventually stepped back in.
What’s even more interesting is the behavior of the RSI during those periods.
Every time the RSI entered oversold territory (below 30), or even extremely oversold conditions (closer to 25 and below), buyers historically responded very aggressively. Strong buying pressure often emerged almost immediately inside those zones, frequently leading to sharp V-shaped recoveries, or what shitcoin traders jokingly call a “Dalai Lama pattern.”
And as of the time this article is written (May 21, 2026), the RSI is currently sitting at 26.83.

IHSG on weekly chart via TradingView (Captured on 21 May 2026)
Second, if we zoom in further, the market is actually entering a historically well-defended yearly support area.
The first layer (the first white box) sits around the current S&R zone, which also happens to align with the 0.618 Fibonacci golden area, drawn from the long-term yearly swing low in 2020 to the swing high in January 2026.
However, if conditions continue deteriorating and buyers fail to react strongly from this area, then I believe the final support layer (the second white box) would likely sit around the order block near the 0.786 Fibonacci level, a zone that is often associated with weak trend momentum and deeper corrective structures in Fibonacci-based market analysis.
Based on the pattern that has repeated itself for years, even if the IHSG temporarily breaks below the parallel ascending channel, it would most likely only become a temporary deviation.
Perhaps a liquidity sweep into stronger demand zones. Or simply another mechanism to shake out paper hands and manipulate them before the market stabilizes again.
So whatever your plan is from here, I hope we all survive! (:
Thank you for reading this article. I truly appreciate it.
메타데이터
- post_id
- 95615e2294e2
- slug
- indonesia-and-the-dumb-self-fulfilling-prophecy-95615e2294e2
- url
- https://medium.com/@muhammadfaniabdillah/indonesia-and-the-dumb-self-fulfilling-prophecy-95615e2294e2
- canonical_url
- https://medium.com/@muhammadfaniabdillah/indonesia-and-the-dumb-self-fulfilling-prophecy-95615e2294e2
- author_url
- https://medium.com/@muhammadfaniabdillah
- status
- ok
- fetched_at
- 2026-06-17 12:58:54