So you want to visualize networks using rust …
Are you a Rust enthusiast looking to visualize your network graphs? Look no further! In this article, we’ll introduce you to a fantastic…
So you want to visualize networks using rust …
Are you a Rust enthusiast looking to visualize your network graphs? Look no further! In this article, we’ll introduce you to a fantastic widget called egui_graphs, which allows you to effortlessly render complex network graphs using Rust and the egui library.
Upd: the first stable release is delivered. Welcome v0.1.0
Introducing egui_graphs
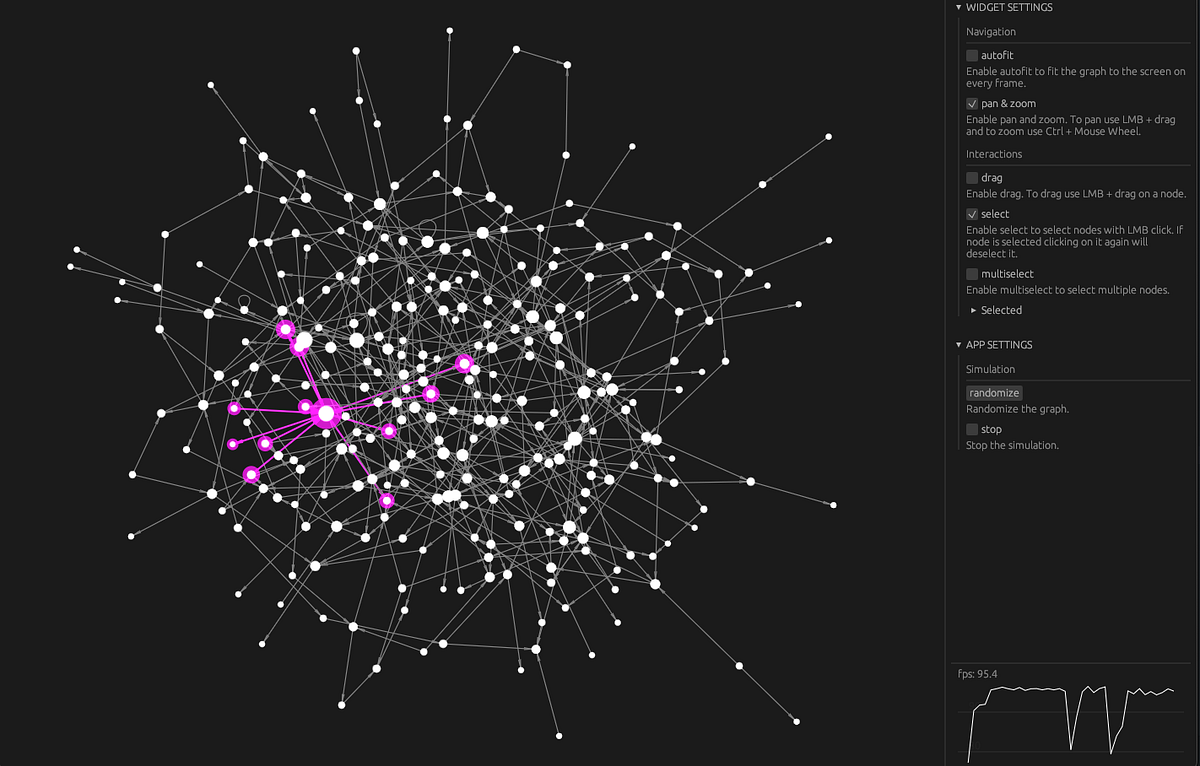
egui_graphs is a graph visualization implementation built on top of the popular egui library. The project is close to its first stable version and aims to expand egui’s visualization capabilities by providing an easy-to-integrate, customizable graph visualization widget.
Key features of egui_graphs include:
- Customization and interactivity.
- Ability to draw arbitrarily complex graphs with self-references, loops, etc.
- The widget does not modify the provided graph and properties; instead, it generates changes, in case of any interactions, which the client can apply.

The project is nearing its first stable release. You can now explore the provided interactive example app and discover how to make the most of this widget in your own projects.
Small Hands-on Example
The project is under active development with no first stable release yet. Current example is valid for v0.0.19 version. You can refer to the project readme and docs to get the latest documentation.
Step 1: Setting up the ExampleApp struct.
First, let’s define the ExampleApp struct that will hold the graph elements and settings. The struct contains two fields: elements and settings. The elements field stores the graph’s nodes and edges, while settings contains the configuration options for the GraphView widget.
pub struct ExampleApp {
    elements: Elements,
    settings: Settings,
}
Step 2: Implementing the new() function.
Next, implement the new() function for the ExampleApp struct. This function initializes the graph settings with default values and generates the graph elements.
impl ExampleApp {
    fn new(_: &CreationContext<'_>) -> Self {
        let settings = Settings::default();
        let elements = generate_graph();
        Self { settings, elements }
    }
}
Step 3: Generating the graph elements.
Create a helper function called generate_graph() that initializes the nodes and edges for the graph. In this example, we create three nodes with unique positions and three edges connecting them in a triangular pattern.
fn generate_graph() -> Elements {
    let mut nodes = HashMap::new();
    nodes.insert(0, Node::new(0, egui::Vec2::new(0., 30.)));
    nodes.insert(1, Node::new(1, egui::Vec2::new(-30., 0.)));
    nodes.insert(2, Node::new(2, egui::Vec2::new(30., 0.)));

    let mut edges = HashMap::new();
    edges.insert((0, 1), vec![Edge::new(0, 1, 0)]);
    edges.insert((1, 2), vec![Edge::new(1, 2, 0)]);
    edges.insert((2, 0), vec![Edge::new(2, 0, 0)]);

    Elements::new(nodes, edges)
}
Step 4: Implementing the update() function.
Now, implement the update() function for the ExampleApp. This function creates a GraphView widget with the elements and settings, and adds it to the central panel using the ui.add() function.
impl App for ExampleApp {
    fn update(&mut self, ctx: &Context, _: &mut eframe::Frame) {
        let widget = &GraphView::new(&self.elements, &self.settings);
        egui::CentralPanel::default().show(ctx, |ui| {
            ui.add(widget);
        });
    }
}
Step 5: Running the application.
Finally, run the application using the run_native() function with the specified native options and the ExampleApp.
fn main() {
    let native_options = eframe::NativeOptions::default();
    run_native(
        "egui_graphs_basic_demo",
        native_options,
        Box::new(|cc| Box::new(ExampleApp::new(cc))),
    )
    .unwrap();
}
You can further customize the appearance and behavior of your graph by modifying the settings or adding more nodes and edges as needed. Don’t forget to apply changes returned from the widget.
You can check more advanced interactive example for usage references, settings description and changes apply demonstration.
메타데이터
- post_id
- 95c0a3428241
- slug
- so-you-want-to-visualize-networks-using-rust-95c0a3428241
- url
- https://medium.com/@blitzarx1/so-you-want-to-visualize-networks-using-rust-95c0a3428241
- canonical_url
- https://medium.com/@blitzarx1/so-you-want-to-visualize-networks-using-rust-95c0a3428241
- author_url
- https://medium.com/@blitzarx1
- status
- ok
- fetched_at
- 2026-07-25 20:51:28