Introducing Graph Source: A Better Way to Onboard Building Data
Structured, validated, and versioned building data onboarding for the Mapped Knowledge Graph
Introducing Graph Source: A Better Way to Onboard Building Data
Structured, validated, and versioned building data onboarding for the Mapped Knowledge Graph
Building data is more than a collection of assets — it is a connected system of buildings, spaces, equipment, sensors, and relationships.
For years, onboarding building metadata relied on spreadsheets. Export data. Clean it up. Map columns. Import it. Fix errors. Repeat.
That process works well for flat data, but building systems are inherently connected. A spreadsheet can tell you that a sensor exists. It struggles to describe how that sensor relates to an air handler, which spaces that air handler serves, or whether those relationships are even valid.
As organizations increasingly rely on connected building data for analytics, operations, digital twins, and AI-driven applications, onboarding requires more than data import. It requires preserving context.
Graph Source is Mapped’s structured, validated, and versioned workflow for contributing building and IoT metadata into the Mapped Knowledge Graph.
A Managed Lifecycle for Building Data
Rather than treating onboarding as a one-time import exercise, Graph Source introduces a managed lifecycle for graph contributions.
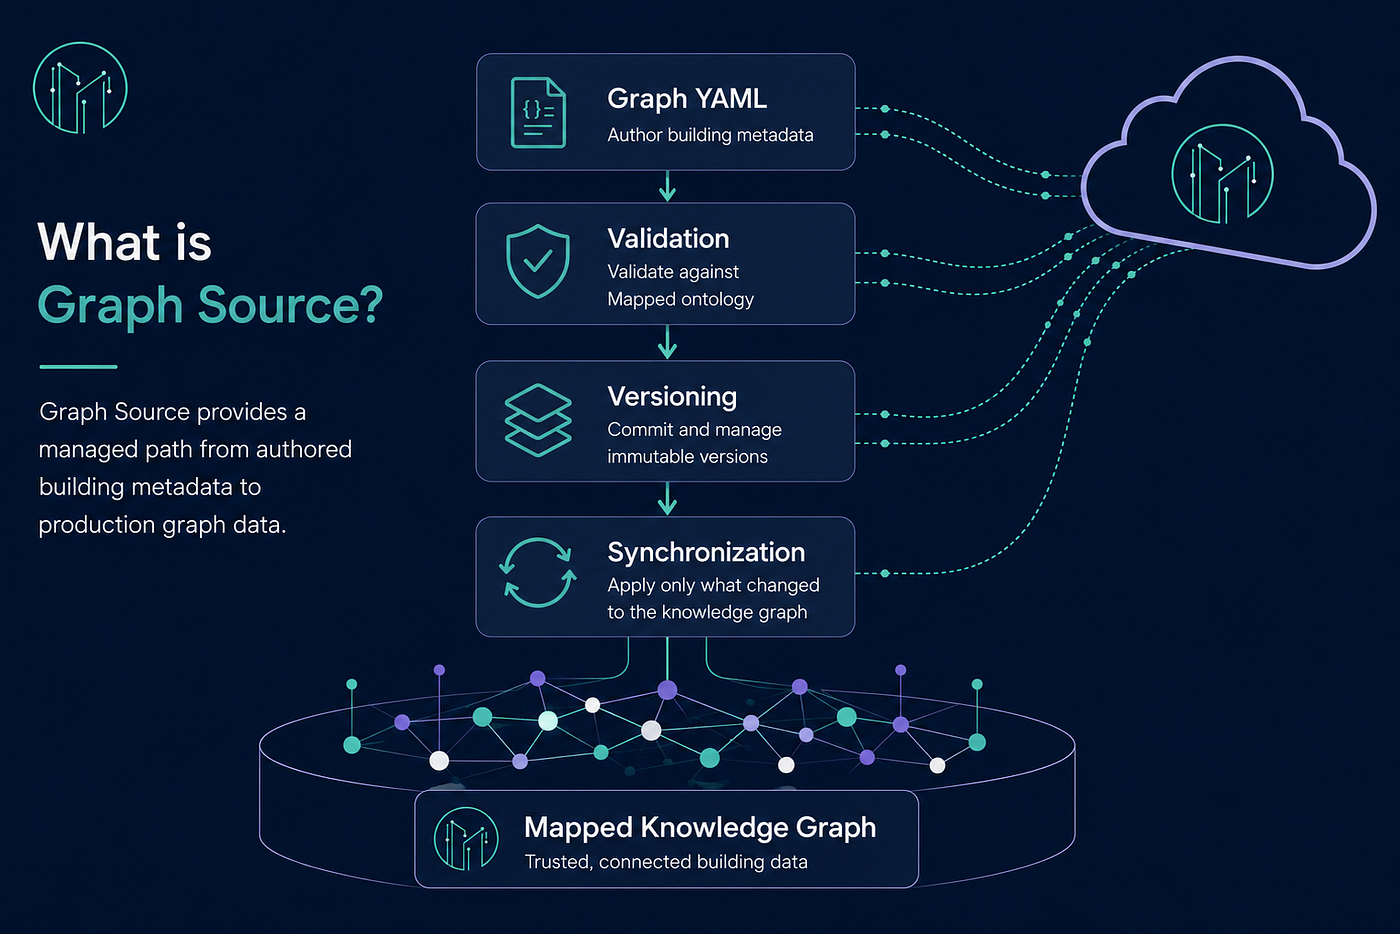
Every graph contribution — whether authored manually or generated programmatically — follows the same path:

Every graph contribution follows the same lifecycle — from authoring through synchronization.
Each committed version becomes an immutable snapshot of graph state, providing a clear history of what changed, when it changed, who made the change, and which version was ultimately synchronized.
Instead of relying on spreadsheet filenames, email threads, or tribal knowledge, teams gain a repeatable and auditable process for managing graph changes over time.
The result is a workflow that feels less like a traditional import process and more like modern change management for building data.
Modeling Buildings the Way They Actually Exist
The challenge isn’t collecting building data — it’s preserving the context that makes the data useful.
Consider the entities that make up a typical building system: buildings, floors, spaces, air handling units, VAVs, sensors, meters, and controllers.
Spreadsheets work well when information is relatively flat and consistent. Building data rarely stays that way.
As onboarding grows, spreadsheets often expand into dozens — or even hundreds — of columns to accommodate different entity types, identifiers, metadata, and operational attributes. Relationships between buildings, spaces, equipment, and sensors are frequently spread across multiple files, tabs, naming conventions, or manual mapping rules.
As graph models become richer, these limitations become operational challenges rather than simple data-cleaning problems.

Buildings are connected systems. Graph Source preserves those relationships from the beginning.
In a spreadsheet, each row describes an individual entity. Relationships are represented indirectly through parent references, identifiers, naming conventions, or manual interpretation.
In the graph view, those relationships become explicit.
The building contains a floor. The floor contains spaces. The AHU serves those spaces. The VAVs are fed by the AHU. The temperature setpoints belong to their respective VAVs.
Instead of a collection of records, the model becomes a connected representation of the physical environment.
The difference isn’t simply moving data from a spreadsheet into a graph. It’s transforming rows of data into connected building knowledge.
Want to learn more about the ontology that powers Graph Source?
Take a look Inside Mapped’s Architecture for Unified Building Data
Built on Graph YAML
Under the hood, Graph Source uses Graph YAML (GRAML) as its authoring format.
Graph YAML provides a graph-native representation of building metadata, including buildings, spaces, equipment, points, identities, properties, and relationships.
Whether data originates from the Graph Source editor, an API, or an external integration, it is represented in the same format and follows the same lifecycle:
Author → Validate → Version → Synchronize
By standardizing on a single representation, Graph Source can apply consistent validation, versioning, change tracking, and synchronization regardless of where the data originates.
The result is a predictable workflow for turning authored building metadata into production graph data.

Validation Before Data Reaches Production
One of the biggest improvements over traditional onboarding is validation.
Before any contribution can be synchronized into the Knowledge Graph, Graph Source validates it against Mapped’s ontology.
That means Graph Source can verify that entity types, properties, and relationships are modeled correctly before changes reach production.

Graph Source Connector schema driven YAML Editor
Instead of discovering modeling issues after deployment, teams can identify and correct them during authoring.
Because validation is generated directly from Mapped’s ontology, Graph Source supports thousands of entity types and relationship definitions while maintaining consistency across the platform.
Ontology serves as a shared model for how buildings, spaces, equipment, and sensors are represented throughout Mapped. Graph Source uses that model to ensure every contribution follows the same standards before it becomes part of the Knowledge Graph.
Synchronizing Only What Changed
Traditional imports often replace large portions of data even when only a few records have changed.
Graph Source takes a different approach.
When a synchronization is triggered, Graph Source retrieves the latest committed version, builds the desired graph state, compares that state against the existing graph, computes the differences, and applies only the additions, updates, and removals required to bring the graph into alignment.

Graph Source compares desired state against the existing graph and applies only the required changes.
Rather than rebuilding graph data from scratch, Graph Source focuses only on what has actually changed.
By applying updates incrementally, the platform reduces operational risk, minimizes unnecessary graph operations, and scales more effectively as graph size increases.
The result is a synchronization process that reflects how buildings evolve in the real world — through a series of small changes over time rather than complete replacement of existing state.
A Common Workflow for Humans and Automation
Building metadata can originate from many sources.
In some environments, facility teams and subject matter experts curate metadata directly. In others, integrations, connectors, and automated systems generate metadata programmatically.
Graph Source provides a common workflow regardless of where that data originates.

Rather than writing directly into the Knowledge Graph, all contributions pass through validation, versioning, and controlled synchronization before becoming production graph data.
This approach creates a more reliable, auditable, and transparent onboarding process while allowing teams to combine manual authoring and automation without changing their operating model.
Whether information comes from a spreadsheet, connector, API, or subject matter expert, Graph Source provides a consistent path for contributing building knowledge into the Mapped Knowledge Graph.
Looking Forward
Analytics, applications, digital twins, and AI all depend on the same foundation: accurate, connected building context.
Graph Source was built to make that foundation easier to create and maintain through a structured workflow for authoring, validating, versioning, and synchronizing graph data.
Whether you’re onboarding a new building, refining existing metadata, or managing graph changes at scale, Graph Source provides a more reliable way to contribute, manage, and evolve building knowledge across the Mapped platform.
Ready to see Graph Source in action? **Contact Mapped **to learn more.
Mapped is the unified AI data layer for the built world. **Visit mapped.com**
메타데이터
- post_id
- 96c964cbb5b4
- slug
- introducing-graph-source-a-better-way-to-onboard-building-data-96c964cbb5b4
- url
- https://blog.mapped.com/introducing-graph-source-a-better-way-to-onboard-building-data-96c964cbb5b4
- canonical_url
- https://blog.mapped.com/introducing-graph-source-a-better-way-to-onboard-building-data-96c964cbb5b4
- author_url
- https://medium.com/@kevinhartmann23
- status
- ok
- fetched_at
- 2026-06-10 15:53:41