Binary Search: The Algorithm Every Engineer Aces in Interviews and (Almost) Never Uses Again
I actually shipped one to production. It taught me far more about failure design than about search algorithms.
Binary Search: The Algorithm Every Engineer Aces in Interviews and (Almost) Never Uses Again
I actually shipped one to production. It taught me far more about failure design than about search algorithms.
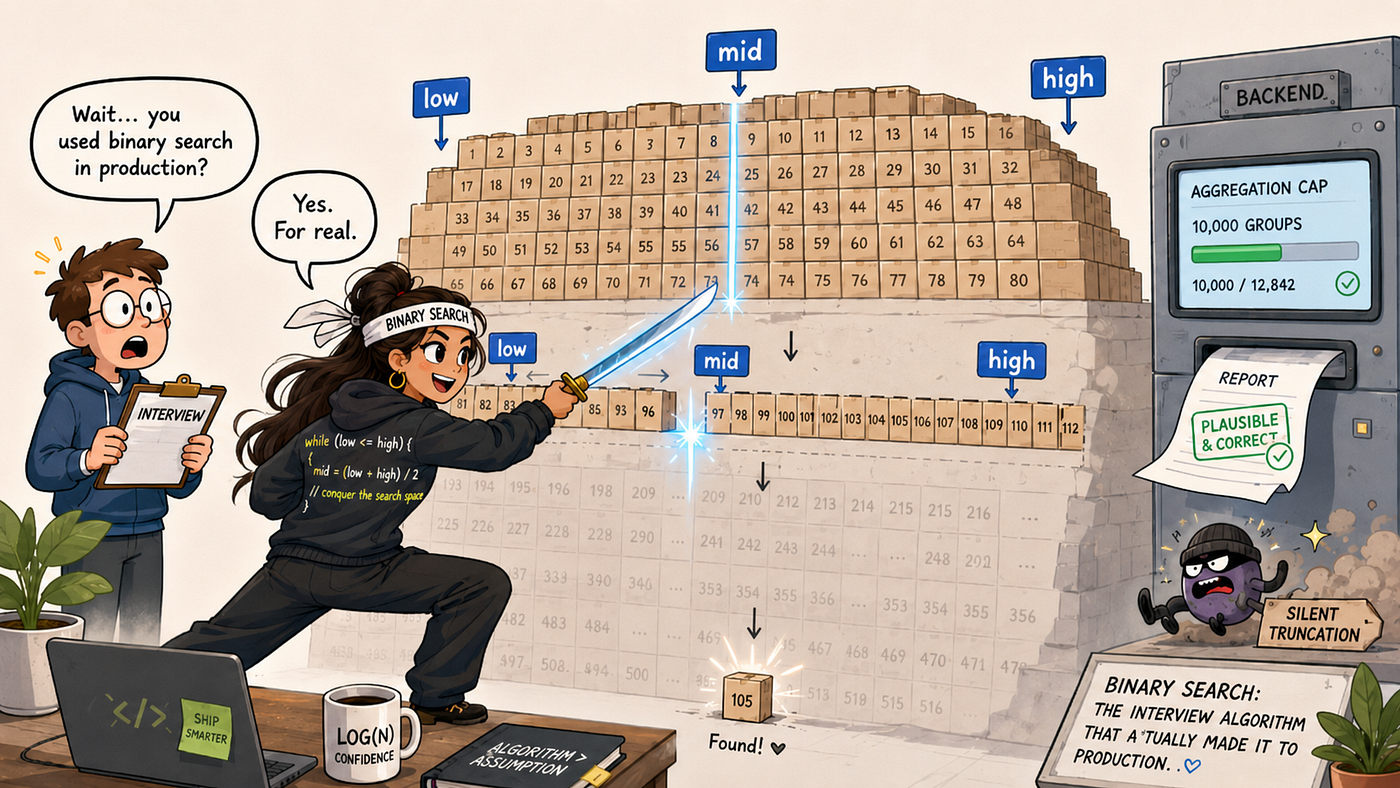
Binary search in real world application: Image generated using ChatGPT prompt
If you’ve interviewed for a software engineering role in the last decade, you’ve implemented binary search at least once, probably on a whiteboard, probably under time pressure, and probably never touched it again once you got the job. It’s one of those algorithms everyone can recite and almost nobody can point to in a real codebase. I own the architecture of a reporting service that generates scheduled analytics reports for customers, and somewhere in the middle of that codebase, on the hot path, running on every report we generate for our highest-volume customers, is an actual binary search. Not a metaphor for one. The real thing, low, high, mid, and all.
This is the story of why it’s there, the design decisions around it that turned out to matter far more than the algorithm itself, and the production incident I caused by getting one of those decisions wrong. It’s written generically enough to apply to any reporting or analytics pipeline built on top of New Relic, Elasticsearch, Splunk, BigQuery, or anything else that aggregates data behind an API you don’t control.
The design problem
One of the core queries in this system aggregates volume metrics grouped along a few dimensions at once, something like customer, batch, and destination. Every backend I’ve worked with that supports this kind of grouped aggregation enforces a hard cap on how many distinct group combinations a single query can return. That cap is rarely documented as a contract; it’s a platform implementation detail you discover empirically, usually the hard way.
For most customers in the system, the number of distinct group combinations stayed comfortably under that cap, so this was never visible. For the highest-volume customers, it wasn’t. The query would silently truncate, return a 200, and produce a result set that looked structurally identical to a complete one. Nothing in the response signals truncation. The report generated from that data would be quietly wrong, under-representing real volume, with no error path to catch it.
I want to be precise about why this is a worse failure mode than it sounds. A crash gets triaged immediately, because something visibly broke. Silent truncation produces a plausible-looking artifact that passes every naive sanity check, gets delivered, and only surfaces when someone manually reconciles it against an independent source of truth, if it surfaces at all. From an architecture standpoint, I treat any query path capable of this failure mode as a correctness risk on the same tier as a data-loss bug, not a performance nuance.
Why I ruled out the simpler options
Before landing on the design below, I evaluated and rejected three simpler approaches, and I think the reasoning matters more than the conclusion.
A static, hardcoded filter threshold was the first thing I considered and the first thing I discarded. It fails in one of two directions depending on how it’s tuned: set conservatively, it excludes real data for customers who never needed filtering in the first place; set loosely, it stops protecting your highest-volume customers, which are exactly the ones where the cap actually bites. Worse, there’s no fixed correct value to tune it to, because the right threshold is a function of a customer’s current volume and the query’s time window, both of which shift continuously. A constant that was correct last quarter can be silently wrong today with zero code changes, which makes it an unmaintainable knob, not a solved problem.
Client-side pagination was the second option, and it doesn’t apply here at all. Grouped aggregation queries of this shape are computed server-side and returned as a single result set; the backend isn’t handing you a cursor-based stream you can page through, so there’s no pagination contract to lean on.
Sampling-based approximate aggregation was the third, and I ruled it out on principle rather than mechanics. Approximate query engines trade accuracy for speed deliberately, which is the opposite tradeoff I need for a reporting product whose entire value proposition is that the numbers are trustworthy.
The design decision: calibrate the threshold live against the backend

Risk of silent truncation (Image generated using ChatGPT prompt)
The architecture I settled on treats the filter threshold not as configuration, but as a value to calibrate live, per query scope, against the backend itself.
The property that makes this tractable is monotonicity: filtering out rows below some numeric value means that raising that value can only shrink or hold constant the number of matching rows, never grow it. That’s what turns “find the right threshold” from a guessing problem into a well-posed search problem with a single correct answer per scope, which is exactly the setup binary search is built for. This is, as far as I can tell, one of the few times that whiteboard-interview algorithm shows up unmodified in a real system I’ve built.
The implementation:
def resolve_filter_threshold(scope, cap):
    count = live_count_query(scope, threshold=0)
    if count < cap:
        return 0  # no filtering required; skip the search entirely

    low, high = 0, MAX_THRESHOLD
    best = 0  # fail-open default — see "Decision: which way does this fail" below

    while low <= high:
        mid = (low + high) // 2
        count = live_count_query(scope, threshold=mid)
        if count is None:
            break  # live call failed; stop and return the best value found so far
        if count < cap:
            best = mid       # this threshold satisfies the cap; try to relax it further
            high = mid - 1
        else:
            low = mid + 1

    return best
Two design choices here are worth calling out explicitly, because they’re the parts that actually took engineering judgment, not the bisection loop itself.
Skip the search when it isn’t needed. Before doing any calibration, I check whether the unfiltered query is already under the cap. Most customers hit this branch and never touch the search path at all. This matters because every comparison in this search is a live network call, not an in-memory step, so avoiding the search entirely for the common case is a meaningful cost reduction, not a micro-optimization.
Optimize for the loosest valid threshold, not just any valid one. The convergence target is specifically the smallest threshold that satisfies the cap, found by continuing to search lower after finding a working candidate. This is a deliberate choice to maximize data completeness subject to the platform constraint, rather than settling for the first threshold that happens to work. I want to be direct about what is and isn’t novel here: binary search itself is the same algorithm you’d write in a coding interview, and I’m not claiming otherwise. The engineering content is in treating a live, costly, third-party API call as the unit of comparison, and architecting the surrounding system, the skip condition, the convergence target, and the failure handling below, around that cost model rather than around the algorithm in isolation.
Decision: which way does this fail
This is the decision that turned into a real production incident, and it’s the one I’d flag first to anyone building something similar.
What should happen when a live count query fails mid-search, whether from a timeout, an error response, or a transient rate limit? My original implementation defaulted best to the search's upper bound on failure, the most restrictive threshold possible. In code review this looked like a reasonable default; a failure is a failure, and you have to return something. In production, it meant a transient backend hiccup during calibration didn't just fail to find a good threshold, it actively applied the most aggressive filter available, and the resulting report went out looking nearly empty to a real customer. The defect wasn't in the search logic. It was in the direction I'd chosen for the safety net to fail.
The fix was to invert that default: on any failure, best degrades to 0, meaning no filtering at all, never to the aggressive end of the range. The architectural principle I now apply everywhere in this system, not just here, is that a calibration or optimization mechanism's failure path must degrade to the behavior the system would have without the mechanism, never to something worse. I treat "fails predictably" and "fails safely" as two different properties that both need explicit verification, because a fallback that reliably does the wrong thing is worse than no fallback at all.
Decision: what to do about the cost of calibration itself
Separately from the failure-direction bug, I identified a cost problem in the same code path. The calibration search was running fresh on every single report generation, for every customer, every time, including cases where the same customer’s report ran again shortly afterward against an identical time window. Each of those runs could cost more than a dozen live API calls before the report’s actual data queries even started.
I want to be specific about why this kind of cost is easy to miss architecturally: it lives entirely inside a “setup” or “calibration” phase that precedes what a profiler or an engineer scanning the main query path would think of as the real work. That framing makes the cost invisible by default, even though it’s consuming real API budget on every invocation. In this system, it became visible only once it started compounding with unrelated concurrency and retry issues elsewhere in the pipeline into a genuine rate-limit incident. Calibration overhead alone likely wouldn’t have caused an outage on its own; stacked on top of an already over-budget system, it was one more multiplier I hadn’t accounted for.
The fix was a process-lifetime cache keyed on the query scope (customer and time window), so a resolved threshold is computed once and reused for the life of the process rather than recomputed per call. The broader design principle I took from this: any setup or calibration step deserves the same architectural scrutiny as the main workload, because “small and preparatory” says nothing about cost, and it’s precisely the kind of overhead that hides from normal profiling.
Scope of the design: when this pattern applies
I’d apply this architecture when three conditions hold together: the backend enforces a hard cap on aggregation result size, the filtering field behaves monotonically with respect to that cap, and a live comparison is expensive enough, in latency, rate-limit budget, or direct cost, that minimizing the number of comparisons materially matters. Absent a hard cap, this is unnecessary complexity. Absent monotonicity, bisection will converge on a wrong answer with high confidence, since the entire technique depends on that property. And if a single comparison is cheap, a simpler linear check across candidate thresholds is easier to reason about and not meaningfully slower.
I’d also flag the limitation I accepted knowingly when I built this: the cap itself is an empirically discovered constant, not a documented platform contract. If the vendor changes it without notice, which they’re fully entitled to do since it was never a guarantee in the first place, the hardcoded value goes stale silently. I don’t think there’s an architectural fix for this beyond treating that constant as something to periodically re-verify against the live platform, the same way I’d treat any other assumption about a system I don’t control.
What I’d tell another architect building this
Don’t assume a static threshold holds over time when you’re aggregating against a platform with an undocumented result cap; the correct value is a function of data volume that shifts under you. Treat the threshold as something to discover empirically and recalibrate against the live system, not something to configure once and forget. If that discovery process costs a live network call, minimize the number of calls it takes and cache the result wherever the same scope is likely to recur. Audit every fallback path in the system, not just this one, for the direction it fails in, and verify explicitly that the safety net degrades toward the system’s baseline behavior rather than past it. And treat calibration and setup steps as real workload with real cost, not as free overhead that happens before “the actual work,” because that’s exactly the framing that lets this kind of cost hide in production until something else forces it into view.
The next time someone tells you binary search is just an interview trick, you now have a counterexample.
메타데이터
- post_id
- 9958bc9a2d08
- slug
- binary-search-the-algorithm-every-engineer-aces-in-interviews-and-almost-never-uses-again-9958bc9a2d08
- url
- https://medium.com/@priyanshijajoo96/binary-search-the-algorithm-every-engineer-aces-in-interviews-and-almost-never-uses-again-9958bc9a2d08
- canonical_url
- https://medium.com/@priyanshijajoo96/binary-search-the-algorithm-every-engineer-aces-in-interviews-and-almost-never-uses-again-9958bc9a2d08
- author_url
- https://medium.com/@priyanshijajoo96
- status
- ok
- fetched_at
- 2026-08-03 18:35:57