Building a Near Real-Time Global Deforestation Detection Pipeline on Cloud
Deforestation is a critical global issue that requires timely detection and intervention. In this blog, we will explore how to build a near…
Building a Near Real-Time Global Deforestation Detection Pipeline on Cloud

Deforestation is a critical global issue that requires timely detection and intervention. In this blog, we will explore how to build a near real-time global deforestation detection pipeline using Amazon Web Services (AWS). By using the infrastructure and services of AWS, we can automate the process of downloading, processing, and analyzing Sentinel-2 satellite imagery to detect deforestation events every 5 days, thanks to the temporal resolution of Sentinel-2. For the purpose of this blog, we assume that we already have a trained deep learning model for deforestation detection. The focus here is not on training the model, but rather on how to build an automated pipeline on AWS to achieve near real-time global deforestation detection.
I. Key Components of the Pipeline:

1.1 AWS Infrastructure: Provides computing resources, storage, and networking, for scalability, security, and reliability for the pipeline.
1.2 Amazon S3: Primary storage for raw and processed data, including Sentinel-2 imagery, data chunks, prediction results, and tiles.
1.3 Sentinel-2 Imagery API: Acquires satellite images every 5 days, for near real-time deforestation detection.
1.4 Data Preprocessing (AWS Lambda): Preprocesses raw Sentinel-2 imagery, to prepare data for deforestation detection.
1.5 Chunking Data (AWS Lambda): Splits large Sentinel-2 images into smaller chunks for easier processing and prediction and stores them in S3.
1.6 AWS SageMaker: Hosts the pre-trained deep learning model to perform predictions on chunked data.
1.7 AWS Step Functions: Manages the sequence of tasks from data acquisition to prediction, ensuring smooth pipeline operation.
1.8 AWS Fargate: Runs containerized tasks for model inference, providing an isolated and scalable environment.
1.9 Tile Generation: Generates map tiles from prediction data, enabling efficient visualization of large datasets.
1.10 Amazon CloudFront: Delivers visualization tiles to end-users with low latency and high transfer speeds for a smooth user experience.
1.11 AWS EventBridge: Triggers the pipeline every 5 days, ensuring continuous operation and regular updates.
1.12 Amazon CloudWatch: Monitors pipeline performance, providing real-time metrics and alerts to maintain health and efficiency.
1.1 AWS Infrastructure
AWS Infrastructure is the backbone of our deforestation detection pipeline, providing all the essential computing resources, storage, and networking needed to run our system. We use Amazon Web Services (AWS) to ensure our pipeline is scalable, secure, and reliable. This includes setting up a Virtual Private Cloud (VPC) to create a secure network environment where our resources can communicate.
By building on AWS, we benefit from a flexible infrastructure that can scale with our needs. AWS provides the tools and services necessary to manage and process large datasets, such as the Sentinel-2 imagery in our case, and supports the various components of our pipeline, from data acquisition to visualization. This ensures our pipeline operates smoothly and can handle the demands of near real-time deforestation detection.
1.2 Amazon S3

Amazon S3 (Simple Storage Service) is a crucial component of our deforestation detection pipeline. It serves as the primary storage solution for all our data, including raw Sentinel-2 imagery, processed data chunks, prediction results, and visualization tiles. S3’s scalability and cost-effectiveness make it ideal for handling the large volumes of data involved in global deforestation monitoring.
In our pipeline, we store the downloaded satellite images from the Sentinel-2 API in S3. These images are then processed and chunked into smaller pieces, which are also stored in S3. The processed data is used for model predictions, and the results are saved back into S3 for further analysis and visualization.
1.3 Sentinel-2 Imagery API

The Sentinel-2 Imagery API is a very important component of our deforestation detection pipeline. It is responsible for acquiring Sentinel-2 satellite imagery, which is essential for detecting deforestation. Sentinel-2 provides imagery with a temporal resolution of 5 days, meaning we can get updated images of the same area every 5 days, allowing for near real-time monitoring.
In our pipeline, we use the Sentinel-2 Imagery API to automate the download of these satellite images globally. Every 5 days, the API triggers the acquisition process, fetching the latest available global imagery. These images are then stored in Amazon S3 for further processing. The automation ensures that our pipeline always has the most current data to work with, which is crucial for near real-time deforestation detection.
1.4 Data Preprocessing (AWS Lambda)
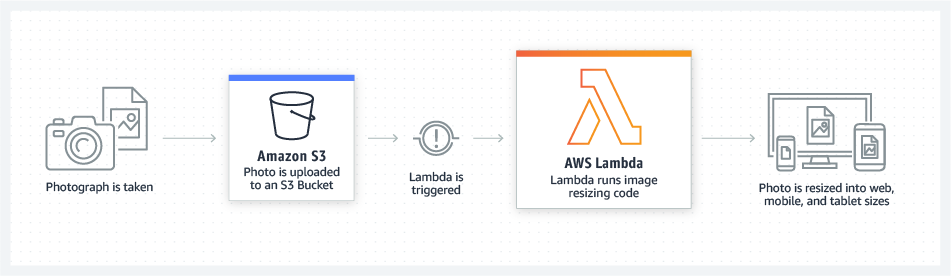
As part of Data preprocessing in our deforestation detection pipeline, we use AWS Lambda to handle this task. AWS Lambda is a serverless computing service that allows us to run code without provisioning or managing servers. In our pipeline, AWS Lambda functions are triggered to preprocess the raw Sentinel-2 imagery stored in Amazon S3 to make the input satellite imagery ready for performing prediction.
This ensures that our data is always ready for the next steps in the pipeline. Preprocessing the data correctly is crucial for accurate predictions using trained deep learning model, and AWS Lambda helps us achieve this.
1.5 Chunking Data (AWS Lambda)

Chunking data is a necessary step in our deforestation detection pipeline, which we are handling using AWS Lambda. After preprocessing the Sentinel-2 imagery, the data needs to be divided into smaller, more manageable pieces. This step is crucial because working with large, unchunked satellite images can be computationally intensive.
Using AWS Lambda, we automate the process of splitting the large satellite images into smaller chunks. These chunks are easier to process and allow our deforestation detection model to run more efficiently. The Lambda function retrieves the preprocessed data from Amazon S3, divides the images into smaller tiles, and then stores these tiles back in S3.
This chunking step is required to ensure that our pipeline can handle large global datasets. By breaking down the data into smaller pieces, we can perform parallel processing, speeding up the analysis and making better use of computing resources. It also helps in managing memory and computational load, ensuring that our pipeline remains efficient and scalable.
1.6 AWS SageMaker
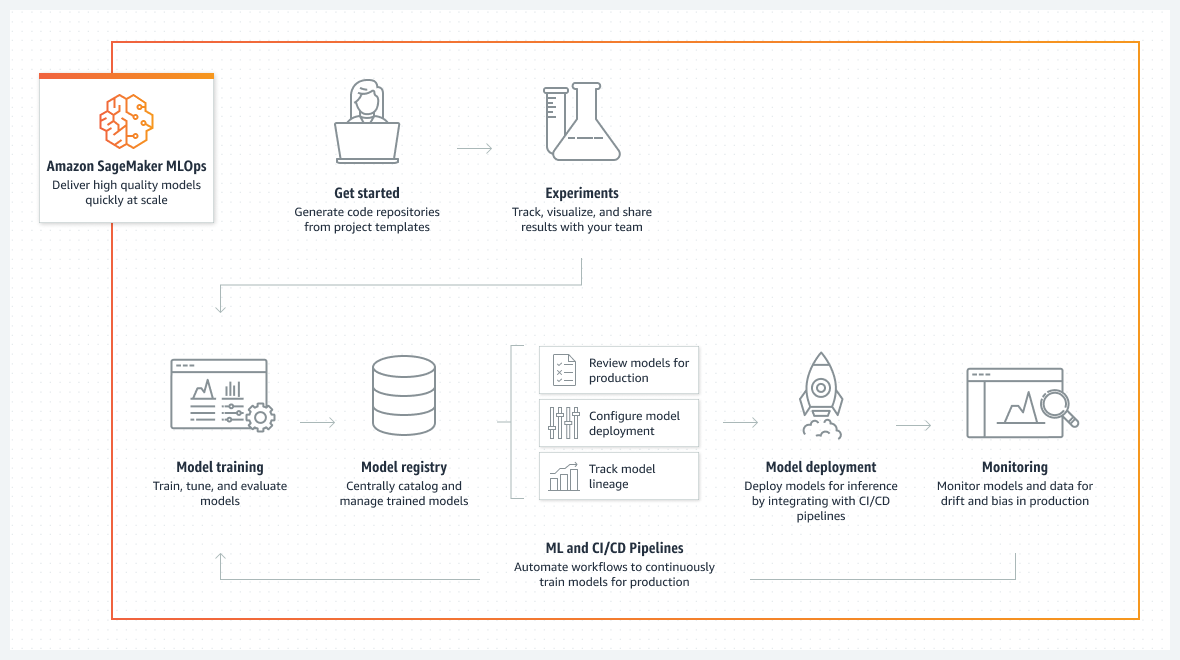
AWS SageMaker is again a very important component of our deforestation detection pipeline, responsible for running model prediction. In this step, we use the pre-trained deep learning model to detect deforestation for globally chunked Sentinel-2 imagery. Once the data has been preprocessed and chunked, it is fed into the SageMaker model for prediction.
The model analyzes each chunk of data to detect signs of deforestation, generating prediction results. These results indicate whether deforestation has occurred in specific areas covered by the satellite imagery. The predictions are then stored back in Amazon S3 for further processing and visualization. This step is essential because it performs deforestation detection on raw satellite data using trained deep learning model.
1.7 AWS Step Functions

AWS Step Functions orchestrates the entire workflow in our deforestation detection pipeline. This service allows us to define a series of steps that our data processing must go through, managing the sequence of tasks and ensuring each step is executed correctly and in order. AWS Step Functions handle the coordination of different AWS services.
AWS Step Functions are used to manage the flow from data acquisition to final prediction for detecting deforestation. When new Sentinel-2 imagery is acquired, Step Functions trigger the preprocessing tasks using AWS Lambda, handle the chunking of data, and coordinate the model inference using AWS SageMaker. It also manages the generation of map tiles and ensures that all steps are completed before moving on to the next task.
By using AWS Step Functions, we can ensure that each component of the pipeline works together, maintaining a smooth and efficient operation. This orchestration layer is essential for achieving near real-time global deforestation detection and making the pipeline manageable.
1.8 AWS Fargate
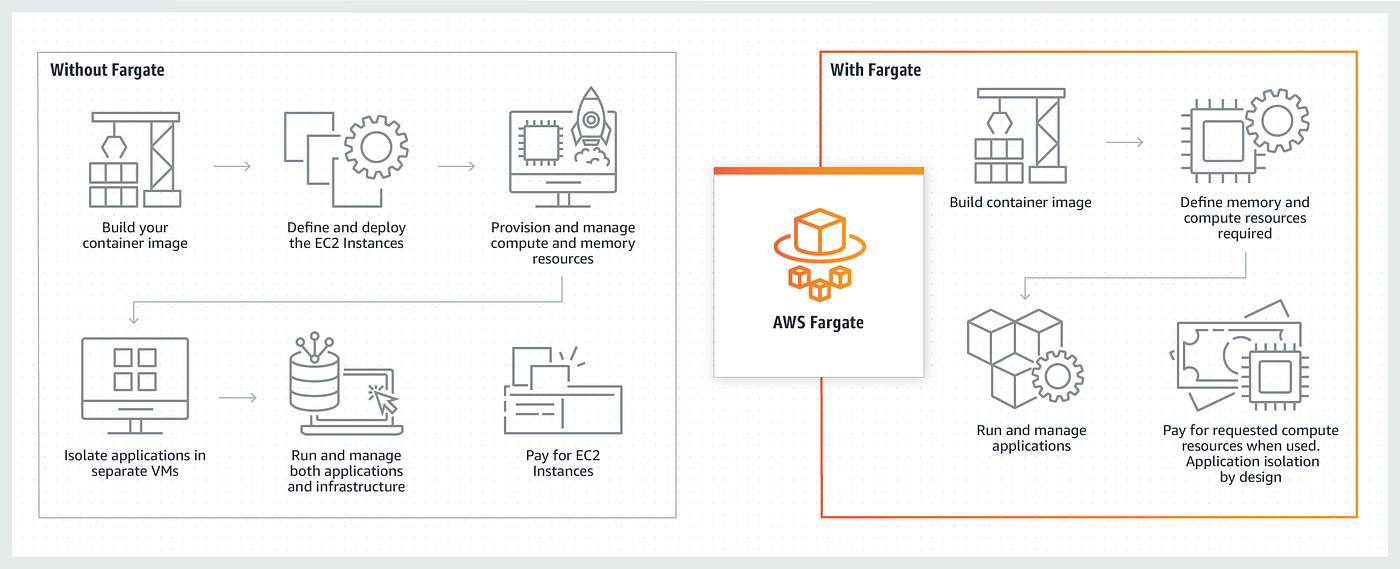
In our pipeline, AWS Fargate is used to execute the predictions generated by the deep learning model hosted on AWS SageMaker. This allows us to efficiently process the chunked satellite imagery data without managing the underlying infrastructure.
After the data is chunked and stored in Amazon S3, AWS Step Functions orchestrate the workflow by triggering AWS Fargate to run containerized prediction tasks. These tasks use the pre-trained model to perform prediction on each data chunk and generate deforestation predictions.
AWS Fargate automatically provisions and scales the compute resources needed for the prediction tasks, allowing us to handle large global datasets and high computational loads. By using Fargate, we can focus on running our predictions without worrying about managing servers, making the pipeline easier to maintain.
1.9 Tile Generation

The Tile generation step in our deforestation detection pipeline prepares the prediction results for visualization on a front-end. After the model inference step, where deforestation predictions are generated, these results need to be converted into a format that can be efficiently displayed on as a map on a front-end. This is where tile generation comes into play.
In this step, the prediction results stored in Amazon S3 are processed and divided into smaller, manageable map tiles. These tiles are essentially small square images that represent a portion of the larger map. By breaking down the data into tiles, we can load and render only the necessary portions of the map as users interact with it, ensuring smooth and efficient visualization.
Instead of trying to load a massive global map all at once, which would be slow and impractical, we generate and serve tiles dynamically. This way, users can zoom in and out and pan across the map seamlessly. The tiles are stored back in S3, ready to be delivered to the front-end application through Amazon CloudFront, enabling a fast and user-friendly experience for viewing deforestation predictions.
1.10 Amazon CloudFront

Amazon CloudFront is responsible for delivering the generated map tiles in the previous step to end-users which is the front-end. CloudFront is a content delivery network (CDN) service that provides a globally distributed network of edge locations to cache and deliver content with low latency and high transfer speeds.
After the tile generation step, where prediction results are converted into map tiles and stored in Amazon S3, CloudFront takes over to ensure these tiles are quickly and reliably accessible to users. By caching the tiles at multiple edge locations around the world, CloudFront ensures that when a user requests a map tile, it is delivered from the nearest edge location, reducing latency and improving the user experience.
This step is important for providing a responsive map visualization interface. Without a CDN like CloudFront, users might experience slow loading times and delays when accessing map tiles, especially if they are far from the primary storage location. By using CloudFront, we can ensure that the deforestation predictions are presented quickly and seamlessly, allowing users to interact with the map in real-time.
1.11 AWS EventBridge

In our pipeline, AWS EventBridge is used to automate the triggering of data acquisition and processing tasks every 5 days, which aligns with the temporal resolution of Sentinel-2 imagery. This ensures that our pipeline continuously acquires new satellite imagery and processing it to provide updated deforestation predictions. EventBridge sets up rules to trigger AWS Lambda functions, AWS Step Functions, and other services at scheduled intervals, ensuring timely execution of each step in the pipeline.
This step is essential because it maintains the near real-time aspect of our deforestation detection pipeline. By automating the schedule and trigger of data acquisition and processing, we eliminate the need for manual intervention.
1.12 Amazon CloudWatch

In our pipeline, Amazon CloudWatch monitors the performance and health of all the AWS services involved, including Lambda functions, SageMaker, Fargate tasks, and data storage in S3. It collects metrics such as execution times, error rates, and resource utilization. If any anomalies or issues are detected, CloudWatch triggers alerts to notify the team, enabling quick responses to potential problems.
This step is crucial because it ensures the reliability and performance of our pipeline. By continuously monitoring the system, we can identify and address issues promptly, minimizing downtime and maintaining the accuracy and timeliness of our deforestation predictions. CloudWatch helps us providing the necessary insights to optimize and troubleshoot our workflow effectively.
II. Flow of the Deforestation Detection Pipeline:

The entire flow of our Deforestation Detection Pipeline can be seen below:
- The process begins with AWS EventBridge, which triggers the data acquisition every 5 days, ensuring that the pipeline operates in sync with the temporal resolution of Sentinel-2 imagery.
- Sentinel-2 Imagery API is called to download the latest satellite images from the Sentinel-2 satellites. These acquired images are then stored in Amazon S3.
- AWS Lambda is triggered to preprocess the raw Sentinel-2 imagery.
- Another AWS Lambda function is triggered to process and chunk the large satellite images into smaller, manageable pieces. The chunked data is stored back in Amazon S3.
- AWS Step Functions orchestrate the entire workflow, ensuring each step is executed in the correct sequence. Step Functions trigger AWS Fargate to run containerized prediction tasks.
- AWS SageMaker is used to perform model inference on the chunked data. The deep learning model analyzes the data chunks to detect deforestation, generating prediction results. These prediction results are stored back in Amazon S3.
- The prediction results are processed by a tiling mechanism to generate map tiles. These map tiles are stored in Amazon S3 for efficient visualization.
- Amazon CloudFront is used to deliver the map tiles to end-users. CloudFront caches the tiles at multiple edge locations worldwide, ensuring quick access and low latency for a smooth user experience.
- Throughout the entire process, Amazon CloudWatch continuously monitors the pipeline’s performance and health. CloudWatch tracks metrics such as execution times, error rates, and resource utilization. If any issues are detected, CloudWatch sets off alarms and sends notifications, enabling quick troubleshooting and ensuring the reliability of the pipeline.
By following these steps, the Deforestation Detection Pipeline Cloud Architecture works seamlessly to acquire, process, and visualize satellite imagery, providing a scalable, efficient, and automated solution for near real-time deforestation detection.
III. Conclusion

In this blog, we talked about the details of building a near real-time global deforestation detection pipeline using Amazon Web Services (AWS). We outlined the process from the acquisition of Sentinel-2 satellite imagery to the final delivery of deforestation predictions. By using AWS infrastructure, we can automate the entire workflow, ensuring that we receive and process new satellite imagery every 5 days to maintain timely deforestation monitoring.
The pipeline integrates several AWS services, including Amazon S3 for data storage, AWS Lambda for preprocessing and chunking data, AWS SageMaker for running the deep learning model, AWS Step Functions for orchestrating the workflow, and AWS Fargate for executing containerized tasks. Additionally, we talked about using a tiling mechanism to generate map tiles for efficient visualization, which are delivered to end-users via Amazon CloudFront. Throughout the process, Amazon CloudWatch monitors the system’s performance, ensuring reliability and quick issue resolution.
By implementing this pipeline, we can achieve a scalable and efficient solution for near real-time deforestation detection, providing valuable insights for environmental monitoring. While this blog focuses on AWS, the principles and methods discussed can be adapted to other cloud platforms like Microsoft Azure or Google Cloud Platform (GCP), demonstrating the versatility and importance of cloud-based solutions in addressing critical global challenges such as deforestation.
메타데이터
- post_id
- 9ac34e79e16a
- slug
- building-a-near-real-time-global-deforestation-detection-pipeline-on-cloud-9ac34e79e16a
- url
- https://medium.com/@akhil.chibber/building-a-near-real-time-global-deforestation-detection-pipeline-on-cloud-9ac34e79e16a
- canonical_url
- https://medium.com/@akhil.chibber/building-a-near-real-time-global-deforestation-detection-pipeline-on-cloud-9ac34e79e16a
- author_url
- https://medium.com/@akhil.chibber
- status
- ok
- fetched_at
- 2026-06-18 07:02:39





